

Abstract
BACKGROUND:
Medication therapy management (MTM) programs are designed to improve clinical outcomes and enhance appropriate medication use. Comprehensive medication reviews (CMRs) and targeted medication reviews (TMRs) are 2 broad interventions defined within MTM services. While MTM services have been extensively researched, there are few comparisons of CMR versus non-CMR interventions. Given the variability in MTM interventions and lack of a consistent TMR definition in the literature, this study sought to compare CMRs and TMRs that were clearly defined based on Centers for Medicare & Medicaid Services (CMS) criteria.
OBJECTIVES:
To (a) compare acute inpatient admissions and emergency department (ED) visits between patients participating in MTM services (CMR, TMR, or both) and eligible nonparticipating patients and (b) examine the effect of receiving TMR services on medication adherence.
METHODS:
This was a retrospective cohort study of patients with Medicare Part D coverage who received MTM services and a 1:1 propensity score-matched control group. Participants had to be eligible for MTM services in 2014 or 2015 based on CMS requirements. CMRs were offered to all MTM-eligible patients, while TMRs were completed based on clinical rules that helped identify medication-related problems (MRPs). The date of MTM intervention, or eligibility for the control group, was considered the index date. Participants had to be continuously enrolled in a Medicare Advantage plan that included prescription drug coverage during the study period and have at least 6 months of data before and after the index date. Medical and pharmacy claims were assessed to examine trend-adjusted inpatient admissions and ED visits from pre-index to post-index date for participants and matched controls.
RESULTS:
In 2014 and 2015, receipt of TMR interventions was associated with statistically significant reductions in acute inpatient admissions. In 2014, there were 55.2 fewer admits per 1,000 individuals (95% CI = 29-81) and 30.8 fewer admits per 1,000 individuals in 2015 (95% CI = 20-42). Receipt of CMR-only interventions was associated with fewer acute inpatient admissions only when coupled with preidentification of MRPs (36.8 [95% CI = 25-49] fewer admits per 1,000 individuals). In 2015, there were significant reductions in ED visits for participants receiving TMR-only interventions or TMR/CMR interventions (26.1 [95% CI = 11-41] and 12.0 [95% CI = 1-23] fewer ED visits per 1,000 individuals, respectively). In both years, a larger percentage (0.4% for oral diabetes medications; 7.7% for antihypertensives; 3.0% for statins) of MTM participants had greater improvements in medication adherence in the post-index period compared with controls.
CONCLUSIONS:
Receiving MTM services targeted at resolution of MRPs (TMR or CMR/TMR) resulted in positive reductions in health care utilization and increases in medication adherence. Given the importance of optimal medication utilization, this study highlights the need for additional focus on resolution of MRPs through TMRs and CMRs that can support improved clinical outcomes.
What is already known about this subject
Medication therapy management (MTM) programs are intended to improve clinical outcomes by reducing the risk for adverse drug events and enhancing appropriate medication use.
Only a limited number of studies have compared outcomes associated with comprehensive medication review (CMR) versus non-CMR interventions and have demonstrated potentially greater benefits from non-CMR benefits.
What this study adds
MTM interventions targeted at resolving medication-related problems (MRPs) were associated with positive reductions in health care utilization and increases in medication adherence.
Identifying patients with MRPs before any MTM service indicated an existing unmet need, and these patients were more likely to benefit from MTM services.
Medication therapy management (MTM) programs were implemented for Medicare Part D participants as a patient-centered method to improve clinical outcomes by reducing the risk for adverse drug events (ADEs) and enhancing appropriate medication use.1 General MTM eligibility criteria are defined by the Centers for Medicare & Medicaid Services (CMS), and health plans apply their own specific criteria, as approved by CMS, to identify MTM-eligible individuals within their populations. There are 2 broad types of medication reviews defined within MTM services: a comprehensive medication review (CMR) and a targeted medication review (TMR). CMRs, which are required annually by CMS for every MTM-eligible patient, encompass a comprehensive, systematic review of all available patient-specific information and medication assessments. In conjunction with the patient, caregiver, and prescriber, a corresponding medication action plan for resolving potential medication-related problems (MRPs) is developed. CMRs are provided via interactive patient consults, and an individualized written summary in standardized CMS format, along with a personalized medication list, is provided to enhance medication knowledge and empower self-management.
Targeted medication reviews (TMR), which are required at least quarterly, represent ongoing medication monitoring by the plan sponsor to assess medication use and identify and address specific actual or potential MRPs, such as duplicative therapies, drug-drug interactions, or medication nonadherence. Once an MRP is identified, generally by the MTM provider (i.e., pharmacist) or via clinical rules engines, the MTM provider follows up with the prescriber or patient with the goal of resolving the MRP through a TMR. Follow-up visit types (e.g., CMRs, TMRs, or both) may vary by plans.
Evidence of the effects of MTM is abundant and is largely favorable toward provision of MTM interventions. A recent review of 31 medium- to high-quality systematic reviews (representing 297 unique studies) of MTM in community settings reported favorable outcomes for blood pressure, cholesterol and diabetes control, anticoagulation, asthma, and chronic obstructive pulmonary disease (COPD) management. Positive outcomes for medication optimization/management, medication adherence, quality of life and patient satisfaction, and medication knowledge have also been reported.2 Other studies have reported associations between MTM services and reduced ADEs, fewer hospital readmissions, lower total health care costs, and improved appropriate medication use.3-18 A limited number of studies compared CMR with non-CMR interventions, but variability in intervention design and characterization of non-CMR interventions make comparisons across different studies a challenge and provided few specifics regarding TMR services.3,4,6-8
Within MTM programs, the CMR completion rate is currently evaluated as one of the CMS star measures, which incentivizes Part D health plans to focus on CMRs. In contrast, the resolution of MRPs identified during TMRs is not a star measure, despite emerging data that non-CMR interventions may be more effective.3,8 A systematic review found very limited understanding of specific MTM interventions and their effects on outcomes even though this information is key to evaluating the effectiveness of MTM interventions.19 TMRs are unique from CMRs in that they address a specific, preidentified medication issue, require less time with the patient, and are perhaps easier to comprehend and implement. The strategic focus of TMRs may also facilitate better communication with prescribers, thus increasing the opportunity for collaborative resolution of issues. Given the variability in MTM interventions and lack of a consistent TMR definition in the literature, this study sought to compare patients receiving CMRs and TMRs who were clearly defined based on CMS criteria.
The objectives of this study were to (a) compare acute inpatient admissions and emergency department (ED) visits between patients participating in MTM services (CMR, TMR, or both) and eligible, nonparticipating patients and (b) examine the effect of receiving TMR services on medication adherence.
Methods
Study Design
This retrospective, propensity score-matched cohort study included patients with Medicare Part D coverage who received MTM services between January 1, 2014, and December 31, 2015. Patients were propensity score-matched 1:1 with patients eligible for MTM services but who did not receive them during the same period (control group). The study was conducted by Humana, a health and wellness company with Medicare Advantage prescription drug (MAPD) plans covering the United States. The study was reviewed and approved by the Advarra Institutional Review Board.
Study Population
Study participants included patients eligible to receive MTM services in 2014 or 2015. MTM eligibility was based on CMS requirements and included individuals who (a) had at least 3 of the 5 core chronic conditions (diabetes, heart failure, hypertension, hyperlipidemia, and osteoporosis); (b) were prescribed at least 8 chronic medications; and (c) met the minimum medication spend set for Medicare Part D each year ($3,017 in 2014 and $3,138 in 2015).20 CMRs were offered via plan outreach or directly by MTM providers to all patients identified as MTM-eligible. For TMRs, reports based on clinical rules that helped identify MRPs were generated when new prescription claims were received and made available to MTM providers. Eligible nonparticipants included patients who were eligible for MTM services but refused or could not be contacted after outreach.
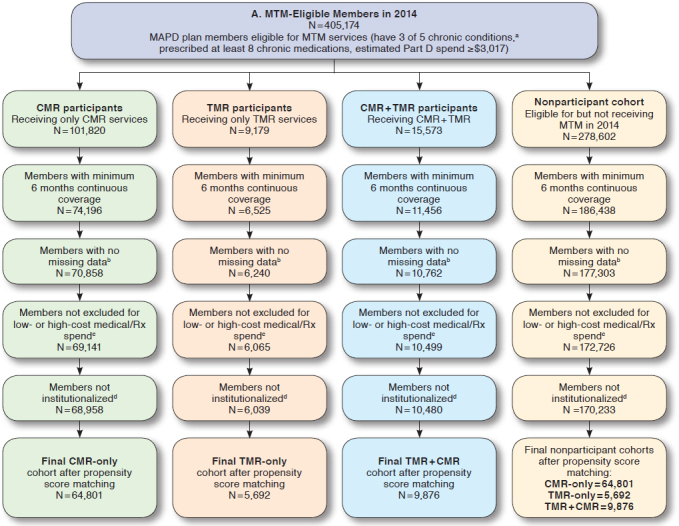
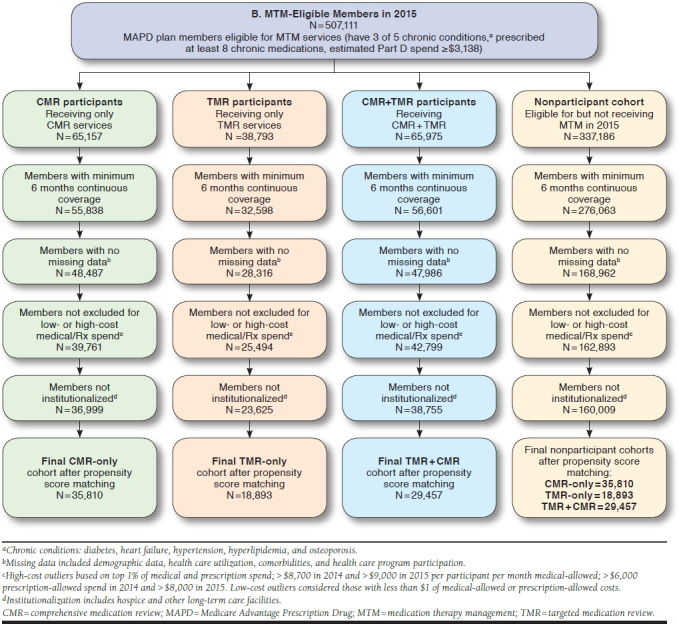
All patients in the study were also required to be continuously enrolled in an MAPD plan during the study period (Appendix, available in online article) and have a minimum of 6 months medical and prescription coverage pre- and post-MTM intervention (or MTM eligibility for controls). Date of the first MTM service within a calendar year, captured from an internal MTM data management system, was considered the index date for participants. Date of MTM eligibility was considered the index date for nonparticipants. There were no meaningful differences in the distribution of index dates between participants and nonparticipants. Patients meeting the following criteria were excluded from analyses: (a) had no claims (zero dollars) for medical or drug expenditures during the pre-index period; (b) were considered an outlier, with medical and pharmacy costs in the top 1% of the eligible cohort; (c) utilized long-term care or hospice in the pre-index period; or (d) were missing any data necessary for the matching analysis (i.e., demographic, comorbidities, and health care utilization variables). Two separate analyses of the MTM program were conducted. The 2014 analysis consisted of patients eligible for MTM services from January 1, 2014, through December 31, 2014. The 2015 analysis of patients eligible for MTM services from January 1, 2015, through December 31, 2015, was conducted to confirm or refute the findings from the 2014 analysis.
Propensity Score Matching
Participants receiving MTM services were matched to MTM-eligible nonparticipants using propensity score matching. To create comparable groups of participants and nonparticipants, the propensity score-matching model included potential confounding factors at baseline (i.e., 12 months before index date), such as patient demographic information (e.g., age, gender, and geographic residence); health care utilization in the baseline (e.g., visit count for emergency department [ED] visits, physician visits, urgent care visits, and acute admissions to hospital); chronic condition diagnosis history, medical expenditures, and drug expenditures in the baseline; and participation in other clinical/pharmacy health programs. Participants and non-participants were also matched on which MTM service they received (participants) or were eligible for (nonparticipants): CMR-only, TMR-only, or both CMR and TMR services within the same year. For patients who received or were eligible to receive TMR services, matching accounted for the MRP, such as medication nonadherence, high-risk medication utilization, needing a cost-effective alternative medication, and drug-drug interactions. In the 2015 analysis, patients in the CMR-only cohort were also matched on whether or not the patient had MRPs identified before MTM intervention that were not acted upon, as evidenced by an MRP without a completed TMR. Propensity score matching was conducted separately for each year, since eligible patients for 2014 and 2015 were treated as independent cohorts.
Study Outcomes and Statistical Analysis
Trend-adjusted inpatient admissions and ED visits were the primary outcomes of interest. Trend is the natural rate of growth or decline in utilization of a population due to factors such as inflation, aging, or regression to the mean. Establishing a nonparticipant group trend is one method to take into account this phenomenon (i.e., the trend in a similar population in the absence of the intervention). While trend adjustment is similar to a difference-in-difference approach, it takes into account the assumption that health care utilization and costs are multiplicative rather than additive.21,22 Trend adjustment was first established by examining the pre- to post-index change in inpatient admissions and ED visits for eligible nonparticipants to determine expected trends in the absence of MTM interventions. Pre-index participant inpatient admissions and ED visits were then multiplied by the expected trends and compared with the actual post-index inpatient admissions and ED visits for MTM service participants as follows:
Baseline and outcome measures were calculated on a per-patient per-month basis. Mean inpatient and ED utilization for each cohort was calculated in the pre- and post-index periods. While all patients had a minimum of 6 months pre- and post-index data, up to 12 months of data were used for patients having sufficient continuous health plan enrollment. Baseline characteristics between participants and nonparticipants were examined using chi-square statistical tests for binary variables and one-way analysis of variance (ANOVA) tests for continuous variables, with an a priori significance level of 0.05. Bootstrapping was used to estimate confidence intervals around clinical outcomes, inpatient admissions, and ED visits. This method used 1,000 sample iterations of the matched pairs and estimated statistical parameters to reduce sampling error.
Medication adherence was assessed in the TMR-only cohort for matched pairs with an MRP indicating nonadherence with oral diabetes, hypertension, or lipid disorder (statin) medications. Adherence was determined based on proportion of days covered (PDC) for a particular drug class before and after a TMR. The proportion of patients shifting from nonadherent in the 6 months before the TMR intervention to adherent (PDC ≥ 0.8) in the 6 months after the TMR was examined. Z-scores were used to determine if differences between the proportion of participants and eligible nonparticipants who shifted from nonadherent to adherent was statistically significant. All analyses were conducted using SAS Enterprise Guide, version 7.1 (SAS Institute, Cary, NC).
Results
In 2014, there were 64,801 participants and 64,801 matched nonparticipants in the CMR-only group, 5,692 matched pairs in the TMR-only group, and 9,876 matched pairs in the CMR/TMR group (Table 1). The majority of patients were female with a mean age between 70 and 72 years. Nearly 90% had hypertension, > 50% had diabetes, and approximately 40% had COPD. The average length of continuous enrollment for participants and nonparticipants was 11 months, which was also factored into utilization calculations. Among patients receiving or eligible for a TMR intervention, over 50% of MRPs were related to medication nonadherence (Table 2).
TABLE 1.
Pre-Index Characteristics of MTM Matched Pairs Cohorts
| Characteristic | 2014 | |||||
|---|---|---|---|---|---|---|
| CMR-Onlya n = 64,801 | TMR-Onlya n = 5,692 | CMR/TMRa n = 9,876 | ||||
| Participants | Nonparticipants | Participants | Nonparticipants | Participants | Nonparticipants | |
| Age, mean± SD | 72 ± 9.4 | 71 ± 9.9 | 71 ± 10.3 | 71 ± 9.5 | 71 ± 9.0 | |
| Female, n (%) | 38,233 (59) | 38,233 (59) | 3,321 (58) | 3,280 (58) | 6,024 (61) | 5,929 (61) |
| Chronic conditions, n (%) | ||||||
| Hypertension | 56,377 (87) | 56,377 (87) | 5,018 (88) | 5,032 (88) | 8,592 (87) | 8,552 (87) |
| Diabetes | 32,401 (50) | 32,400 (50) | 3,036 (53) | 3,011 (53) | 5,333 (54) | 5,313 (54) |
| COPD | 25,272 (39) | 25,270 (39) | 2,277 (40) | 2,271 (40) | 4,049 (41) | 4,020 (41) |
| CAD | 12,960 (20) | 12,960 (20) | 1,106 (19) | 1,113 (20) | 1,975 (20) | 1,945 (20) |
| CHF | 3,888 (6) | 3,888 (6) | 410 (7) | 404 (7) | 691 (7) | 651 (7) |
| Monthlyb pharmacy spend, mean $ | 488 | 486 | 479 | 479 | 490 | 490 |
| Uniquec pharmacies, mean ± SD | 2.7 ± 1.4 | 2.74 ± 1.3 | 2.5 ± 1.5 | 2.5 ± 1.4 | 2.6 ± 1.4 | 2.6 ± 0.9 |
| Uniqued prescribers, mean ± SD | 14.6 ± 9.9 | 14.6 ± 9.7 | 15.5 ± 10.9 | 15.6 ± 10.9 | 15.2 ± 9.8 | 15.2 ± 9.0 |
| Characteristic | 2015 | |||||
| CMR-Onlya,e n = 35,810 | TMR-Onlya n = 18,893 | CMR/TMRa n = 29,457 | ||||
| Participants | Nonparticipants | Participants | Nonparticipants | Participants | Nonparticipants | |
| Age, mean ± SD | 72 ± 9.3 | 72 ± 9.9 | 70 ± 9.8 | 71 ± 3.2 | 71 ± 9.2 | 71 ± 10.2 |
| Female, n (%) | 21,339 (60) | 20,770 (60) | 10,829 (57) | 11,014 (58) | 17,323 (59) | 17,234 (59) |
| Chronic conditions, n (%) | ||||||
| Hypertension | 32,014 (89) | 31,510 (88) | 17,165 (91) | 17,306 (92) | 26,527 (90) | 25,892 (89) |
| Diabetes | 17,074 (48) | 16,759 (47) | 10,388 (55) | 10,315 (55) | 16,443 (56) | 16,466 (56) |
| COPD | 14,215 (40) | 13,957 (39) | 8,062 (43) | 7,820 (41) | 12,913 (44) | 12,812 (43) |
| CAD | 6,471 (18) | 6,442 (18) | 3,695 (19) | 3,476 (18) | 5,980 (20) | 6,303 (21) |
| CHF | 2,290 (6) | 2,041 (6) | 1,467 (8) | 1,511 (8) | 2,289 (8) | 2,179 (7) |
| Monthlyb pharmacy spend, mean $ | 584 | 587 | 568 | 556 | 606 | 605 |
| Uniquec pharmacies, mean ± SD | 2.9 ± 1.4 | 2.9 ± 1.5 | 2.7 ± 1.5 | 2.6 ± 1.9 | 2.8 ± 1.5 | 2.7 ± 1.8 |
| Uniqued prescribers, mean ± SD | 14.6 ± 9.8 | 14.6 ± 9.9 | 15.9 ± 11.0 | 15.8 ± 7.3 | 15.8 ± 10.6 | 15.7 ± 9.6 |
aIndicates number of matched pairs within cohort.
bCalculated as per person per month for each individual’s 6- to 12-month pre-index period.
cDetermined using National Board of Pharmacy identification in 12-month pre-index period.
dDetermined by using provider identification number within Humana in the 12-month pre-index period.
eCharacteristics for entire CMR-only cohort, regardless of whether the patient had identified medication-related problems.
CAD = coronary artery disease; CHF = congestive heart failure; COPD = chronic obstructive pulmonary disease; CMR = comprehensive medication review; MTM = medication therapy management; SD = standard deviation; TMR = targeted medication review.
TABLE 2.
Medication-Related Problems
| MRP Categories | 2014 | 2015 | ||
|---|---|---|---|---|
| TMR-Only Matched Pairs | CMR + TMR Matched Pairs | TMR-Only Matched Pairs | CMR + TMR Matched Pairs | |
| Medication adherence, n (%) | 3,474 (61) | 4,984 (50) | 26,494 (87) | 25,514 (87) |
| Needs additional therapy, n (%) | 80 (14) | 1,834 (19) | 958 (5) | 1,427 (3) |
| High-risk medication, n (%) | 707 (12) | 1,465 (15) | 858 (5) | 1,484 (5) |
| Cost-effective alternative, n (%) | 707 (12) | 1,425 (14) | 0 (0) | 841 (3) |
| Drug interaction, n (%) | 0 (0) | 168 (2) | 150 (1) | 191 (1) |
| Other, n (%) | 0 (0) | 0 (0) | 433 (2) | 0 (0) |
| Total matched pairs, n | 5,692 | 9,876 | 18,893 | 29,457 |
CMR = comprehensive medication review; MRP = medication-related problem; TMR = targeted medication review.
In 2015, 35,810 participants and matched controls were included in the CMR-only group, of which 13,416 (37.5%) did not have an identified MRP, and 22,394 (62.5%) had an identified MRP, which was not addressed (TMR not completed; cohort not identified in 2014 analysis). There were 18,893 participants and matched controls in the TMR-only group and 29,457 in the CMR/TMR group. Similar to 2014, most of these individuals were female and over 70 years of age, with hypertension (89%-91%), diabetes (48%-56%), or COPD (40%-44%). The average length of continuous enrollment for participants and nonparticipants was 11 months. On average, individuals in each MTM cohort utilized > 2 unique pharmacies in the pre-index period and over 14 unique prescribers. Almost 90% of the MRPs associated with TMRs were related to medication nonadherence (Table 2).
Health Care Utilization
In 2014 and 2015, receipt of TMR-only interventions was associated with statistically significant reductions in acute inpatient admissions compared with matched nonparticipants (Table 3). Receiving a TMR and CMR in the same calendar year was also associated with reductions in inpatient admissions that were marginally greater than those receiving TMR-only interventions. Among the CMR-only cohort, there were no statistically significant differences in acute inpatient admissions between participants and nonparticipants in 2014 or in the 2015 CMR-only cohort with no identified MRPs. However, among the 2015 CMR-only cohort with preidentified known MRPs, MTM participants had 36.8 fewer acute inpatient admissions than nonparticipants.
TABLE 3.
Trend-Adjusted Changes in Health Care Resource Utilization by Year and Intervention Type
| 2014 | 2015 | ||||||
|---|---|---|---|---|---|---|---|
| EDa Visits/1,000 | Inpatient Admissions/1,000 | EDa Visits/1,000 | Inpatient Admissions/1,000 | ||||
| Without MRP | With MRP | Without MRP | With MRP | ||||
| CMR-only | |||||||
| Preperiod | MTM participants | 587.0 | 253.4 | 562.2 | 635.7 | 255.9 | 291.6 |
| Controls | 586.0 | 252.9 | 600.1 | 631.6 | 290.5 | 277.6 | |
| Postperiod | MTM participants | 644.9 | 405.6 | 582.5 | 680.7 | 297.2 | 395.2 |
| Controls | 638.5 | 404.7 | 619.1 | 708.9 | 329.0 | 411.2 | |
| Changeb (95% CI) | -5.3 (-12-2) | 0.0 (-7-7) | -2.4 (-17-13) | 32.8 (19-47) | -7.4 (-18-4) | 36.8 (25-49) | |
| TMR-only | |||||||
| Preperiod | MTM participants | 746.3 | 391.6 | 761.2 | 326.7 | ||
| Controls | 737.4 | 387.2 | 755.1 | 322.7 | |||
| Postperiod | MTM participants | 773.0 | 464.2 | 774.9 | 441.1 | ||
| Controls | 743.3 | 513.5 | 794.5 | 466.0 | |||
| Changeb, (95% CI) | -20.7 (-48-8) | 55.2 (29-81) | 26.1 (11-41) | 30.8 (20-42) | |||
| CMR/TMRc | |||||||
| Preperiod | MTM participants | 687.8 | 280.8 | 726.3 | 318.2 | ||
| Controls | 684.1 | 277.1 | 719.7 | 318.4 | |||
| Postperiod | MTM participants | 751.9 | 453.0 | 761.8 | 417.6 | ||
| Controls | 762.5 | 508.4 | 766.7 | 455.8 | |||
| Changeb, (95% CI) | 14.7 (-8-38) | 62.1 (43-82) | 12 (1-23) | 37.9 (28-48) | |||
aCalculated and reported as utilization per 1,000 individuals.
bTrend-adjusted changes were calculated using the following formula: (Test Pre x Control Post) ÷ (Control Pre) – Test Post.
cCMR and TMR occurred in the same plan year.
CI = confidence interval; CMR = comprehensive medication review; ED = emergency department; MTM = medication therapy management; TMR = targeted medication review.
In 2014, there were no statistically significant differences in ED visits for any of the MTM intervention groups (Table 3). However, the 2015 analysis showed significant reductions in ED visits for participants receiving TMR-only or TMR/CMR interventions. As was seen with inpatient admissions, MTM participants with CMR-only interventions and known MRPs experienced significant reductions in ED visits in 2015, while participants without identified MRPs did not.
Medication Adherence
A total of 3,474 participants and matched controls in 2014 and 16,494 in 2015 were identified as having a TMR-only intervention for nonadherence. In both years, a larger percentage of participants initially nonadherent with oral diabetes, antihypertensive, or statin medications in the pre-index period improved adherence in the post-index period compared with controls (Table 4). In 2014, significant differences were only noted for antihypertensive and statin medication groups, while patients in all 3 medication groups had significantly improved adherence in 2015.
TABLE 4.
Change in Medication Adherence Following TMR
| 2014 | 2015 | |||
|---|---|---|---|---|
| Nonadherent in Pre-Index Period, n | Converted to Adherent Post-Index, n (%) | Nonadherent in Pre-Index Period, n | Converted to Adherent Post-Index, n (%) | |
| Oral diabetes medications | ||||
| MTM participants | 239 | 105 (43.9) | 1,019 | 522 (51.7) |
| Controls | 217 | 81 (37.3) | 853 | 388 (45.5) |
| Increase | 6.6%; P = 0.15 | 6.2%; P< 0.01 | ||
| Antihypertensives | ||||
| MTM participants | 657 | 297 (45.2) | 1,881 | 1,136 (60.4) |
| Controls | 616 | 199 (32.3) | 1,126 | 622 (55.2) |
| Increase | 12.9%; P< 0.01 | 5.2%; P< 0.01 | ||
| Statins | ||||
| MTM participants | 492 | 235 (47.8) | 1,703 | 991 (58.2) |
| Controls | 339 | 124 (36.6) | 895 | 447 (49.9) |
| Increase | 11.2%; | P< 0.01 | 8.2%; | P< 0.01 |
Notes: Only participants identified as nonadherent (PDC < 0.80) during the 6-month pre-index period were included in the analysis. Among nonadherent patients, conversion to adherence was based on PDC ≥ 0.80 during the 6 months after the TMR service date or assigned index date.
MTM = medication therapy management; PDC = proportion of days covered; TMR = targeted medication review.
Discussion
This analysis of over 80,000 Medicare patients receiving MTM services demonstrated a positive association between receiving TMR interventions and improved clinical outcomes. Perhaps TMR interventions, alone or in conjunction with a CMR, allowed pharmacists to tailor the intervention to patients’ individual medication-related needs. Review of a clinical rules-based report helped identify MRPs in near real time that could then be addressed during TMRs. Additionally, patients may be eligible to receive multiple TMRs within a calendar year based on the patient’s needs and the frequency of MRPs arising throughout the year. This analysis showed that patients receiving TMRs and CMRs completed in conjunction with an identified MRP had reductions in inpatient admissions and ED visits and clinically significant improvements in medication adherence. A previous peer-reviewed clinical outcome-based prospective cohort study similarly showed that TMR interventions targeted at 6 high-risk medications were associated with a significantly reduced risk of having an ADE when pharmacist recommendations were followed versus not followed.4
In the CMR-only population, this 2-year study also highlighted the benefit of providing MTM interventions to patients with specific MRPs. CMRs, which are extensive, comprehensive reviews of all of a patient’s medications, are offered to all MTM-eligible patients only once per year, regardless of evidence of preidentified MRPs. While the 2014 analysis showed no clinical benefit for the overall CMR-only cohort, the 2015 CMR-only population was further examined to understand the differences between patients who received CMR-only services with identified MRPs versus those without MRPs. The 2015 analysis revealed that CMR-only patients with identified MRPs had statistically significant reductions in both inpatient admissions and ED visits, whereas those without known MRPs did not. Even though a TMR intervention was not provided, generation of an MRP flag indicated that some unmet medication-related need existed and the patient would most likely benefit from MTM services.
Among patients with no known MRPs, the effect of providing MTM services is not evident from this study. Another retrospective cross-sectional study evaluated CMR versus non-CMR interventions in a university clinic and found similar results.3 Despite more pharmacist-recommended medication changes per patient with CMR services, non-CMR patients had higher odds of an appropriate medication change.3 Yet another analysis found that CMR services coupled with a TMR-like intervention decreased subsequent dispensing of medications that should be avoided in the elderly.7 While more research is needed in this area, a growing body of evidence suggests that conducting CMRs in populations with known medication needs may be more beneficial than when medication needs are unknown. MTM resources can be prioritized accordingly.
While the correlation between medication adherence and improved clinical outcomes has been well established in the literature, the effect of MTM interventions, and specifically TMRs, on medication adherence has been inconsistent.5,23-28 Despite the medication adherence challenges in an MTM-eligible population with a high rate of polypharmacy, this analysis highlighted the positive effect of TMR intervention on medication adherence across several classes of chronic medications. The majority of MRPs identified and addressed with a TMR were related to medication nonadherence, a finding similar to those from a study of 2 health systems in collaboration with a pharmacy benefit manager, where a TMR-like MTM intervention was provided for patients with diabetes and at least 15 prescribed medications.6 The study found that recommendations related to medication adherence were most often accepted by patients.6
In the current quality landscape, CMR interventions are a stars quality metric.1 Thus, a primary focus of MTM services is completing CMR interventions for all eligible patients, which may limit time and resources for more opportunistic TMR activities. Based on these study results and other evidence, MTM services targeted at resolving specific MRPs are more likely to positively affect clinical outcomes than general CMR interventions without identified MRPs.3 Additionally, provision of non-CMR interventions for patients with an identified MRP was shown to be more cost-effective than CMR interventions.8 Based on available current evidence, there is support for focusing on the resolution of MRPs identified through the MTM program due to association of these services (i.e., TMRs) with positive clinical outcomes.
Limitations
Certain study limitations should be considered when interpreting these results. This was a claims-based analysis with inherent limitations related to missing or incorrect data and lack of relevant data not included in claims. Small sample sizes for certain MRP categories may not be representative of a larger population. All services were conducted within a single health plan with participants concentrated in southern and midwestern states and may not be generalizable to other health plans or regions given that definitions of CMR and TMR, the frequency of offering these services, and the specific interventions offered (i.e., adherence and cost) may vary based on plan. It should also be noted that Humana and the overall health system have other interventions targeted to improve health care utilization metrics. While the analysis controlled for patient involvement in other clinical/pharmacy programs, this observational study cannot evaluate causation, and any improvements noted cannot be attributed to a specific intervention. The medication adherence analysis was limited to those patients who were nonadherent before the index date; therefore, due to sample size limitations, some matched pairs in the TMR medication adherence cohort were separated. Additionally, there may have been residual bias and a potential for mismatches based on unmeasured covariates, including reasons for patient nonengagement in the program. However, well-balanced propensity score-matched groups often remove variance of individual characteristics. Additionally, variability is reduced by providing prepopulated interventions based on common issues identified within the cohort and conducting standardized training to pharmacists providing MTM services.
Conclusions
Patients receiving TMR services or combination CMR/TMR services are most likely to benefit from MTM services, given the positive reductions in health care utilization and increases in medication adherence. While CMR services alone in the absence of MRPs did not provide benefit to participants relative to nonparticipants, this study highlights the need for additional focus on the resolution of MRPs through targeted services such as TMRs. Given the increasing importance of optimal medication utilization, it is essential to understand which MTM services will produce positive clinical outcomes among eligible patients.
ACKNOWLEDGMENTS
The authors thank Charron Long, PharmD, for her support in drafting and formatting the manuscript.
APPENDIX. Sample Selection Flowcharts: 2014 and 2015 Cohorts
REFERENCES
- 1.Centers for Disease Control and Prevention . Calculating proportion of days covered (PDC) for antihypertensive and antidiabetic medications: an evaluation guide for grantees. August 2015. Available at: https://www.cdc.gov/dhdsp/docs/med-adherence-evaluation-tool.pdf. Accessed April 25, 2019.
- 2.Jokanovic N, Tan EC, Sudhakaran S, et al. Pharmacist-led medication review in community settings: an overview of systematic reviews. Res Social Adm Pharm. 2017;13(4):661-85. [DOI] [PubMed] [Google Scholar]
- 3.Buhl A, Augustine J, Taylor AM, Martin R, Warholak TL. Positive medication changes resulting from comprehensive and noncomprehensive medication reviews in a Medicare Part D population. J Manag Care Spec Pharm. 2017;23(3):388-94. Available at: https://www.jmcp.org/doi/10.18553/jmcp.2017.23.3.388. [DOI] [PMC free article] [PubMed] [Google Scholar]
- 4.Morrison C, Macrae Y. Promoting safer use of high-risk pharmacotherapy: impact of pharmacist-led targeted medication reviews. Drugs Real World Outcomes. 2015;2(3):261-71. [DOI] [PMC free article] [PubMed] [Google Scholar]
- 5.Moore JM, Shartle D, Faudskar L, Matlin OS, Brennan TA. Impact of a patient-centered pharmacy program and intervention in a high-risk group. J Manag Care Spec Pharm. 2013;19(3):228-36. Available at: https://www.jmcp.org/doi/10.18553/jmcp.2013.19.3.228. [DOI] [PMC free article] [PubMed] [Google Scholar]
- 6.Brophy L, Williams A, Berman EJ, et al. Collaborative DTM reduces hospitalization and healthcare costs in patients with diabetes treated with polypharmacy. Am J Manag Care. 2014;20 (3):e72-81. [PubMed] [Google Scholar]
- 7.Caffiero N, Delate T, Ehizuelen MD, Vogel K. Effectiveness of a clinical pharmacist medication therapy management program in discontinuation of drugs to avoid in the elderly. J Manag Care Spec Pharm. 2017;23(5):525-31. Available at: https://www.jmcp.org/doi/full/10.18553/jmcp.2017.23.5.525. [DOI] [PMC free article] [PubMed] [Google Scholar]
- 8.Chinthammit C, Armstrong EP, Boesen K, Martin R, Taylor AM, Warholak T. Cost-effectiveness of comprehensive medication reviews versus noncomprehensive medication review interventions and subsequent successful medication changes in a Medicare Part D population. J Manag Care Spec Pharm. 2015;21(5):381-89. Available at: https://www.jmcp.org/doi/abs/10.18553/jmcp.2015.21.5.381. [DOI] [PMC free article] [PubMed] [Google Scholar]
- 9.Vira T, Colquhoun M, Etchells E. Reconcilable differences: correcting medication errors at hospital admission and discharge. Qual Saf Health Care. 2006;15(2):122-26. [DOI] [PMC free article] [PubMed] [Google Scholar]
- 10.Nickerson A, Mackinnon NJ, Roberts N, Saulnier L. Drug-therapy problems, inconsistencies and omissions identified during a medication reconciliation and seamless care service. Healthc Q. 2005;8(Spec No):65-72. [DOI] [PubMed] [Google Scholar]
- 11.Pronovost P, Weast B, Schwarz M, et al. Medication reconciliation: a practical tool to reduce the risk of medication errors. J Crit Care. 2003;18(4):201-05. [DOI] [PubMed] [Google Scholar]
- 12.Rodehaver C, Fearing D. Medication reconciliation in acute care: ensuring an accurate drug regimen on admission and discharge. Jt Comm J Qual Patient Saf. 2005;31(7):406-13. [DOI] [PubMed] [Google Scholar]
- 13.Paquette-lamontagne N, Mclean WM, Besse L, Cusson J. Evaluation of a new integrated discharge prescription form. Ann Pharmacother. 2001;35 (7-8):953-58. [DOI] [PubMed] [Google Scholar]
- 14.Ensing HT, Stuijt CC, Van den bemt BJ, et al. Identifying the optimal role for pharmacists in care transitions: a systematic review. J Manag Care Spec Pharm. 2015;21(8):614-36. Available at: https://www.jmcp.org/doi/abs/10.18553/jmcp.2015.21.8.614. [DOI] [PMC free article] [PubMed] [Google Scholar]
- 15.Iyer R, Coderre P, Mckelvey T, et al. An employer-based, pharmacist intervention model for patients with type 2 diabetes. Am J Health Syst Pharm. 2010;67(4):312-16. [DOI] [PubMed] [Google Scholar]
- 16.Barnett MJ, Frank J, Wehring H, et al. Analysis of pharmacist-provided medication therapy management (MTM) services in community pharmacies over 7 years. J Manag Care Spec Pharm. 2009;15(1):18-31. Available at: https://www.jmcp.org/doi/abs/10.18553/jmcp.2009.15.1.18. [DOI] [PMC free article] [PubMed] [Google Scholar]
- 17.Wittayanukorn S, Westrick SC, Hansen RA, et al. Evaluation of medication therapy management services for patients with cardiovascular disease in a self-insured employer health plan. J Manag Care Spec Pharm. 2013;19(5):385-95. Available at: https://www.jmcp.org/doi/abs/10.18553/jmcp.2013.19.5.385. [DOI] [PMC free article] [PubMed] [Google Scholar]
- 18.Isetts BJ, Schondelmeyer SW, Artz MB, et al. Clinical and economic outcomes of medication therapy management services: the Minnesota experience. J Am Pharm Assoc (2003). 2008;48(2):203-11. [DOI] [PubMed] [Google Scholar]
- 19.Viswanathan M, Kahwati LC, Golin CE, et al. Medication therapy management interventions in outpatient settings: a systematic review and meta-analysis. JAMA Intern Med. 2015;175(1):76-87. [DOI] [PubMed] [Google Scholar]
- 20.Centers for Medicare & Medicaid Services . Drug utilization management, quality assurance, and medication therapy management programs. 42 CFR Ch. IV § 423.153. October 1, 2012. Available at: https://www.govinfo.gov/content/pkg/CFR-2012-title42-vol3/pdf/CFR-2012-title42-vol3-sec423-153.pdf. Accessed May 6, 2019.
- 21.Bedell W, Kaszkin-Bettag M. Coherence and health care cost-RCA actuarial study: a cost-effective cohort study. Altern Ther Health Med. 2010;16(4):26-31. [PubMed] [Google Scholar]
- 22.Dove HG, Duncan I. Paper 3: estimating savings, utilization rate changes, and return on investment. In: Part 1: an introduction to care management interventions. Available at: https://www.soa.org/globalassets/assets/Files/Research/Projects/Paper3-Literature-Review.pdf. Accessed May 13, 2019.
- 23.Boswell KA, Cook CL, Burch SP, Eaddy MT, Cantrell CR. Associating medication adherence with improved outcomes: a systematic literature review. Am J Pharm Benefits. 2012;4(4):e97-e108. [Google Scholar]
- 24.Akinbosoye OE, Taitel MS, Grana J, Hill J, Wade RL. Improving medication adherence and health care outcomes in a commercial population through a community pharmacy. Popul Health Manag. 2016;19(6):454-61. [DOI] [PMC free article] [PubMed] [Google Scholar]
- 25.Curtis SE, Boye KS, Lage MJ, Garcia-Perez LE. Medication adherence and improved outcomes among patients with type 2 diabetes. Am J Manag Care. 2017;23(7):e208-14. [PubMed] [Google Scholar]
- 26.Gold DT. Medication adherence: a challenge for patients with post-menopausal osteoporosis and other chronic illnesses. J Manag Care Spec Pharm. 2006;12(6 Suppl A):S20-25. Available at: https://www.jmcp.org/doi/10.18553/jmcp.2006.12.S6-A.S20/. [DOI] [PMC free article] [PubMed] [Google Scholar]
- 27.Moczygemba LR, Barner JC, Gabrillo ER. Outcomes of a Medicare Part D telephone medication therapy management program. J Am Pharm Assoc (2003). 2012;52(6):e144-52. [DOI] [PubMed] [Google Scholar]
- 28.Brummel AR, Soliman AM, Carlson AM, de Oliveira DR. Optimal diabetes care outcomes following face-to-face medication therapy management services. Popul Health Manag. 2013;16(1):28-34. [DOI] [PubMed] [Google Scholar]