

Abstract
Estimating medication adherence through the use of pharmacy claims-based adherence calculations such as medication possession ratio (MPR) and proportion of days covered (PDC) plays a significant role in specialty pharmacy practice. Although MPR and PDC are frequently used in clinical practice, calculation methodologies vary, making meaningful comparisons of adherence rates difficult. In addition, MPR and PDC are increasingly used by insurance companies, pharmacies, accrediting bodies, and drug manufacturers to demonstrate quality differences or clinical benefit across the specialty pharmacy industry. Therefore, recognizing the source and effect of calculation variability is necessary to fully understand reported adherence results.
This article highlights the challenges in standardizing adherence methodologies, minimum methodology considerations that should be reported with MPR and PDC results, and key elements to consider when interpreting and applying adherence results. Further, recommendations are provided to promote a more consistent description of calculation methods and to aid pharmacies in adherence measure analysis, interpretation, and application to practice, with a focus on specialty pharmacy programs. A detailed description of methodology as outlined in this article must be provided to ensure reproducibility, external validation, and scientific rigor.
In the absence of standardization, specialty pharmacies should be prudent in their use of adherence calculations as a clinical benchmarking tool or comparative quality indicator with outside organizations. Furthermore, specialty pharmacies should consider using current adherence measure calculations to identify and provide targeted interventions to patients with potential adherence problems and strive to better demonstrate ties between adherence measures and direct clinical and cost outcomes.
Current inconsistencies in adherence calculations severely limit the generalizability of the growing number of adherence studies. Research into calculation transparency has shown that fewer than 10% of publications on adherence named all parameters included in their investigations,1 and the majority had unclear methodological assumptions leading to impossible reproducibility or incorporation into a common body of research.2 The clinical, financial, and quality implications of medication adherence underscore the fundamental need to standardize and benchmark results. Here, we present considerations for calculating medication possession ratio (MPR) and proportion of days covered (PDC) and provide recommendations for describing calculation methodology and addressing common calculation challenges with an emphasis on their application to adherence with self-administered specialty medications.
The 2 most common methods to estimate medication adherence are MPR and PDC, but neither measure can confirm that medication was administered as prescribed; however, they can provide insight into how often a patient had medication available.3,4 In addition to this basic flaw, other limitations exist and will be discussed in detail within 2 general categories: (1) challenges with standardization and methodology and (2) challenges with interpretation and utilization. These challenges and lack of standardization leads to confusion and an inability to compare study results.5,6 Although some notable efforts to standardize adherence measures have been previously published,7,8 no singular entity has presented a statement addressing all potential calculation challenges. Organizations such as the Pharmacy Quality Alliance and International Society of Pharmacoeconomics and Outcomes Research and accrediting bodies such as URAC have approached the idea of calculation standardization, but a consistent message has not emerged.9
Various studies have demonstrated that poor medication adherence may result in treatment failures, excessive health care costs, more frequent hospitalizations, and an increased risk of premature death in certain disease states.10-14 Although this correlation may exist within individual studies, the lack of detailed methodology can bring into question whether the same results would be found if different calculation methods were used. Moreover, individual pharmacies may have comparatively smaller datasets in which adherence calculations may be inordinately sensitive to methodological differences. Despite these concerns, specialty pharmacies have increasing accountability for maintaining specific adherence standards.
Adherence metrics are increasingly being used to differentiate quality between pharmacies such as in direct and indirect remuneration fee calculations, payer network agreements, and accreditation standards. All of these can have considerable financial implications for specialty pharmacies and can leave pharmacies feeling like they are trying to navigate in a land of uncertainty without a guide to show them the way.15
Overview of Common Adherence Calculations
Although variability is common in MPR and PDC calculations, the general methods used to calculate MPR and PDC are typically described as the following5,6,9,16,17:
MPR = (Sum of days supply in time frame) ÷ (number of days in time frame) × 100
PDC = (Sum of days covered in time frame) ÷ (number of days in time frame) × 100
General Methods
Inclusion criteria often involve patients filling a certain number of designated prescriptions (e.g., ≥ 3 fills within the time frame) or patients having consistent payer plan enrollment. Adherence may be reported at the level of the patient, population, medication, or therapeutic class. Results are commonly presented as an average or as a proportion meeting a certain threshold (e.g., proportion of patients with MPR > 80%). Patients with gaps in therapy for clinically appropriate reasons, such as therapy holds due to tolerability issues or toxicity, are not typically removed in the calculation, since the datasets commonly used do not contain clinical insight. Pharmacies with access to clinical information such as electronic medical records may include or exclude these cases thereby potentially improving calculation precision. General differences between MPR and PDC are illustrated in Figure 1 through fill pattern case examples and the associated effect on MPR versus PDC.
FIGURE 1.
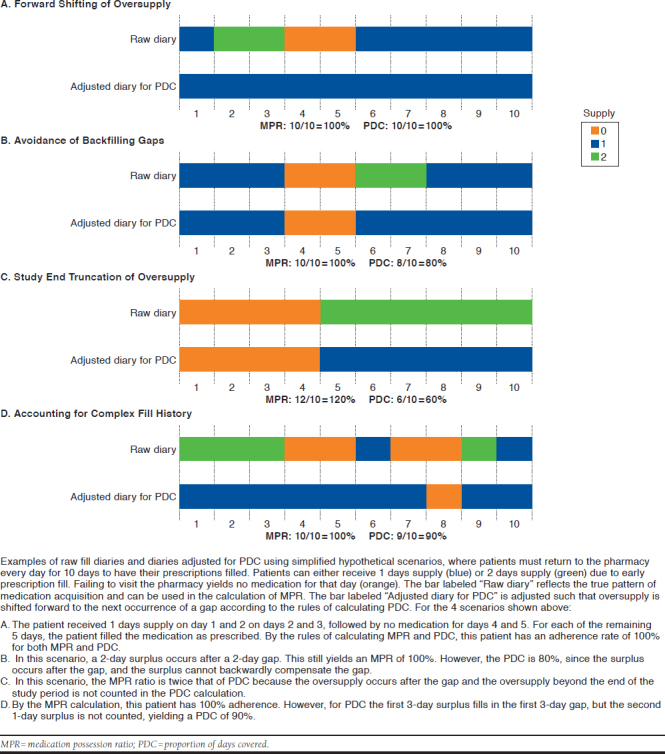
Illustration of Adherence Measure Variation
MPR Calculation
Variation in MPR calculations often involves time frame definitions, the handling of supply beyond the last fill date, and the reporting of values > 100%. The time frame is often defined either as a fixed interval or the time between the first and last fill. When using a fixed time frame (e.g., 1 year), MPR is calculated as follows: sum of days supply dispensed from the first fill until the end of the time frame ÷ sum of the number of days from the first fill until the end of the time frame.
It is not clear how the days supply provided by the last fill is appropriately handled in the numerator. Alternatively, MPR may include the time between the first and last fill in the denominator but exclude the days supply of the last fill in the numerator. MPR does not take into account the date of a fill, but rather the days supply dispensed and the days within the time frame. Therefore, there may be overlap due to early fills (green bars in Figure 1), leading to an overestimation of adherence possibly exceeding 100%. Values over 100% may or may not be truncated when reported, which may cause significant variability when average MPR is reported. MPR tends to be relatively simple to calculate using basic spreadsheet software tools.
PDC Calculation
PDC calculations vary primarily in definition of a study time frame and methodology used to adjust for overlapping supply. As with MPR, the time frame may either be fixed or the time between the first and last fill. “Covered” denotes the availability of the prescribed daily dose and is tracked using an array of days supply for each fill, wherein an overlapping array start date is moved forward to start on the exhaustion date of the previous fill with any oversupply being truncated beyond the time frame (Figure 1). Each day in the denominator has a maximum of 1 days supply, which prevents PDC from exceeding 100%. Some methods further define “covered” to include only days when all medications in a multidrug regimen are available. Due to the complexity of calculating PDC compared with MPR, programming languages such as SAS (SAS Institute, Cary, NC)18,19 or R (R Foundation for Statistical Computing, Vienna, Austria)8 are often used.
Challenges with Standardization and Methodology
There are important considerations to address when attempting to standardize, measure, and report adherence measures. A summary of recommendations for reporting methods and standardization follows and is shown in Figure 2.
FIGURE 2.
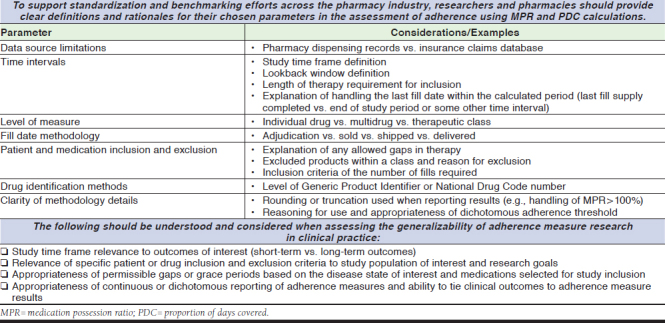
Recommendations for Adherence Measure Standardization and Research Methodology
Inclusion and Exclusion Criteria for Drugs and Patients
To calculate any adherence measure, medication and patient variables must be identified and defined with clear inclusion and exclusion criteria. Drug identification is often determined by National Drug Code numbers or Generic Product Identifiers, although the calculation may be performed at the individual drug level, multidrug level, or by therapeutic class. Certain medications may need to be excluded or uniquely accounted for during the calculation process due to their propensity to distort adherence results and should be clearly outlined if applicable. Examples include products with nonstandard dosing, complex schedules, finite treatment courses, and those with atypical insurance processing requirements.
Oncology regimens often involve complex dosing patterns and frequent changes in dose or regimen. Medications with a finite course, such as hepatitis C therapies, may be inaccurately labeled as nonadherent if a fixed study period extends beyond the length of the treatment course. For some specialty products, insurance companies may require a pharmacy to bill claims for ≤ 30-day supply due to strict utilization management criteria. In this instance, any medication that lasts > 30 days would become imprecise. For example, ustekinumab injections are typically administered as single injections every 8 or 12 weeks but may be required to be adjudicated as a 30-day supply due to processing restrictions.
Regarding patient descriptors, it is necessary to clearly define the study cohort with detailed inclusion or exclusion criteria. For example, patient inclusion criteria may include specific diagnosis codes, provider demographics, or a threshold number of prescription fills (e.g., 3 fills) during the time frame. The subject level at which the calculation is performed (patient, prescription number) should be clear. Appropriate reasons for patient exclusion may include clinically relevant lapses in therapy or a nonstandard medication administration interval. There may be a number of appropriate reasons for lapses between fills, such as a prescriber-directed hold of a medication, a hospitalization, or a temporary use of samples or alternative therapies; therefore, pharmacies should assess the need or use of what has been previously described as a “grace period”5,19 or “permissible gap.”4 These appropriate gaps in filling a medication may also emerge in the exclusion criteria if more granular patient information is available.5,20 This is unlikely to be included in the analysis of large datasets but may be included in adherence data from pharmacies with integrated data sources, such as those within health systems. If included, this should be clearly described in the study methodology.
Study Time Frame and Data Elements
Determining the study time period and the medication supply available at important time points, such as the start date, end date, and interval refill dates, can present a challenge for standardization. Typically, the adherence calculation index date is the first fill within the reporting period. If a patient is new to treatment and begins therapy in the middle of the study period, the index date is clear. However, it is also possible to have a “lookback window” to see if patients had days covered before their first fill of the reporting period. Including a lookback period might result in a more comprehensive view of adherence behavior but may skew results in some scenarios. For example, if a study is designed to evaluate the effect of a specific intervention, a lookback window might include erroneous adherence information before intervention.
Variation in data elements that can be used to define start and end dates within the pharmacy-dispensing process leads to discrepancies in how study time frames are determined. For example, most pharmacy-dispensing systems contain multiple discrete dates that may be used as a “fill” date, such as adjudication date, sold date, shipped date, or date of delivery. Considering that pharmacy-dispensing systems vary in how these dates are defined and tracked, a clear outline of definitions and methodology is vital to the comparison of adherence measures across publications. Patients may also be instructed to delay their start of treatment by days or weeks after the first dispense for clinically relevant reasons. For this reason, the true start date of a treatment may not be accurately reflected by the initial fill date in pharmacy claims data.
Finally, there are many factors that can affect the ability of a pharmacy to generate complete data for use in an adherence calculation. Since MPR and PDC are dependent on pharmacy claims information, an individual pharmacy might not have access to a complete set of data if a patient changes insurance or pharmacy during the study period. For example, if claims data are intermittent, it could mean the patient is either non-adherent or possibly switched pharmacies during the reporting period. This problem may be less prevalent in complete claims data from an insurance company; however, these datasets may yield inaccurate measurements if a patient changes insurance companies or uses a manufacturer-assistance program to obtain medication. Additional instances in which adherence calculations may inaccurately reflect patient behavior and may distort adherence results include medication discontinuations, appropriate holds in therapy, and death. Unless the pharmacy has the ability to account for these or similar occurrences, the accuracy of adherence measures will be limited.
Challenges with Interpreting and Using Adherence Measures
The reliability and applicability of adherence measures are dependent on the methods used and context of their calculation. When interpreting adherence results, it is vital to take into account the overall goal of the evaluation and intended use for the results.5 Pharmacies should assess whether the methods used to calculate adherence align with the intended population or medications being evaluated as will be described and as shown Figure 2.
The time frame for the study period contributes to the usability of the findings. If the goal of the study is to assess long-term adherence in a population taking a chronic medication, the study period must be long enough to show a true impact.5,16 The Pharmacy Quality Alliance and the National Quality Forum recommend PDC as the methodology to measure medication adherence for patients taking medications chronically. For MPR and PDC, a study period with < 3 fills is unlikely to show a true adherence behavior pattern.5,16,21
Considering the administration modality and dosing schedule of the medication being evaluated is also key to meaningful use of adherence data. The time frame of study required for a medication that is administered as needed (e.g., within 1 month of surgery or a rescue inhaler) should differ from a medication that should be taken chronically either for a finite period of time (such as hepatitis C virus therapy) or indefinitely (such as disease-modifying therapies for rheumatoid arthritis). Deciding on an appropriate time frame is study specific; therefore, the population, medication, and disease state should be taken into consideration.
How adherence data are analyzed and reported are also key to meaningful use of the findings. Results may be reported as a continuous result (e.g., mean, median, and interquartile range) or achievement of a dichotomous threshold for adherence (e.g., proportion of patients with MPR > 80%). The use of continuous measures often provides a more accurate picture of the overall population, whereas the results from dichotomous measures may summarize the best or worst among a population. If a dichotomous cutoff is used to measure adherence, the proposed threshold should be based on clinical rationale22; however, data explicitly tying adherence level cutoffs with clinically relevant outcomes is limited within specialty pharmacy practice. Because the practice of categorizing continuous data is widely discouraged,23 and data tying adherence measures to true outcomes are limited, the use of dichotomous thresholds for adherence measures should be discouraged and use of continuous data summary methods used in their place.
Conclusions
Until consistency exists in the calculation methodology of adherence measures, the effect of adherence on clinical outcomes cannot be reliably established and the use of adherence as a benchmark or quality indicator is limited in its utility. Although adherence metrics may serve as an internal benchmark to compare the progress of a program within an organization, caution is warranted for using them as an external benchmark to compare organizations. To make adherence metrics truly useful, organizations publishing statements on adherence metrics must provide detailed methodology for any calculation used.
In the absence of clear criteria for comparison, specialty pharmacies should consider using adherence calculations to identify and provide targeted interventions to patients with potential adherence problems. Furthermore, specialty pharmacies with access to electronic medical records should strive to better demonstrate ties between adherence measures and direct clinical outcomes and cost savings. To promote the development of correlations between adherence measures and true outcomes, the time has come to better integrate the field of adherence research with the full spectrum of scientific rigor. Achieving a unified framework on which adherence can be measured and discussed represents an industrywide challenge that requires buy-in from pharmacists, providers, database managers, and statisticians. There is simply too much at stake to delay these developments and too much information available to deny the need for them.
REFERENCES
- 1.Wilke T, Groth A, Mueller S, et al. How to use pharmacy claims data to measure patient nonadherence? The example of oral diabetics in therapy of type 2 diabetes mellitus. Eur J Health Econ. 2013;14(3):551-68. [DOI] [PubMed] [Google Scholar]
- 2.Pednekar PP, Ágh T, Malmenäs M, et al. Methods for measuring multiple medication adherence: a systematic review–report of the ISPOR Medication Adherence and Persistence Specialty Interest Group. Value Health. 2019;22(2):139-56. [DOI] [PubMed] [Google Scholar]
- 3.Blaschke TF, Osterberg L, Vrijens B, Urquhart J. Adherence to medications: insights arising from studies on the unreliable link between prescribed and actual drug dosing histories. Annu Rev Pharmacol Toxicol. 2012;52:275-301. [DOI] [PubMed] [Google Scholar]
- 4.Cramer JA, Roy A, Burrell A, et al. Medication compliance and persistence: terminology and definitions. Value Health. 2008;11(1):44-47. [DOI] [PubMed] [Google Scholar]
- 5.Andrade SE, Kahler KH, Frech F, Chan KA. Methods for evaluation of medication adherence and persistence using automated databases. Pharmacoepidemiol Drug Saf. 2006;15(8):565-74. [DOI] [PubMed] [Google Scholar]
- 6.Hess LM, Raebel MA, Conner DA, Malone DC. Measurement of adherence in pharmacy administrative databases: a proposal for standard definitions and preferred measures. Ann Pharmacother. 2006;40(7-8):1280-88. [DOI] [PubMed] [Google Scholar]
- 7.Arnet I, Kooij MJ, Messerli M, et al. Proposal of standardization to assess adherence with medication records: methodology matters. Ann Pharmacother. 2016;50(5):360-68 [DOI] [PubMed] [Google Scholar]
- 8.Dima AL, Dediu D. Computation of adherence to medication and visualization of medication histories in R with AdhereR: towards transparent and reproducible use of electronic healthcare data. PLoS One. 2017;12(4):e0174426. [DOI] [PMC free article] [PubMed] [Google Scholar]
- 9.Nau D. Proportion of days covered (PDC) as preferred method of measuring medication adherence. 2011. Available at: http://ep.yimg.com/ty/cdn/epill/pdc-mpr.pdf. Accessed August 13, 2019.
- 10.Lima VD, Harrigan R, Murray M, et al. Differential impact of adherence on long-term treatment response among naive HIV-infected individuals. AIDS. 2008;22(17):2371-80. [DOI] [PubMed] [Google Scholar]
- 11.Coronary Drug Project Research Group . Influence of adherence to treatment and response of cholesterol on mortality in the coronary drug project. N Engl J Med. 1980;303(18):1038-41. [DOI] [PubMed] [Google Scholar]
- 12.McDonnell PJ, Jacobs MR. Hospital admissions resulting from preventable adverse drug reactions. Ann Pharmacother. 2002;36(9):1331-36. [DOI] [PubMed] [Google Scholar]
- 13.Senst BL, Achusim LE, Genest RP, et al. Practical approach to determining costs and frequency of adverse drug events in a health care network. Am J Health Syst Pharm. 2001;58(12):1126-32. [DOI] [PubMed] [Google Scholar]
- 14.Cutler RL, Fernandez-Llimos F, Frommer M, Benrimoj C, Garcia-Cardenas V. Economic impact of medication non-adherence by disease groups: a systematic review. BMJ Open. 2018;8(1):e016982. [DOI] [PMC free article] [PubMed] [Google Scholar]
- 15.Gabay M. Direct and indirect remuneration fees: the controversy continues. Hosp Pharm. 2017;52(11):740-41. [DOI] [PMC free article] [PubMed] [Google Scholar]
- 16.Raebel MA, Schmittdiel J, Karter AJ, Konieczny JL, Steiner JF. Standardizing terminology and definitions of medication adherence and persistence in research employing electronicdatabases. Med Care. 2013;51(8 Suppl 3):S11-21. [DOI] [PMC free article] [PubMed] [Google Scholar]
- 17.Karve S, Cleves MA, Helm M, et al. An empirical basis for standardizing adherence measures derived from administrative claims data among diabetic patients. Med Care. 2008;46:1125-33. [DOI] [PubMed] [Google Scholar]
- 18.Leslie RS. Using arrays to calculate medication utilization. SAS Global Forum 2007. Paper 043-2007. Available at: https://support.sas.com/resources/papers/proceedings/proceedings/forum2007/043-2007.pdf. Accessed August 13, 2019.
- 19.Wang S, Huang Z, Taubenberg S. Measuring medication adherence with simple drug use and medication switching. SAS Global Forum 2013. Paper 168-2013. Available at: http://support.sas.com/resources/papers/proceed-ings13/168-2013.pdf. Accessed August 13, 2019.
- 20.Hutchins DS, Zeber JE, Roberts CS, Williams AF, Manias E, Peterson AM. Initial medication adherence-review and recommendations for good practices in outcomes research: an ISPOR Medication Adherence and Persistence Special Interest Group Report. Value Health. 2015;18(5):690-99. [DOI] [PubMed] [Google Scholar]
- 21.Dezii CM. Persistence with drug therapy: a practical approach using administrative claims data. Manag Care. 2001;10(2):42-45. [PubMed] [Google Scholar]
- 22.Steiner JF, Prochazka AV. The assessment of refill compliance using pharmacy records: methods, validity, and applications. J Clin Epidemiol. 1997;50(1):105-16. [DOI] [PubMed] [Google Scholar]
- 23.Harrell FE. Regression Modeling Strategies. 2nd ed. Secaucus, NJ: Springer-Verlag; 2015. [Google Scholar]