

Abstract
BACKGROUND:
Despite intensive pharmacotherapy, a considerable number of patients with severe asthma have inadequate disease control. Patients with severe asthma who experience exacerbations consume significant health care resources.
OBJECTIVE:
To assess health care resource utilization and associated costs among patients with persistent severe asthma who experienced exacerbations compared with patients with persistent but nonsevere asthma.
METHODS:
This retrospective analysis of a national administrative claims database identified patients aged ≥ 12 years who had at least 1 medical claim with an asthma diagnosis in 2012 and had continuous medical and pharmacy coverage under a commercial or Medicare Advantage plan from January 1, 2012, to December 31, 2013. Patients were assigned to 1 of 2 mutually exclusive cohorts–persistent asthma (PA) or severe asthma (SA)–according to an established algorithm based on asthma-related health care resource use and pharmacy claims for controller medication. SA patients were required to meet PA criteria and also have evidence of ≥2 asthma exacerbations in 2012. Asthma-related health care resource utilization and costs were computed from asthma medication use (rescue and controller therapy) and medical claims with an asthma diagnosis in the primary position in 2012 and 2013. Adherence to controller therapy was assessed over 365 days by using the proportion of days covered (PDC), starting with the first claim for controller therapy in 2012. Differences between the PA and SA cohorts were analyzed by t-test for continuous variables and chi-square test for categorical variables. Asthma-related costs in 2013 were also analyzed using a generalized linear model with a gamma distribution and log link, adjusted for patient demographics (age, gender, region, and insurance type) and Quan-Charlson comorbidity score.
RESULTS:
A total of 65,359 patients were included: 63,597 (97.3%) PA patients and 1,762 SA patients (2.7%). Compared with the PA cohort, the SA cohort was older (mean age = 50.8 years vs. 46.5 years, P < 0.001) and had higher mean comorbidity score (1.47 vs. 1.31, P< 0.001). The mean count of all asthma medications fills was 2.2-fold (2012) and 2.1-fold (2013) higher in the SA cohort, compared with the PA cohort (P< 0.001). Mean PDC for all oral and inhaled controller therapy was also higher in the SA cohort compared with the PA cohort (0.80 vs. 0.65, P< 0.001). SA patients had a significantly greater mean count of asthma-related hospitalizations, emergency room visits, and ambulatory visits in 2012 and 2013 (P< 0.001). Unadjusted mean annual asthma-related costs in the SA versus PA cohorts were $6,496 versus $2,739 (P < 0.001) in 2012 and $5,174 versus $1,775 (P< 0.001) in 2013. Higher asthma-related costs were driven by greater mean annual asthma medication costs in 2012 ($4,545 vs. $1,738, P< 0.001) and 2013 ($4,068 vs. $1,348, P< 0.001). Adjusted mean annual asthma-related costs in 2013 were $3,336 greater (cost ratio=2.878, P< 0.001) in the SA cohort, and adjusted mean annual asthma medication costs were $2,672 higher (cost ratio=2.982, P< 0.001) in the SA cohort.
CONCLUSIONS:
Patients with SA who experienced 2 or more exacerbations had 2.1-fold greater use of controller medications across both study years and were more adherent to controller therapy than patients with PA. Despite more intensive pharmacotherapy, SA patients incurred 2.9-fold higher adjusted asthma-related costs and 3-fold higher adjusted asthma medication costs than PA patients. Patients with SA consistently demonstrated a higher rate of health care utilization.
What is already known about this subject
Although less than 10% of asthma patients have severe disease, patients with severe asthma often experience inadequate disease control with available pharmacotherapy.
The most recent estimates of the burden of inadequately controlled severe asthma in a large managed care population are based on 2007 health care costs.
What this study adds
This study examined adherence to controller therapy and health care resource utilization and costs among patients with severe asthma who experienced 2 or more exacerbations compared with patients with persistent but nonsevere disease.
Compared with patients with persistent asthma, patients with severe asthma had uncontrolled disease manifested by frequent exacerbations despite greater use of asthma medications and better adherence to controller therapy.
In 2013, total adjusted asthma-related costs among patients with severe asthma were $5,112 per year or 2.9-fold higher than patients with persistent asthma. Adjusted asthma medication costs were $4,020 per year, which was triple the asthma medication costs of patients with persistent asthma.
Asthma is a common condition, affecting approximately 26 million Americans at an incremental annual cost of $56 billion annually.1,2 Asthma severity and morbidity are the major drivers of the clinical and economic burden of asthma. Although less than 10% of patients with asthma have severe disease,3,4 increasing asthma severity and morbidity are associated with impaired quality of life, work productivity loss, greater mortality risk, and sharply higher health care resource utilization and costs.5-11
The definition of severe asthma encompasses the intensity of pharmacotherapy required to control symptoms and the level of control achieved.6,12 Asthma medication costs are the largest component of asthma-related health care costs for patients with severe asthma, reflecting use of longterm controller therapy and short-term relief medications.13,14 Nevertheless, a considerable number of patients with severe asthma have a poor therapeutic response to available pharmacotherapy6,15; approximately 50% of patients with severe disease still experience exacerbations despite the use of intensive therapy.10,14 Patients with severe asthma who experience exacerbations incur approximately double the asthma-related costs of patients with controlled severe disease.14,16
The most recent estimates of the health care resource and cost burden of severe asthma in the United States are based on data collected in 2007 and earlier.5,11,13,14 These studies were also limited to patients aged 64 years and younger; elderly patients with asthma are less likely to achieve adequate control than their younger counterparts17 and are more than 3 times as likely to die because of asthma.2 Contemporary estimates of the burden of severe asthma are needed to inform development of new approaches for managing severe disease.
Using an established algorithm for identifying severe asthma in claims databases,5,14 the objective of this study was to determine all-cause and asthma-related health care resource utilization and associated costs for patients with severe asthma who experienced exacerbations in a large managed care setting. To capture the magnitude of the economic burden of inadequately controlled severe asthma, we compared the severe asthma cohort to patients with persistent but nonsevere disease and followed both cohorts for 2 years to assess whether costs differences between the 2 cohorts remained in the year following identification of exacerbations. We also explored a subgroup of severe asthma patients with a blood eosinophil count above a specified threshold who may be more likely to experience recurrent exacerbations.12
Methods
Design and Data Source
This was a retrospective observational study spanning 2 years, from January 1, 2012, through December 31, 2013. Data were captured from a large U.S. health care claims database that represents approximately 12.6 million individuals with medical and pharmacy benefit coverage. Medical claims included International Classification of Diseases, Ninth Revision, Clinical Modification (ICD-9-CM) diagnosis codes, ICD-9-CM procedure codes, Current Procedural Terminology, 4th edition, procedure codes, and Healthcare Common Procedure Coding System procedure codes (including J-codes for physician-administered drugs). Outpatient pharmacy claims provide National Drug Code numbers for dispensed medications, quantity dispensed, drug strength, and number of days of supply. Laboratory results were also available for a subset of the population. All data were de-identified and accessed using techniques compliant with the Health Insurance Portability and Accountability Act; therefore, a separate institutional review board approval was not sought.
Patient Identification and Asthma Cohort Assignment
This study used a calendar year approach for patient identification as well as outcomes. Patients were selected for inclusion in a stepwise manner. First, all patients were required to be aged 12 years or older (consistent with Global Initiative for Asthma [GINA] guidelines,18 which provide different pharmacotherapy recommendations for patients aged 11 years and younger); have ≥ 1 medical claim with an asthma diagnosis (ICD-9-CM code 493.xx) in any position; and have commercial insurance with medical and pharmacy benefits or Medicare Advantage with Medicare Part D prescription drug coverage during the first year of the study (January 1, 2012-December 31, 2012).
Second, patients were assigned to 2 mutually exclusive asthma cohorts according to their asthma-related health care resource utilization in 2012: persistent asthma (PA) or severe asthma (SA). Inclusion in the PA cohort was based on the HEDIS criteria for identifying PA using administrative claims19 and included 1 or more of the following during year 1: (a) ≥ 1 claim for an emergency room (ER) visit with asthma as primary diagnosis on the claim; (b) ≥ 1 claim for hospitalization with asthma as the primary diagnosis on the claim; (c) ≥ 4 outpatient claims with an asthma diagnosis in any position on the claim and at least 2 pharmacy claims for asthma controller medications (inhaled corticosteroids [ICS], ICS/long-acting beta2-agonist [LABA], leukotriene modifiers, and theophylline); and/or (d) ≥ 4 pharmacy claims for any asthma medications (Appendix A, available in online article).
The SA cohort required asthma medication use in year 1 consistent with GINA Step 4 treatment guidelines for longterm management of asthma18: ≥ 6 pharmacy claims for medium or high dose ICS (ICS in fixed-dose combination with LABA was included) and ≥ 3 pharmacy claims or ≥ 90 days supply of additional controller therapy. Additional controller therapy was defined as LABA, leukotriene modifiers, theophylline, or systemic (oral or injection) corticosteroids. LABA use required the controller component of combination therapies (e.g., ICS/LABA fixed-dose combination therapy). In order to identify patients with inadequately controlled asthma, inclusion in the SA cohort also required evidence of at least 2 exacerbations.12 Consistent with the American Thoracic Society/European Respiratory Society (ATS/ERS) definition of exacerbation,20 an asthma exacerbation was operationalized as any of the following service utilizations with an asthma diagnosis in the primary or secondary position: hospitalization, ER visit, or physician office or outpatient visit coupled with a pharmacy claim for oral corticosteroids (OCS) within 7 days before or after the visit.
Third, all patients in the PA and SA cohorts were required to be continuously enrolled in a commercial or Medicare Advantage plan with medical and pharmacy benefits during year 1 (2012) and year 2 (2013). In addition, patients could not have any medical claims for chronic obstructive pulmonary disease, any metastatic cancer, cystic fibrosis, eosinophillic esophagitis, or Churg-Strauss syndrome during either study year (Appendix A). We also examined a subset of SA patients with evidence of severe eosinophilic asthma (SEA). These patients met all the criteria for SA and were also required to have at least 1 laboratory result with a blood eosinophil count ≥ 300 cells per microliter (or ≥ 3%) captured at any time in 2012.4
Study Measures
Patient demographic characteristics and the Quan Charlson comorbidity score,21 a proxy for burden of comorbidity, were determined in year 1. The primary outcomes were health care resource utilization and costs computed as all-cause and asthma-related and stratified by study year. All-cause and asthma-related health care resource use was categorized by medical service type: hospitalization, ER visit, physician visit, outpatient visit and related services, home health service, urgent care visit, and other service. Asthma-related resource use encompassed medical claims with an asthma diagnosis in the primary position for the site of service (e.g., office visit, ER, and hospitalization). Total all-cause health care costs were computed as the sum of all health plan and patient paid amounts for all medical resource use and pharmacy claims. Total asthma-related costs were the sum of asthma medication costs plus asthma-related medical resource use. The cost of physician-administered asthma medications was considered to be part of asthma-related medication costs.
Asthma-related costs were also computed per unit of service and per exacerbation across both study years. Unit costs for asthma-related services were determined per hospitalization, per ER visit, and per ER visit coupled with a hospitalization, on an episode level. Exacerbation costs were computed as the sum of costs for all events that defined a severe exacerbation (i.e., asthma-related hospitalization, asthma-related ER visit, asthma-related physician/outpatient visit coupled with OCS claim within 7 days). Asthma medication use, stratified by study year, was determined by the mean count of each medication fill (Appendix B, available in online article). Adherence to controller medications was assessed by the proportion of days covered (PDC) calculated over 365 days (rolling index for the PDC analysis only) starting with the first pharmacy claim for a controller therapy in 2012. PDC was computed as the total days supply for each patient with a claim divided by 365 days.
Statistical Analyses
Descriptive statistics were computed for all measures. Differences between the PA and SA cohorts were assessed by t-test for continuous variables and chi-square test for categorical variables. Cohort differences in all-cause and asthma-related costs during year 2 were also analyzed using a generalized linear model with a gamma distribution and log link, adjusted for patient characteristics. The main independent variable was cohort (PA, SA), and adjustment variables were age, gender, geographic region, health plan type (commercial or Medicare Advantage), and Quan-Charslon comorbidity score. Separate models were constructed for total all-cause costs, all-cause pharmacy costs, total asthma-related costs, and asthma medication costs. Predicted costs for each cohort were calculated using recycled predictions. All analyses were conducted using the Statistical Analysis System (SAS version 9.2; SAS Institute, Cary, NC).
Results
Sample Selection and Patient Characteristics
The stepwise selection of the study sample and assignment to asthma cohort is shown in Figure 1. Of 552,895 patients with any asthma diagnosis in the database during 2012, 138,182 (25.0%) had persistent asthma, and 25,961 (4.7%) had severe asthma based on controller therapy dispensing only. Of these 25,961 patients, 5,170 (19.9%) had 2 or more asthma exacerbations (OCS/ER/hospitalization). After applying the criteria of continuous enrollment and no evidence of excluded diagnoses, 65,359 patients were identified as having PA or SA in 2012: 97.3% (n = 63,597) in the PA cohort and 2.7% (n = 1,762) in the SA cohort. Among the SA patients, 309 (17.5%) had a laboratory eosinophil count result; 170 of these 309 patients (55.0%) had an elevated blood eosinophil count (≥ 300 cells/microliter in 2012) and were assigned to the SEA cohort. Because of the small size of the SEA cohort, we report outcomes for the PA and SA cohorts only.
FIGURE 1.

Patient Selection and Cohort Assignment
Compared with the PA cohort, SA patients were older (50.8 years vs. 46.5 years), had higher mean comorbidity scores (1.47 vs. 1.31), and were more likely to have Medicare Advantage coverage (Table 1). SEA patients were generally similar to SA patients in mean age (51.3 years) and comorbidity score (1.52; Appendix C, available in online article). In the first year of the study, the majority of PA patients (53.3%) experienced no asthma exacerbations; 32.5% had 1 exacerbation; and 14.2% had 2 or more exacerbations (Table 1). Per inclusion criteria, all patients in the SA cohort had at least 2 exacerbations, and 42.5% had 3 or more.
TABLE 1.
Patient Demographic and Clinical Characteristics During Year 1 (2012)
| Characteristic | Persistent Asthma n = 63,597 | Severe Asthma n = 1,762 | P Valuea |
|---|---|---|---|
| Age in years, mean [SD] | 46.5 [19.0] | 50.8 [16.6] | < 0.001 |
| Age, n (%) | |||
| 12-17 | 7,207 (11.3) | 86 (4.9) | < 0.001 |
| 18-64 | 45,044 (70.8) | 1,320 (74.9) | < 0.001 |
| ≥ 65 | 11,346 (17.8) | 356 (20.2) | 0.011 |
| Male gender, n (%) | 23,408 (36.8) | 604 (34.3) | 0.030 |
| Charlson comorbidity score, mean [SD] | 1.31 [0.85] | 1.47 [1.04] | < 0.001 |
| Charlson comorbidity score, n (%) | |||
| 0 | 65 (0.1) | 0 | |
| 1-2 | 56,838 (89.4) | 1,487 (84.4) | < 0.001 |
| 3-4 | 5,660 (8.9) | 230 (13.1) | < 0.001 |
| ≥ 5 | 1,034 (1.6) | 45 (2.6) | 0.003 |
| Severe asthma exacerbation, n (%)b | |||
| 0 | 33,889 (53.3) | 0c | < 0.001 |
| 1 | 20,656 (32.5) | 0c | < 0.001 |
| 2 | 5,574 (8.8) | 1,013 (57.5) | < 0.001 |
| ≥ 3 | 3,478 (5.5) | 749 (42.5) | < 0.001 |
| U.S. Census region, n (%) | |||
| Northeast | 8,949 (14.1) | 248 (14.1) | 0.498 |
| South | 25,898 (40.7) | 702 (39.8) | < 0.001 |
| Midwest | 18,559 (29.2) | 548 (31.1) | < 0.001 |
| West | 10,184 (16.0) | 264 (15.0) | 0.024 |
| Other | 7 (0.01) | 0 | 0.891 |
| Health insurance plan type, n (%) | |||
| Commercial | 52,090 (81.9) | 1,363 (77.4) | < 0.001 |
| Medicare Advantage | 11,057 (18.1) | 399 (22.6) | < 0.001 |
a T-test for continuous variables and chi-square test for categorical variables.
b Asthma exacerbation defined as any asthma-related hospitalization, asthma-related ER visit, or asthma-related physician/outpatient visit coupled with OCS claim within 7 days.
c Inclusion in the severe asthma cohort required at least 2 asthma exacerbations in year 1.
ER = emergency room; OCS = oral corticosteroid; SD = standard deviation.
Asthma Medication Use
The SA cohort had greater utilization of every controller and rescue medication than the PA cohort in both study years (P < 0.001; Table 2). Across both years, the mean count of all asthma medications was 2.1-fold higher in the SA cohort versus PA cohort. Leukotriene modifiers were the most commonly used controller in the PA cohort–of note, SA patients had 40% greater utilization. The use of any rescue medication was 2.4-fold higher in the SA cohort. The PDC for all oral and inhaled controller medications was also higher in the SA cohort than in the PA cohort (0.80 vs. 0.65), and 58.3% of SA patients versus 38.8% of PA patients were considered adherent based on PDC ≥ 0.80.
TABLE 2.
Asthma Medication Use
| Asthma Medications | Year 1 (2012) | Year 2 (2013) | ||||
|---|---|---|---|---|---|---|
| Persistent Asthma n = 63,597 | Severe Asthma n = 1,762 | P Valuea | Persistent Asthma n = 63,597 | Severe Asthma n = 1,762 | P Valuea | |
| Controller medications, count, mean [SD] | ||||||
| Inhaled corticosteroids | 1.21 [2.46] | 2.04 [3.47] | < 0.001 | 1.01 [2.37] | 1.64 [3.28] | < 0.001 |
| Inhaled corticosteroids and long-acting beta-agonists | 2.35 [3.18] | 6.79 [3.67] | < 0.001 | 2.09 [3.15] | 5.71 [4.07] | < 0.001 |
| Long-acting beta-agonists | 0.06 [0.65] | 0.16 [1.09] | < 0.001 | 0.05 [0.65] | 0.15 [1.12] | < 0.001 |
| Leukotriene modifiers | 3.14 [3.99] | 4.23 [4.65] | < 0.001 | 2.85 [4.02] | 4.13 [4.74] | < 0.001 |
| Theophylline | 0.11 [0.98] | 0.25 [1.55] | < 0.001 | 0.10 [0.94] | 0.24 [1.51] | < 0.001 |
| Omalizumab | 0.07 [0.94] | 0.55 [2.75] | < 0.001 | 0.08 [1.05] | 0.59 [2.93] | < 0.001 |
| Rescue medication, count, mean [SD] | ||||||
| Oral corticosteroids | 1.23 [1.93] | 4.08 [2.97] | < 0.001 | 1.05 [1.89] | 2.81 [3.34] | < 0.001 |
| Short-acting beta-agonists | 2.18 [3.00] | 4.40 [4.56] | < 0.001 | 1.90 [3.01] | 3.69 [4.39] | < 0.001 |
| Total medication count, mean [SD] | 10.35 [6.44] | 22.51 [9.51] | < 0.001 | 9.13 [7.24] | 18.97 [10.92] | < 0.001 |
| PDC: inhaled and oral controller medicationsb | ||||||
| Number | 57,962 | 1,762 | ||||
| Mean [SD] | 0.65 [0.26] | 0.80 [0.17] | < 0.001 | |||
| PDC ≥ 0.80, n (%) | 22,508 (38.8) | 1,028 (58.3) | < 0.001 | |||
| PDC: omalizumabb | ||||||
| Number | 536 | 93 | ||||
| Mean [SD] | 0.67 [0.26] | 0.72 [0.25] | 0.106 | |||
| PDC ≥ 0.80, n (%) | 234 (43.7) | 44 (47.3) | 0.512 | |||
a T-test for continuous variables and chi-square test for categorical variables.
b PDC measured over 365 days starting with the date of the first claim for a controller medication in 2012. This is a rolling index date with earliest being January 1, 2012, and latest being December 31, 2012.
PDC = proportion of days covered; SD = standard deviation.
Health Care Resource Utilization
Medical service use by service category for all-cause and asthma-related services is shown in Appendix D (available in online article). The mean count of all-cause and asthma-related service use was greater in the SA cohort compared with the PA cohort for every service category in both years (P ≤ 0.02) except asthma-related urgent care visits. Across both years, SA patients had more than twice as many hospitalizations, outpatient visits, and office visits that were asthma-related. SA patients also had 41% greater utilization of asthma-related ER visits than PA patients.
Health Care Costs
Unadjusted all-cause costs and asthma-related costs are shown in Figures 2 and 3, respectively. The SA cohort had significantly higher all-cause total, medical, and pharmacy costs than the PA cohort in both years with a total cost difference of $11,494 in year 1 and $9,466 in year 2 (P < 0.001). In year 1, total asthma-related costs in the SA cohort were $6,496 and 2.4-fold higher ($3,758) than the PA cohort. In year 2, the difference was 2.9-fold higher for SA patients than PA patients. Asthma medication costs were the primary driver of total asthma-related costs in both cohorts and were higher in the SA cohort by $2,808 in year 1 and $2,720 in year 2.
FIGURE 2.
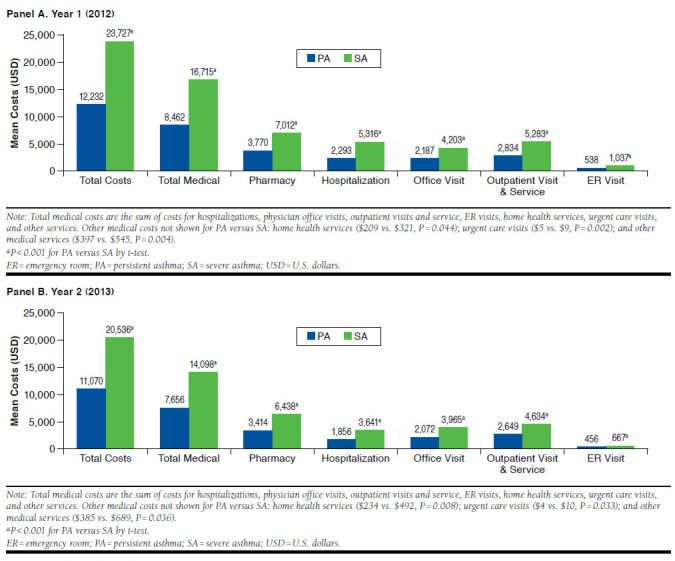
Unadjusted All-Cause Health Care Costs
FIGURE 3.
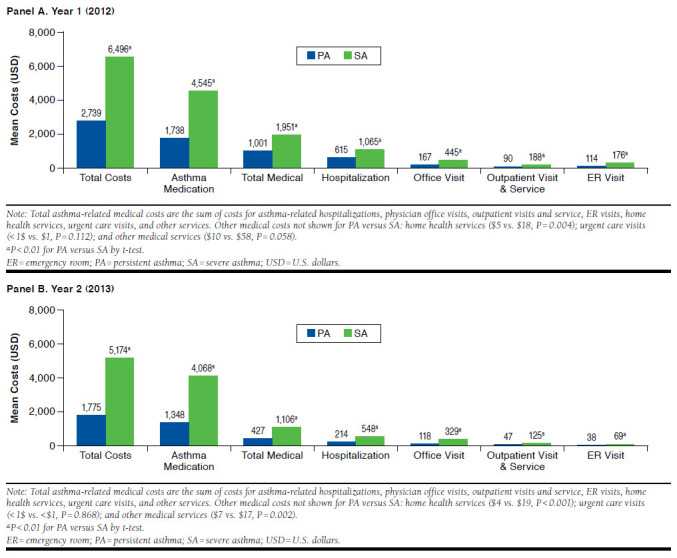
Unadjusted Asthma-Related Health Care Costs
The results of the multivariable analysis for all-cause and asthma-related costs in year 2 are shown in Table 3. Compared with the PA cohort, adjusted all-cause total costs among SA patients were higher by 77.9% (cost difference = $8,758; cost ratio = 1.779; 95% confidence interval [CI] = 1.623-1.950), and total asthma-related costs were $5,112 higher (cost difference = $3,336; cost ratio = 2.878; 95% CI = 2.504-3.308). The adjusted costs of asthma-related medications were $4,020 higher in the SA cohort (cost ratio = 2.982; 95% CI = 2.6603.342) and the between cohort cost difference was $2,672. Older age, higher comorbidity score, and male gender were modest but significant patient characteristics predictive of greater total asthma-related costs (1%-7% higher).
TABLE 3.
Generalized Linear Model Analysis of All-Cause and Asthma-Related Health Care Costs in Year 2 (2013)
| Independent Variables | Total Costs | Pharmacy Costs | ||||||
|---|---|---|---|---|---|---|---|---|
| All-Causea | Asthma-Relatedb | All-Causec | Asthma-Relatedd | |||||
| Cost Ratio | 95% CI | Cost Ratio | 95% CI | Cost Ratio | 95% CI | Cost Ratio | 95% CI | |
| SA cohort (ref: PA cohort) | 1.779e | 1.623-1.950 | 2.878e | 2.504-3.308 | 1.838e | 1.690-1.998 | 2.982e | 2.660-3.342 |
| Age (continuous) | 1.011e | 1.010-1.012 | 1.009e | 1.008-1.011 | 1.014e | 1.013-1.015 | 1.014e | 1.013-1.015 |
| Medicare Advantage insurance (ref: commercial) | 0.684e | 0.655-0.715 | 0.754e | 0.704-0.808 | 0.934e | 0.897-0.971 | 0.721e | 0.681-0.763 |
| Male gender (ref: female) | 0.793e | 0.769-0.818 | 1.061f | 1.012-1.113 | 0.916e | 0.890-0.942 | 1.133e | 1.090-1.178 |
| Geographic region (ref: South) | ||||||||
| Northeast | 1.041 | 0.994-1.090 | 1.105f | 1.030-1.186 | 0.957f | 0.917-0.998 | 1.060f | 1.001-1.122 |
| Midwest | 1.026 | 0.990-1.064 | 1.120f | 1.060-1.183 | 0.982 | 0.951-1.015 | 1.104e | 1.055-1.154 |
| West | 1.090e | 1.043-1.139 | 1.259e | 1.178-1.346 | 0.987 | 0.948-1.027 | 1.183e | 1.120-1.249 |
| Baseline Quan-Charlson score (continuous) | 1.403e | 1.377-1.430 | 1.066e | 1.038-1.094 | 1.316e | 1.293-1.338 | 0.984 | 0.962-1.007 |
a Predicted total all-cause total costs were $20,002 for SA and $11,244 for PA. Observations used = 65,352. Seven patients with PA were excluded because they had region recorded as other. Pearson chi-square = 244928.192, df = 65,343; Park test: estimate = 1.765, gamma distribution P = 0.299.
b Predicted total asthma-related costs were $5,112 for SA and $1,776 for PA. Observations used = 65,352. Seven patients with PA were excluded because they had region recorded as other. Pearson chi-square = 564711.551, df = 65,343; Park test: estimate = 2.618, gamma distribution P = 0.282.
c Predicted all-cause pharmacy costs were $6,385 for SA and $3,475 for PA. Observations used = 65,352. Seven patients with PA were excluded because they had region recorded as other. Pearson chi-square = 203765.748, df = 65,343; Park test: estimate = 1.353, gamma distribution P = <0.001.
d Predicted asthma-related pharmacy costs were $4,020 for SA and $1,348 for PA. Observations used = 65,352. Seven patients with PA were excluded because they had region recorded as other. Pearson chi-square = 378721.822, df = 65,343; Park test: estimate = 1.992, gamma distribution P = 0.990.
e P < 0.001.
f P < 0.05.
CI = confidence interval; PA = persistent asthma; ref = reference; SA = severe asthma.
Episode-Level Asthma-Related Costs. Costs per asthma-related unit of service for the SA and PA cohorts, respectively, were hospitalization, $14,479, $16,336; ER visit, $795, $692; and hospitalization and ER visit, $4,429, $3,602 (Appendix E, available in online article). The cost of an exacerbation– defined as the sum of any hospitalization, ER visit, and ambulatory visit (coupled with OCS within 7 days)–was $2,333 in the SA cohort and $3,088 in the PA cohort. The lower costs in the SA cohort reflect greater use of less costly services (i.e., ambulatory visits rather than ER visit or hospitalization) for exacerbations in the SA cohort compared with the PA cohort. The cost of an exacerbation that included an ambulatory visit plus OCS within 7 days was $637 and $679, respectively, in SA and PA cohorts.
Discussion
The results of this study demonstrated the magnitude of the direct cost burden of severe asthma. The SA cohort had consistently higher all-cause and asthma-related health care resource utilization and health care costs than the PA cohort in both study years. In the second year, total annual asthma-related costs, adjusted for patient characteristics, were 2.9-fold higher, with a cost difference of $5,112 in the SA cohort. As expected, asthma-related costs were driven by asthma medication costs in both cohorts, but medication costs were 3-fold higher among SA patients.
These results demonstrate the increase in the economic burden of severe asthma in the United State since studies conducted in 2007 and earlier.5,13,14 In the most recent study by Ivanova et al. (2012),14 which used a comparable claims-based definition for severe asthma and exacerbation, adjusted annual asthma-related costs for severe asthma patients experiencing exacerbations were $2,398 (in 2007 dollars) or approximately half of the adjusted asthma-related cost we observed in 2013. A methodological difference between the 2 studies most likely contributed to the higher costs we observed. We required at least 2 exacerbations in the year before adjusted cost measurement (vs. at least 1 exacerbation in the earlier study14). Further, according to the medical care component of the Consumer Price Index, inflation from 2007 to 2013 would account for approximately 21% higher health care costs.22 Exacerbations are a significant contributor to asthma-related costs,23 and cost of exacerbations has increased sharply in recent years. The mean cost of a severe exacerbation requiring hospitalization was $14,479 in our study (n = 196) or double the cost ($7,238) reported by Lane et al. (2013) in 2009 dollars (n = 18).24 The higher costs we observed for hospitalization likely reflect inflation since 2009 (approximately 13%), but there may have also been underlying differences in exacerbation management practices and patient clinical characteristics that contributed to the difference in exacerbation-related hospitalization costs between the 2 studies.
Adjusted asthma medication costs represented 79% of adjusted annual asthma-related costs in the SA cohort and were 300% greater than for the PA cohort. Higher medication costs were a function not only of more prescription fills (per inclusion criteria) but also better adherence to refill schedules for long-term controller therapy in the SA cohort (mean PDC = 0.80) versus the PA cohort (mean PDC = 0.65): 58.3% of SA patients were considered adherent to long-term controller therapy compared with 38.8% of PA patients. Adherence is a significant challenge in patients with asthma and is essential to reduce the risk of exacerbation.18,25 Despite greater counts of all asthma-related medications and better adherence to controller therapy, the SA cohort had more than twice the number of asthma-related hospitalizations and 41% more ER visits for asthma than PA patients over the course of the study.
Overall, 2.7% of patients in this study met the definition of severe asthma based on intensity of asthma therapy and also experienced at least 2 exacerbations in the first year of the study. The criteria used to define severe asthma have evolved over the past 20 years, and as a likely result, the proportion of persistent asthma patients classified as severe, by patient symptom report, lung function, or treatment intensity, ranges from 8%-33% patients.5,9,11,13 Our results fall outside the lower range previously reported, most likely because we required at least 2 exacerbations in order to focus on severe asthma that was inadequately controlled, whereas the previous studies did not require evidence of exacerbations. Our definition is also consistent with ATS/ERS criteria for severe, uncontrolled asthma.12 History of recurrent exacerbation is an important marker of uncontrolled disease. In studies that examined exacerbations using the same definition (i.e., requirement for a medical encounter) that we used, approximately 50% of patients with severe asthma experienced exacerbations,10,14 indicating that inadequate control is widespread in severe asthma. Among patients classified as severe asthma with 2 or more exacerbations in the first study year, 9.6% were classified as severe eosinophilic asthma based on blood eosinophil count,4 a subgroup of patients with asthma for which there are no effective treatments at this time.
Our results provide an estimate of the economic burden of inadequately controlled severe asthma. Intensive pharmacotherapy is required to manage symptoms; yet, a significant proportion of patients have inadequate control with current treatment regimens. While physician adherence to treatment guidelines, patient education, and adherence to prescribed regimens remain central issues in achieving control,18,25,26 severe asthma is a heterogeneous condition with variable response to existing therapies.27,28 Additional research is needed to characterize the distinct phenotypes of severe asthma and develop treatments targeted at the underlying pathophysiology.28
Limitations
This study has inherent limitations that accompany observational studies that use administrative claims. Claims data lack clinically important information, such as lung function and symptom severity, to classify asthma severity. The number of SA patients with a blood eosinophil count in our data source was small. While blood eosinophil count is recognized as a biomarker for severe eosinophilic asthma, it does not constitute a definitive diagnosis.29 However, we used an established algorithm for identification of persistent and severe asthma in claims databases,5,14,19 and the health care costs of patients with a severity classification based on claims have been shown to be substantially similar to patients whose severity classification was defined by pulmonary function test.13
Cohorts differed in baseline characteristics in year 1. Therefore, adjusted analyses controlled for demographic characteristics and comorbidity score to reduce confounding. As a result, adjusted outcomes were consistent with unadjusted outcomes. However, there may have been other unmeasured characteristics that contributed to cost differences between the SA and PA cohorts. While adherence was assessed by PDC computed from prescription fills, whether patients actually consumed the medication as prescribed or used correct inhaler technique is unknown. Misuse of inhaler therapy is common and contributes to worse clinical outcomes.26
Physician adherence to asthma management guidelines is also unknown, but our results do reflect real-world practice among a national sample of PA and SA patients. We did not exclude some uncommon conditions (e.g., farmer’s lung, bagassosis, and bird fancier’s lung) from the patient sample that may also be treated with ICS; however, we would not expect systematic differences in the rate of these conditions between the study cohorts. Finally, the results are primarily applicable to a managed population with commercial or Medicare Advantage insurance and may not be generalizable to patients with other forms of insurance or to the uninsured.
Conclusions
Patients with severe asthma receiving controller therapy and with 2 or more exacerbations incurred a significantly higher disease burden with nearly triple the asthma-related health care costs of patients with persistent but nonsevere disease. Higher asthma-related health care costs were driven by 3-fold higher asthma medication costs, reflecting more prescription fills for all asthma medications and better adherence to controller therapy. Compared with the nonsevere asthma cohort, patients with severe disease had more than twice as many asthma-related hospitalizations, which represented the second largest category of asthma-related costs after medication costs.
ACKNOWLEDGMENTS
Editorial support in the form of development of the initial draft, collating author comments, editorial suggestions to draft versions of this paper, assembling tables and figures, copyediting, and referencing was provided by Sarah Peirce-Sandner, MS, of Optum, with funding from GSK.
APPENDIX A. Excluded Conditions
| Condition | ICD-9-CM Codes |
|---|---|
| Chronic obstructive pulmonary disease | 491.xx, 492x, 496 |
| Metastasis cancers | 196.x-197.x, 198.0-198.7, 198.8x, 199.0, 209.7x |
| Cystic fibrosis | 277.0x |
| Eosinophilic esophagitis | 530.13 |
| Churg Strauss syndrome (allergic angitis, vasculitis) | 446.4 |
ICD-9-CM = International Classification of Diseases, Ninth Revision, Clinical Modification.
APPENDIX B. Asthma Medications
| Major Class | Subclass | Medications |
|---|---|---|
| Controller medications | Inhaled corticosteroids | Beclomethasone |
| Budesonide (inhaler & nebulizer) | ||
| Ciclesonide | ||
| Dexamethasone | ||
| Flunisolide | ||
| Fluticasone | ||
| Mometasone | ||
| Triamcinolone | ||
| Inhaled corticosteroids/long-acting beta-agonists combination | Fluticasone/salmeterol | |
| Fluticasone/vilanterol | ||
| Budesonide/formoterol | ||
| Mometasone/formoterol | ||
| Leukotriene modifiers | Montelukast | |
| Zafirlukast | ||
| Zileuton | ||
| Theophylline | Theophylline | |
| Long-acting beta-agonists | Arformoterol | |
| Formoterol | ||
| Indacaterol | ||
| Salmeterol | ||
| Omalizumab | Omalizumab | |
| Rescue medications | Systemic corticosteroids/oral corticosteroids | Betamethasone |
| Corticotropin | ||
| Cortisone | ||
| Cosyntropin | ||
| Dexamethasone | ||
| Fludrocortisone | ||
| Hydrocortisone | ||
| Methylprednisolone | ||
| Prednisolone | ||
| Prednisone | ||
| Triamcinolone | ||
| Short-acting beta-agonists | Albuterol | |
| Bitolterol | ||
| Epinephrine | ||
| Isoetharine | ||
| Isoproterenol | ||
| Levalbuterol | ||
| Metaproterenol | ||
| Pirbuterol | ||
| Terbutaline |
APPENDIX C. Patient Demographic and Clinical Characteristics During Year 1
| Characteristic | Persistent Asthma n = 63,597 | Severe Asthma n = 1,762 | Severe Eosinophilic Asthma n = 170 | P Valuea Persistent vs. Severe | P Valuea Persistent vs. Severe Eosinophilic |
|---|---|---|---|---|---|
| Age in years, mean [SD] | 46.5 [19.0] | 50.8 [16.6] | 51.3 [14.5] | < 0.001 | < 0.001 |
| Age, n (%) | |||||
| 12-17 | 7,207 (11.3) | 86 (4.9) | 8 (4.7) | < 0.001 | 0.006 |
| 18-64 | 45,044 (70.8) | 1,320 (74.9) | 140 (82.4) | < 0.001 | <0.001 |
| ≥ 65 | 11,346 (17.8) | 356 (20.2) | 22 (12.9) | 0.011 | 0.096 |
| Male gender, n (%) | 23,408 (36.8) | 604 (34.3) | 66 (38.2) | 0.030 | 0.586 |
| Charlson comorbidity score, mean [SD] | 1.31 [0.85] | 1.47 [1.04] | 1.52 [1.09] | < 0.001 | 0.012 |
| Charlson comorbidity score, n (%) | |||||
| 0 | 65 (0.1) | 0 | 0 | 0.179 | 0.677 |
| 1-2 | 56,838 (89.4) | 1,487 (84.4) | 142 (83.5) | < 0.001 | 0.014 |
| 3-4 | 5,660 (8.9) | 230 (13.1) | 26 (15.3) | < 0.001 | 0.003 |
| ≥ 5 | 1,034 (1.6) | 45 (2.6) | 2 (1.2) | 0.003 | 0.643 |
| U.S. Census region, n (%) | |||||
| Northeast | 8,949 (14.1) | 248 (14.1) | 27 (15.9) | 0.997 | 0.498 |
| South | 25,898 (40.7) | 702 (39.8) | 95 (55.9) | 0.458 | <0.001 |
| Midwest | 18,559 (29.2) | 548 (31.1) | 10 (5.9) | 0.081 | <0.001 |
| West | 10,184 (16.0) | 264 (15.0) | 38 (22.4) | 0.244 | 0.024 |
| Other | 7 (0.01) | 0 | 0 | 0.660 | 0.891 |
| Health insurance plan type, n (%) | |||||
| Commercial | 52,090 (81.9) | 1,363 (77.4) | 141 (82.9) | < 0.001 | 0.726 |
| Medicare Advantage | 11,057 (18.1) | 399 (22.6) | 29 (17.1) | < 0.001 | 0.726 |
a T-test for continuous variables and chi-square test for categorical variables.
SD = standard deviation.
APPENDIX D. All-Cause and Asthma-Related Health Care Resource Utilization
| Year 1 | ||||||
|---|---|---|---|---|---|---|
| Persistent Asthma n = 63,597 | Severe Asthma n = 1,762 | P Value (Mean)a | P Value (%)a | |||
| Mean [SD]b | % Patientsc | Mean [SD]b | % Patientsc | |||
| All-cause resource use | ||||||
| Inpatient stay, count | 0.13 [0.54] | 10.4 | 0.32 [0.74] | 22.5 | < 0.001 | < 0.001 |
| Length of inpatient stay, daysd | 8.8 [18.2] | 8.7 [12.4] | 0.850 | |||
| ER visit, count | 1.29 [3.90] | 39.0 | 2.02 [4.59] | 55.1 | < 0.001 | < 0.001 |
| Office visit, count | 14.58 [14.77] | 98.7 | 22.71 [19.72] | 99.6 | < 0.001 | 0.001 |
| Outpatient visit. count | 4.55 [7.15] | 66.4 | 7.90 [11.28] | 80.1 | < 0.001 | < 0.001 |
| Home health service visit, count | 0.83 [8.04] | 10.5 | 2.06 [13.38] | 19.1 | < 0.001 | < 0.001 |
| Urgent care visit, count | 0.04 [0.33] | 2.1 | 0.07 [0.49] | 3.8 | 0.002 | < 0.001 |
| Asthma-related resource use | ||||||
| Inpatient stay, count | 0.04 [0.21] | 3.6 | 0.08 [0.35] | 6.5 | < 0.001 | < 0.001 |
| Length of inpatient stay, dayse | 8.5 [21.8] | 6.8 [7.2] | 0.037 | |||
| ER visit, count | 0.16 [0.63] | 13.2 | 0.22 [0.73] | 14.2 | 0.001 | 0.248 |
| Office visit, count | 1.36 [2.84] | 58.0 | 3.73 [5.80] | 82.2 | < 0.001 | < 0.001 |
| Outpatient visit, count | 0.28 [0.94] | 15.0 | 0.63 [2.08] | 21.3 | < 0.001 | < 0.001 |
| Home health service visit, count | 0.08 [0.99] | 1.7 | 0.29 [2.63] | 4.8 | < 0.001 | < 0.001 |
| Urgent care visit, count | 0.00 [0.07] | 0.2 | 0.00 [0.07] | 0.6 | 0.080 | 0.006 |
| Year 2 | ||||||
|---|---|---|---|---|---|---|
| Persistent Asthma n = 63,597 | Severe Asthma n = 1,762 | P Value (Mean)a | P Value (%)a | |||
| Mean [SD]b | % of Patientsc | Mean [SD]b | % Patientsc | |||
| All-cause resource use | ||||||
| Inpatient stay, count | 0.10 [0.41] | 7.7 | 0.18 [0.57] | 12.8 | < 0.001 | < 0.001 |
| Length of inpatient stay, daysd | 8.7 [16.1] | 9.0 [13.4] | 0.711 | |||
| ER visit, count | 1.14 [3.76] | 31.4 | 1.52 [4.62] | 38.4 | < 0.001 | < 0.001 |
| Office visit, count | 13.88 [15.05] | 97.1 | 20.37 [18.49] | 98.8 | < 0.001 | < 0.001 |
| Outpatient visit. count | 4.17 [7.25] | 60.4 | 6.66 [10.13] | 70.2 | < 0.001 | < 0.001 |
| Home health service visit, count | 0.85 [7.71] | 10.3 | 2.06 [11.61] | 17.7 | < 0.001 | < 0.001 |
| Urgent care visit, count | 0.03 [0.31] | 1.9 | 0.05 [0.37] | 3.2 | 0.016 | < 0.001 |
| Asthma-related resource use | ||||||
| Inpatient stay, count | 0.01 [0.13] | 1.1 | 0.03 [0.23] | 2.6 | < 0.001 | < 0.001 |
| Length of inpatient stay, dayse | 8.9 [17.71] | 9.4 [13.3] | 0.801 | |||
| ER visit, count | 0.06 [0.49] | 3.5 | 0.09 [0.37] | 6.4 | < 0.001 | < 0.001 |
| Office visit, count | 1.02 [2.70] | 43.2 | 2.90 [5.74] | 66.5 | < 0.001 | < 0.001 |
| Outpatient visit, count | 0.15 [0.8] | 6.6 | 0.42 [1.66] | 14.3 | < 0.001 | < 0.001 |
| Home health service visit, count | 0.08 [0.92] | 1.4 | 0.32 [2.09] | 4.8 | < 0.001 | < 0.001 |
| Urgent care visit, count | 0.00 [0.07] | 0.2 | 0.00 [0.06] | 0.2 | 0.881 | 0.788 |
a T-test for continuous variables and chi-square test for categorical variables.
b Mean per patient count of uses among entire cohort.
c Percentage of patients within each cohort who used the service.
d Represents length of IP stay only for patients with an inpatient stay. In year 1, 6,629 patients were in the persistent asthma cohort, and 396 patients were in the severe asthma cohort; in year 2, 4,922 patients were in the persistent asthma cohort, and 226 patents were in the severe asthma cohort.
e Represents length of IP stay only for patients with an inpatient stay. In year 1, 2,282 patients were in the persistent asthma cohort, and 114 patients were in the severe asthma cohort; in year 2, 678 patients in the persistent asthma cohort, and 46 patents were in the severe asthma cohort.
ER = emergency room; SD = standard deviation.
APPENDIX E. Episode-Level Costs for Asthma-Related Health Care Cost over 24-Month Period (Years 1-2)
| Persistent Asthma | Severe Asthma | P Valuea Persistent vs. Severe | Severe Eosinophilic Asthma | ||||
|---|---|---|---|---|---|---|---|
| Count, n | Mean [SD] | Count, n | Mean [SD] | Count, n | Mean [SD] | ||
| Asthma-related unit cost, $ | |||||||
| ER visit | 13,928 | 692 [688] | 542 | 795 [1,511] | 0.116 | 43 | 750 [605] |
| Hospitalization (any length) | 3,183 | 16,336 [36,127] | 196 | 14,479 [17,672] | 0.190 | 21 | 15,563 [20,787] |
| ER visit + hospitalization (any length) | 17,111 | 3,602 [16,738] | 738 | 4,429 [10,994] | 0.052 | 64 | 5,610 [13,659] |
| Exacerbation unit cost, $ | |||||||
| AMB visit coupled with OCSb | 43,736 | 679 [4,379] | 5,698 | 637 [2,950] | 0.312 | 629 | 772 [3,954] |
| Any type: ER, hospitalization, and ambulatory visits coupled with OCSb | 77,222 | 3,088 [12,449] | 7,610 | 2,333 [8,570] | <0.001 | 798 | 2,820 [11,265] |
a T-test.
b OCS prescription filled within 7 days before or after the ambulatory visit.
ABM = ambulatory; ER = emergency room; OCS = oral corticosteroid; SD = standard deviation.
References
- 1.Barnett SB, Nurmagambetov TA.. Costs of asthma in the United States: 2002-2007. J Allergy Clin Immunol. 2011;127(1):145-52. [DOI] [PubMed] [Google Scholar]
- 2.Akinbami LJ, Moorman JE, Bailey C, et al. Trends in asthma prevalence, health care use, and mortality in the United States, 2001-2010. NCHS Data Brief, no. 94. Hyattsville MD: National Center for Health Statisitics. 2012. Available at: http://www.cdc.gov/nchs/data/databriefs/db94.pdf. Accessed May 4, 2016. [PubMed]
- 3.Moore WC, Bleecker ER, Curran-Everett D, et al. Characterization of the severe asthma phenotype by the National Heart, Lung, and Blood Institute’s Severe Asthma Research Program. J Allergy Clin Immunol. 2007;119(2):405-13. [DOI] [PMC free article] [PubMed] [Google Scholar]
- 4.Ortega HG, Liu MC, Pavord ID, et al. Mepolizumab treatment in patients with severe eosinophilic asthma. N Engl J Med. 2014;371(13):1198-207. [DOI] [PubMed] [Google Scholar]
- 5.Colice G, Wu EQ, Birnbaum H, Daher M, Marynchenko MB, Varghese S.. Healthcare and workloss costs associated with patients with persistent asthma in a privately insured population. J Occup Environ Med. 2006;48(8):794-802. [DOI] [PubMed] [Google Scholar]
- 6.Custovic A, Johnston SL, Pavord I, et al. EAACI position statement on asthma exacerbations and severe asthma. Allergy. 2013;68(12):1520-31. [DOI] [PMC free article] [PubMed] [Google Scholar]
- 7.Godard P, Chanez P, Siraudin L, Nicoloyannis N, Duru G.. Costs of asthma are correlated with severity: a 1-yr prospective study. Eur Respir J. 2002;19(1):61-67. [DOI] [PubMed] [Google Scholar]
- 8.Omachi TA, Iribarren C, Sarkar U, et al. Risk factors for death in adults with severe asthma. Ann Allergy Asthma Immunol. 2008;101(2):130-36. [DOI] [PMC free article] [PubMed] [Google Scholar]
- 9.Serra-Batlles J, Plaza V, Morejon E, Comella A, Brugues J.. Costs of asthma according to the degree of severity. Eur Respir J. 1998;12(6):1322-26. [DOI] [PubMed] [Google Scholar]
- 10.Calhoun WJ, Haselkorn T, Mink DR, Miller DP, Dorenbaum A, Zeiger RS.. Clinical burden and predictors of asthma exacerbations in patients on guideline-based steps 4-6 asthma therapy in the TENOR cohort. J Allergy Clin Immunol Pract. 2014;2(2):193-200. [DOI] [PubMed] [Google Scholar]
- 11.Cisternas MG, Blanc PD, Yen IH, et al. A comprehensive study of the direct and indirect costs of adult asthma. J Allergy Clin Immunol. 2003;111(6):1212-18. [DOI] [PubMed] [Google Scholar]
- 12.Chung KF, Wenzel SE, Brozek JL, et al. International ERS/ATS guidelines on definition, evaluation and treatment of severe asthma. Eur Respir J. 2014;43(2):343-73. [DOI] [PubMed] [Google Scholar]
- 13.Birnbaum HG, Ivanova JI, Yu AP, et al. Asthma severity categorization using a claims-based algorithm or pulmonary function testing. J Asthma. 2009;46(1):67-72. [DOI] [PubMed] [Google Scholar]
- 14.Ivanova JI, Bergman R, Birnbaum HG, Colice GL, Silverman RA, McLaurin K.. Effect of asthma exacerbations on health care costs among asthmatic patients with moderate and severe persistent asthma. J Allergy Clin Immunol. 2012;129(5):1229-35. [DOI] [PubMed] [Google Scholar]
- 15.Wener RR, Bel EH.. Severe refractory asthma: an update. Eur Respir Rev. 2013;22(129):227-35. [DOI] [PMC free article] [PubMed] [Google Scholar]
- 16.Sullivan SD, Rasouliyan L, Russo PA, Kamath T, Chipps BE, Group TS.. Extent, patterns, and burden of uncontrolled disease in severe or difficult-to-treat asthma. Allergy. 2007;62(2):126-33. [DOI] [PubMed] [Google Scholar]
- 17.Talreja N, Baptist AP.. Effect of age on asthma control: results from the National Asthma Survey. Ann Allergy Asthma Immunol. 2011;106(1):24-29. [DOI] [PubMed] [Google Scholar]
- 18.Global Initiative for Asthma. Global stategy for asthma management and prevention. Updated 2015. Available at: http://ginasthma.org/wp-content/uploads/2016/01/GINA_Report_2015_Aug11-1.pdf. Accessed May 19, 2016.
- 19.National Committee for Quality Assurance. Improving outcomes in asthma: advancing quality using NCQA HEDIS Measures. October 25, 2011. Available at: http://www.ncqa.org/portals/0/education/NCQA%20Asthma%20webinar%200ct%202011.pdf. Accessed May 19, 2016.
- 20.Reddel HK, Taylor DR, Bateman ED, et al. An official American Thoracic Society/European Respiratory Society statement: asthma control and exacerbations: standardizing endpoints for clinical asthma trials and clinical practice. Am J Respir Crit Care Med. 2009;180(1):59-99. [DOI] [PubMed] [Google Scholar]
- 21.Quan H, Li B, Couris CM, et al. Updating and validating the Charlson comorbidity index and score for risk adjustment in hospital discharge abstracts using data from 6 countries. Am J Epidemiol. 2011;173(6):676-82. [DOI] [PubMed] [Google Scholar]
- 22.U.S. Department of Labor, Bureau of Labor Statistics. Consumer Price Index. Medical care. Series ID: CUUR0000SAM. Available at: http://data.bls.gov/cgi-bin/surveymost?cu. Accessed May 4, 2016.
- 23.Ivanova JI, Birnbaum HG, Hsieh M, et al. Adherence to inhaled corticosteroid use and local adverse events in persistent asthma. Am J Manag Care. 2008;14(12):801-09. [PubMed] [Google Scholar]
- 24.Lane SJ, Petersen H, Seltzer JM, et al. Moderate symptom-based exacerbations as predictors of severe claims-based exacerbations in asthma. J Asthma. 2013;50(6):642-48. [DOI] [PubMed] [Google Scholar]
- 25.Engelkes M, Janssens HM, de Jongste JC, Sturkenboom MC, Verhamme KM.. Medication adherence and the risk of severe asthma exacerbations: a systematic review. Eur Respir J. 2015;45(2):396-407. [DOI] [PubMed] [Google Scholar]
- 26.Melani AS, Bonavia M, Cilenti V, et al. Inhaler mishandling remains common in real life and is associated with reduced disease control. Respir Med. 2011;105(6):930-38. [DOI] [PubMed] [Google Scholar]
- 27.Moore WC, Fitzpatrick AM, Li X, et al. Clinical heterogeneity in the severe asthma research program. Ann Am Thorac Soc. 2013;10(Suppl):S118-124. [DOI] [PMC free article] [PubMed] [Google Scholar]
- 28.Wenzel SE. Asthma phenotypes: the evolution from clinical to molecular approaches. Nat Med. 2012;18(5):716-25. [DOI] [PubMed] [Google Scholar]
- 29.Katz LE, Gleich GJ, Hartley BF, Yancey SW, Ortega HG.. Blood eosinophil count is a useful biomarker to identify patients with severe eosinophilic asthma. Ann Am Thorac Soc. 2014;11(4):531-36. [DOI] [PubMed] [Google Scholar]