

Abstract
BACKGROUND:
Since multiple myeloma (MM) incurs a substantial economic burden in care management, more and more discussion has been generated in recent years about the costs of novel antimyeloma drugs and their associated value. Because of these costs, economic assessment that quantifies value of care over the long-term is essential.
OBJECTIVE:
To determine the cost-effectiveness (measured as cost per life-year saved) of front-line novel agent-based therapy use among a cohort of elderly patients with MM in a real-world setting.
METHODS:
We identified 2,551 elderly patients with advanced MM from 2000 to 2009 who initiated novel agent-based therapy (bortezomib, lenalidomide, or thalidomide) or chemotherapy from the Surveillance, Epidemiology, and End Results-Medicare linked data. Patients were characterized according to age at diagnosis, sex, race, geographic region, marital status, socioeconomic status, comorbidities, and receipt of novel agents. Twenty-month cost of care and overall survival related to MM were compared between patients treated with novel agent-based therapy and patients treated with chemotherapy. A net monetary benefit approach and corresponding cost-effectiveness acceptability curves were used to evaluate the cost-effectiveness of novel agent-based therapy.
RESULTS:
Overall, average 12-month MM total costs were 2.03 times higher for novel agent-based therapy ($144,665) than for chemotherapy ($47,750). Antimyeloma pharmacy costs represented about 31% ($45,095) of total MM costs for patients treated with novel agents but represented about 19% ($8,921) of total MM costs for patients treated with chemotherapy. Twelve-month survival rates increased significantly among patients receiving novel agents compared with patients receiving chemotherapy. In the incremental net monetary benefit analysis, after adjusting for potential covariates, patient use of novel agents was only cost-effective compared with chemotherapy when the willingness-to-pay thresholds were high, at about $230,000.
CONCLUSIONS:
Given the most common treatment practices in the United States, the use of novel agent-based therapy is not cost-effective at its current level of cost and effectiveness. Future studies should evaluate the generalizability of these results by evaluating cost-effectiveness of novel agent-based therapy use in different patient populations.
What is already known about this subject
In the past decade, the novel agents bortezomib (a protease inhibitor) and lenalidomide and thalidomide (immunomodulatory drugs), often given in combination with corticosteroids, demonstrated significant improvement in extending progressionfree survival and time to progression in patients with multiple myeloma (MM).
While novel agents have demonstrated improved efficacy among patients with MM, the costs of care for patients receiving novel agent-based treatment for MM increased.
What this study adds
Twelve-month survival rates increased significantly among patients receiving novel agents compared with those receiving chemotherapy.
Given the most common U.S. treatment practices, the use of novel agent-based therapy is not cost-effective at its current level of cost and effectiveness.
Patient use of novel agents was only cost-effective compared with chemotherapy when the willingness-to-pay thresholds were very high, at about $230,000.
Multiple myeloma (MM), a cancer of plasma cells, is characterized by the crowding out of healthy plasma cells by abnormal myeloma cells within bone marrow.1-3 In the United States, it is the third most common blood cancer after lymphoma and leukemia and accounts for 1% of all cancers and more than 10% of all hematologic malignancies.4-5 For 2013, it is estimated that 95,688 Americans were living with MM,6 and the average age at diagnosis was between 65 and 74 years.7 MM is characterized by a pattern of continuous relapse, with each progression becoming more aggressive and less sensitive to treatment and each remission becoming shorter than the preceding one, ultimately leading to death. While MM is considered incurable with currently available therapies, the 5-year survival rate is 48.5%,6 and median survival measured from the initiation of antimyeloma therapy using the International Staging System was 62 months for stage I, 44 months for stage II, and 29 months for stage III.1 MM is a complex, heterogeneous blood cancer with serious disease-related complications. Renal insufficiency, hematologic complications, infections, bone complications, and neurologic complications are all negative sequelae of MM.8 These complications may need specific medical care and lead to a substantial amount of health care resource utilization.
In the past decade, novel agents bortezomib—a protease inhibitor (PI)—and lenalidomide and thalidomide—2 immunomodulatory drugs (IMiDs)—often given in combination with corticosteroids (dexamethasone or prednisone), demonstrated significant improvement in extending progression-free survival and time to progression in patients with newly diagnosed MM and in patients with relapsed or refractory MM.9-11 In the United States, the use of PIs and IMiDs has been continuously increasing and has become standards of care in the clinical practice guidelines from the National Comprehensive Cancer Network (NCCN) as primary and salvage therapy in MM patients.12 While novel agents have demonstrated improved efficacy among patients with MM, there are concerns regarding the costs of care for patients receiving novel agent-based treatment for MM. In a 2015 study from the claims database of a large U.S. health plan, investigators reported that total direct monthly costs of the first 18-month period for patients with newly diagnosed MM and for relapsed MM who were treated with bortezomib- or lenalidomide-based therapies were $15,734 and $13,786, respectively.13 Another retrospective study evaluated U.S. claims for patients with MM and at least 1 course of treatment with bortezomib, thalidomide, lenalidomide, or other chemotherapy or radiotherapy between January 1, 2005, and September 30, 2010. This study reported that average adjusted total costs in the year following antimyeloma therapy initiation were between $111,000 and $159,000.14
Since MM incurs a substantial economic burden in care management, more discussion has been generated in recent years regarding the costs of novel antimyeloma drugs and their associated value. Because of these costs, economic assessment that quantifies value of care over the long-term is essential. For this study, we applied a standard cost-effectiveness analysis (CEA) methodology that compares the costs and health consequences of alternative drug treatments for cancer. Depending on improvement in condition associated with the newer therapy, patients may use more or less health care services and resources and may live more or less years on average. The CEA method therefore compares the net difference in life expectancy with the net difference in health care cost to obtain a cost per year of life saved. Only focusing on the drug costs would not consider the potential cost changes associated with the change in patient health. For example, a better drug may reduce relapse and thereby reduce doctor visits and hospitalizations. Alternatively, a new drug may have severe side effects that would cause more doctor visits and hospitalizations for treating those effects. CEAs that examine the overall value of a treatment in terms of incremental costs over incremental health benefits are helpful in setting priorities for funding of health care programs and in policy making. The purpose of this study was to use data on a large, nationwide population-based cohort of elderly MM patients treated with antimyeloma therapy to measure the cost-effectiveness (measured as cost per life-year saved) of novel agent use in a real-world setting.
Methods
Data Source
The Surveillance, Epidemiology, and End Results (SEER)-Medicare Linked Database was used to identify patients with MM. The SEER tumor registries, supported by the National Cancer Institute, includes population-based cancer registries in more than 17 geographic areas, including Connecticut and New Jersey in the Northeast; Kentucky, Louisiana, Atlanta, rural Georgia, Detroit, and Iowa in the North Central region; and Hawaii, New Mexico, Seattle-Puget Sound, Utah, San Francisco-Oakland, San Jose-Monterey, Los Angeles, Greater California, and Arizona in the West, which accounts for about 28% of the U.S. population. Medicare is the federally funded program that provides health insurance for the elderly, persons with end-stage renal disease, and some disabled persons.
This research was approved by the Committee for the Protection of Human Subjects at the University of Texas Health Science Center at Houston.
Study Population and Patient Characteristics
This retrospective cohort study included patients aged 65-90 years with advanced (distant stage) MM who received a diagnosis during the period January 1, 2000-December 31, 2009, and who received antimyeloma treatment in the study time period and had Medicare Part A and Part B before antimyeloma therapy initiation and in the 12 months from the initiation of antimyeloma therapy. Patients were excluded if they were enrolled in a Medicare Advantage health maintenance organization during the diagnosis time period.15 Patients were also excluded if they had any claim for antimyeloma treatment before their MM diagnosis, had previous or simultaneous diagnosis of another primary cancer, or had any claims for autologous stem cell transplantation across the continuous enrollment period to avoid any potential bias or confounding effects.15
Data were collected for patients who met the selection criteria in the baseline period for patient demographic and clinical characteristics, including age, sex, race/ethnicity, socioeconomic status, geographic region, and pre-existing comorbidities measured with the Charlson Comorbidity Index. Antimyeloma drug and drug administration costs were captured from the SEER-Medicare data with Healthcare Common Procedure Coding System (HCPCS) codes for drugs and Current Procedural Terminology (CPT) codes indicating chemotherapy drug administration. Claims for antimyeloma therapies were identified from Medicare inpatient, outpatient, and physician files in 2000-2009 or Part D data in 2007-2009, using National Drug Code numbers. Total health care costs, measured from a payer’s perspective, included antimyeloma pharmacy costs (antimyeloma therapy and administration) and medical costs (inpatient, emergency room visits, outpatient, laboratory, non-antimyeloma-related pharmacy, and other medical services).
Patients were described with respect to demographic and clinical characteristics overall and stratified by receipt of novel agents (PI and IMiD). Chi-square tests for categorical variables and t-tests for continuous variables were conducted to examine if patients who had received novel agents and those who had not received novel agents differed on those characteristics.
Survival Analysis
Twelve-month overall survival was measured from antimyeloma therapy initiation to date of death or end of the 12-month follow-up and compared between patients who had received a novel agent-based therapy and patients who had conventional chemotherapy for front-line treatment using the Kaplan-Meier method and corresponding log-rank test. Patients who were lost to follow-up in 12 months were censored at the date when they were last seen in the SEER-Medicare data. If a patient’s survival time was greater than 12 months, it was considered censored as well. Cox proportional hazards regression analysis was carried out to determine the effect of receipt of novel agents on risk of death after adjusting for demographic (age, sex, race, and marital status) and clinical (radiation therapy or comorbidity index) covariates. Covariance adjustment using propensity score in the Cox regression model was applied to remove the bias of the background covariates and also control for biases due to measured confounders.16-18
Costs Analysis
The 12-month costs of care were estimated and compared between patients receiving novel agent-based therapy and those receiving conventional chemotherapy as front-line therapy using the Kaplan-Meier Sample Average (KMSA) approach, a robust method for estimating costs over time when complete follow-up is not available and when costs vary over time.19,20 The percentile method to 10,000 bootstrap samples was applied to calculate variances and 95% confidence intervals (CIs). Because MM is a disease of the elderly and is accompanied by a higher risk for multiple cancers and age-related increase in cardiovascular disease and other morbidities for older adults, all of which are expensive to treat, the cost analysis considered only direct costs of treating MM. The costs not directly associated with MM were excluded to avoid significant cost bias. Detailed methods for estimating health care costs related to cancer treatment from SEER-Medicare data have been previously described in the literature.21 In brief, MM-related health care encounters were defined as any inpatient or outpatient services with the International Classification of Diseases, Ninth Revision, Clinical Modification diagnosis codes for MM (203.0*) and prescription claims with the HCPCS/CPT-4 codes or Part D claims for the corresponding antimyeloma therapies as described.
In a 2015 study, Farr et al. used an electronic medical record database to evaluate duration of antimyeloma therapy.22 They found that the median duration of front-line therapy was 196 days (95% CI = 180-208) and that 35% of the patients were still on front-line therapy by 12 months. Similar findings were observed in our study: The overall median duration of frontline therapy was 4.7 months (interquartile range [IQR] = 2.7-9.2; Table 1). Based on these data, front-line treatment initiation date and 12 months were selected to capture the time period in which front-line antimyeloma therapy would potentially affect cost and outcomes.
TABLE 1.
Comparison of Characteristics Between MM Patients Receiving Novel Agent-Based Therapy and Those Receiving Conventional Chemotherapy
| Characteristicsa | All Patients N = 2,551 | Front-Line Therapy Received | P Value for Difference Between Both Groups | |
|---|---|---|---|---|
| Novel Agent-Based n = 2,066 | Chemotherapy n = 485 | |||
| Year of diagnosis | ||||
| 2000-2004 | 761 (29.8) | 351 (17.0) | 410 (84.5) | |
| 2005-2009 | 1,790 (70.2) | 1,715 (83.0) | 75 (15.5) | < 0.001 |
| Age, years, median (range) | 73 (65-90) | 73 (65-90) | 71 (65-90) | < 0.001 |
| Age group, years | ||||
| 65-69 | 873 (34.2) | 683 (33.1) | 190 (39.2) | |
| 70-74 | 709 (27.8) | 566 (27.4) | 143 (29.5) | |
| 75-79 | 508 (19.9) | 427 (20.7) | 81 (16.7) | |
| 80-84 | 336 (13.2) | 287 (13.9) | 49 (10.1) | |
| 85-90 | 125 (4.9) | 103 (5.0) | 22 (4.5) | 0.014 |
| Gender, n (%) | ||||
| Male | 1,308 (51.3) | 1,036 (50.1) | 272 (56.1) | |
| Female | 1,243 (48.7) | 1,030 (49.9) | 213 (43.9) | 0.019 |
| Race, n (%) | ||||
| White | 2,031 (80.8) | 1,638 (80.6) | 393 (81.7) | |
| Black | 356 (14.2) | 288 (14.2) | 68 (14.1) | |
| Other | 125 (5.0) | 105 (5.2) | 20 (4.2) | 0.652 |
| Marital status | ||||
| Married | 1,554 (64.8) | 1,229 (63.4) | 325 (71.0) | |
| Unmarried | 844 (35.2) | 711 (36.6) | 133 (29.0) | 0.002 |
| Stem cell transplant | ||||
| Yes | 228 (8.9) | 189 (9.2) | 39 (8.0) | 0.442 |
| Radiation therapy | ||||
| Yes | 1,175 (46.1) | 926 (44.8) | 249 (51.3) | 0.009 |
| Baseline CCI score | ||||
| 0 | 411 (16.1) | 298 (14.4) | 113 (23.3) | |
| 1 | 1,208 (47.4) | 975 (47.2) | 233 (48.0) | |
| 2+ | 932 (36.5) | 793 (38.4) | 139 (28.7) | < 0.001 |
| Socioeconomic status | ||||
| 0% to < 25% (low SES) | 591 (23.4) | 460 (22.5) | 131 (27.3) | |
| 25% to < 50% | 584 (23.1) | 476 (23.3) | 108 (22.5) | |
| 50% to < 75% | 652 (25.8) | 535 (26.2) | 117 (24.4) | |
| 75% to 100% (high SES) | 697 (27.6) | 573 (28.0) | 124 (25.8) | 0.166 |
| Geographic region | ||||
| West | 1,108 (43.4) | 884 (42.8) | 224 (46.2) | |
| Northeast | 482 (18.9) | 412 (19.9) | 70 (14.4) | |
| Midwest | 376 (14.7) | 293 (14.2) | 83 (17.1) | |
| South | 585 (22.9) | 477 (23.1) | 108 (22.3) | 0.021 |
| Duration of treatment | ||||
| Median (IQR 1-3) | 4.7 (2.7-9.2) | 5.3 (2.8-10.8) | 3.5 (2.1-5.3) | < 0.001 |
| Mean (SD) | 7.7 (8.2) | 8.4 (8.6) | 4.7 (4.8) | < 0.001 |
| Front-line regimen | ||||
| PI-based | 1,169 (45.8) | 1,169 (56.6) | – | |
| IMiD-based | 537 (21.1) | 537 (26.0) | – | |
| PI + IMiD combination | 360 (14.1) | 360 (17.4) | – | |
| Chemotherapy | 485 (19.0) | – | 485 (100.0) | – |
aUnless otherwise noted, all values are presented as n (%).
CCI = Charlson Comorbidity Index; IQR = interquartile range; IMiD = immunomodulatory drugs; MM = mulitple myeloma; PI = protease inhibitor; SD = standard deviation; SES = socioeconomic status.
For our study, costs of treating MM up to 12 months from the initiation of front-line antimyeloma therapy were captured in Medicare claims data and characterized from the U.S. payer perspective. Costs for each patient were calculated by adding the cumulative reimbursement amounts derived from claims in the Medicare inpatient, outpatient, physician, and hospice/home health files beginning from the date of antimyeloma therapy initiation. Costs were calculated overall and by antimyeloma pharmacy costs and medical costs for the purpose of identifying underlying cost drivers behind observed differences in treatment cohorts using HCPCS and CPT codes. To further validate the findings, costs of treating MM up to 18 months from the initiation of front-line antimyeloma therapy were calculated for sensitivity analyses (Appendices A and B, available in online article). Discounting was not applied due to the short time frame of the cost period.
Net Monetary Benefit Analysis
To estimate the cost-effectiveness of novel agent-based therapy, the net monetary benefit (NMB) of novel agent-based therapy was calculated. The basic model for deriving the NMB is as follows:
In this equation, Bij = survival time for patient i; Cij = cost of treatment for patient i; X = demographic and clinical covariates; and λ= specified ceiling ratio (i.e., willingness to pay). Since it allows for the modeling of the joint density of costs and effectiveness using standard regression techniques and, therefore, leads to a less biased estimate of cost-effectiveness in the presence of pre-existing baseline differences between treatment cohorts in observational studies, the NMB approach is highly amenable to observational data.23,24 Finally, the NMB provides a straightforward indication of the results for any level of decision-maker willingness to pay. The NMB is the per-patient monetary value of the novel treatment, which can be a gain (positive value) or a loss (negative value), depending on whether the value of the benefits outweigh the costs. The uncertainty of the NMB was illustrated using cost-effectiveness acceptability curves.
Results
A total of 2,551 Medicare beneficiaries met the study eligibility criteria; 2,066 (81%) received novel agent-base therapy; and 485 (19%) received conventional chemotherapy. Table 1 shows the baseline demographic and clinical characteristics overall and by receipt of novel agent. The overall median age at diagnosis was 73 years (range = 65-90 years), and 51% (n = 1,148) were male. A large majority (n = 2,031, 81%) were non-Hispanic white. Patient characteristics were similar between the 2 cohorts with regard to race and socioeconomic status. Notably, patients receiving novel agent-based therapy had a greater median age at diagnosis (P < 0.001) and more baseline comorbidities (P < 0.001) compared with those receiving conventional chemotherapy. Patients who were female, unmarried, or in the Northeast were more likely to receive novel agent-based therapy than those patients who were male and married (P = 0.019, P = 0.002, P = 0.021, respectively). Further, a greater proportion of patients receiving conventional chemotherapy underwent radiation therapy compared with those receiving novel agent-based therapy (P = 0.009), but there was no significant difference between these 2 cohorts on stem cell transplantation (P = 0.442). Overall, the use of novel agents increased over time, while the use of conventional chemotherapy decreased over time (P < 0.001). The median duration of treatment among patients receiving novel agents was 5.3 months, with an IQR of 2.8-10.8 months, which was significantly longer than chemotherapy users (3.5 months, IQR = 2.1-5.3, P < 0.001; Table 1).
Overall Survival
Kaplan-Meier estimates of 12-month overall survival by receipt of novel agent-based therapy are presented in Figure 1. The use of novel agent-based therapy was associated with improved overall survival (12-month survival probability, 0.80 vs. 0.74 for patients receiving novel agent-based therapy vs. those receiving chemotherapy; log-rank P = 0.006). In a univariate Cox regression model (Table 2), we found that the use of novel agents was associated with a reduced 12-month risk of mortality. The crude hazard ratio (HR) was 0.75 (95% CI = 0.62-0.92, P = 0.006). After adjusting for confounding variables, including age at diagnosis, gender, race, geographic region, marital status, socioeconomic status, and baseline comorbidity, the HR from the multivariate Cox regression analysis was 0.71 (95% CI = 0.58-0.87, P = 0.001). In the Cox model, adjusted by propensity scores of receiving novel agent-based therapy, the same improvement in HR for overall survival was observed for patients who received novel agents (HR = 0.71, 95% CI = 0.58-0.87, P = 0.001; Table 2).
FIGURE 1.

Kaplan-Meier Estimates of Overall Survival for MM Patients Stratified by Receipt of Novel Agent-Based Therapy
TABLE 2.
Multivariate OS Analysis of MM Patients Receiving Novel Agent-Based Therapy Versus Chemotherapy by Cox Proportional Hazards Model
| Characteristic | Univariate | Multivariate | ||||
|---|---|---|---|---|---|---|
| Hazard Ratio | 95% CI | P Value | Hazard Ratio | 95% CI | P Value | |
| Front-line treatment | ||||||
| Chemotherapy | 1.00 (Ref) | – | 1.00 (Ref) | – | ||
| Novel agent-based | 0.75 | 0.62-0.92 | 0.006 | 0.71 | 0.58-0.87 | 0.001 |
| Age at diagnosis, years | ||||||
| 65-69 | 1.00 (Ref) | – | – | 1.00 (Ref) | – | |
| 70-74 | 1.19 | 0.94-1.50 | 0.145 | 1.19 | 0.94-1.50 | 0.154 |
| 75-79 | 1.39 | 1.09-1.78 | 0.008 | 1.44 | 1.12-1.84 | 0.004 |
| 80-84 | 1.94 | 1.50-2.50 | < 0.001 | 1.95 | 1.50-2.53 | < 0.001 |
| 85-90 | 2.36 | 1.68-3.31 | < 0.001 | 2.38 | 1.68-3.38 | < 0.001 |
| Sex | ||||||
| Male | 1.00 (Ref) | – | 1.00 (Ref) | – | ||
| Female | 0.92 | 0.77-1.08 | 0.307 | 0.91 | 0.76-1.08 | 0.276 |
| Race | ||||||
| White | 1.00 (Ref) | – | – | 1.00 (Ref) | – | |
| Black | 1.10 | 0.87-1.39 | 0.438 | 1.08 | 0.83-1.40 | 0.551 |
| Other | 0.94 | 0.63-1.41 | 0.763 | 0.92 | 0.61-1.39 | 0.681 |
| Unknown/missing | 0.45 | 0.17-1.21 | 0.116 | 0.59 | 0.21-1.64 | 0.308 |
| Region | ||||||
| West | 1.00 (Ref) | 1.00 (Ref) | – | |||
| Northeast | 0.98 | 0.77-1.23 | 0.836 | 0.98 | 0.76-1.26 | 0.865 |
| Midwest | 1.11 | 0.87-1.42 | 0.409 | 1.07 | 0.83-1.39 | 0.580 |
| South | 1.00 | 0.81-1.25 | 0.979 | 0.99 | 0.78-1.25 | 0.938 |
| Marital status | ||||||
| Married | 1.00 (Ref) | 1.00 (Ref) | – | |||
| Unmarried | 1.08 | 0.90-1.29 | 0.420 | 1.00 | 0.83-1.22 | 0.979 |
| Unknown | 0.73 | 0.48-1.11 | 0.139 | 0.75 | 0.49-1.15 | 0.193 |
| Socioeconomic status | ||||||
| 0% to < 25% (low) | 1.00 (Ref) | – | 1.00 (Ref) | – | ||
| 25% to < 50% | 0.94 | 0.73-1.19 | 0.588 | 0.99 | 0.77-1.28 | 0.937 |
| 50% to < 75% | 0.88 | 0.69-1.12 | 0.295 | 0.91 | 0.70-1.18 | 0.492 |
| 75% to 100% (high) | 0.87 | 0.69-1.11 | 0.261 | 0.92 | 0.71-1.20 | 0.546 |
| Unknown/missing | 0.62 | 0.23-1.68 | 0.348 | 0.82 | 0.29-2.27 | 0.700 |
| Baseline CCI score | ||||||
| 0 | 1.00 (Ref) | – | – | 1.00 (Ref) | – | |
| 1 | 1.16 | 0.89-1.52 | 0.269 | 1.10 | 0.84-1.44 | 0.493 |
| 2+ | 1.60 | 1.22-2.09 | 0.001 | 1.47 | 1.12-1.94 | 0.006 |
| Adjusted propensity score | ||||||
| Chemotherapy | 1.00 (Ref) | |||||
| Novel agent-based | 0.71 | 0.58-0.87 | 0.001 | |||
CCI = Charlson Comorbidity Index; CI = confidence interval; MM = multiple myeloma; OS = overall survival; Ref=reference.
Cost Analysis
The 12-month cumulative costs of patients receiving novel agent-based treatment versus those receiving conventional chemotherapy are presented in Figure 2. Total MM-related costs were 2.03 times higher for novel agent-based therapy (average 12-month costs, $144,665) versus conventional chemotherapy (average 12-month costs, $47,750; cost difference, $96,879; 95% CI = $96,848-$96,910). Antimyeloma pharmacy spending represented about 31% (average 12-month costs, $45,095) of total MM-related spending for patients treated with novel agent-based therapy, while it represented about 19% (average 12-month costs, $8,921) of total MM-related spending for those treated with chemotherapy. Total antimyeloma pharmacy costs were 4.05 times higher for novel agent-based therapy versus chemotherapy (cost difference, $36,174; 95% CI = $36,168-$36,178). The 12-month MM-related medical costs of patients receiving novel agent-based therapy were 2.53 times of those receiving chemotherapy (average 12-month costs, $96,903 vs. $38,322; cost difference, $58,581; 95% CI = $58,554-$58,608). The higher MM-related medical costs observed in patients receiving novel agent-based therapy could largely be explained by longer duration of treatment in patients receiving novel agent-based therapy (mean duration of treatment, 8.4 months) compared with those receiving chemotherapy (mean duration of treatment, 4.7 months; P < 0.001; Table 1), which not only were associated with more antimyeloma drug use, but in turn translated into more health care utilization and costs.
FIGURE 2.
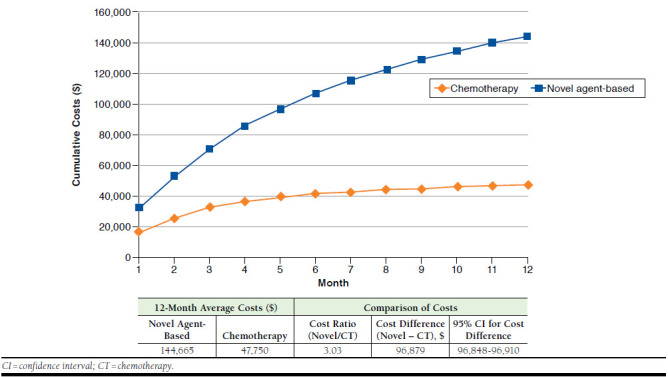
Twelve-Month Cumulative Costs for Patients Receiving Novel Agent-Based Therapy Versus Those Receiving Chemotherapy
Cost-Effectiveness
The cost-effectiveness of the receipt of novel agent-based therapy was estimated by modeling the incremental NMB of this strategy. Incremental NMB (iNMB) of novel agent-based therapy over conventional chemotherapy and corresponding 95% CIs across a range of willingness-to-pay thresholds are reported in Table 3, with corresponding cost-effectiveness acceptability curves presented in Appendix A. We found that novel agent-base therapy was cost-effective at higher willingness-to-pay thresholds, whereas at lower thresholds, conventional chemotherapy became the cost-effective strategy.
TABLE 3.
Net Monetary Benefit Analysis on Novel Agent-Based Therapy
| Ceiling Ratio ($/Life-Year Gained) | Incremental Net Monetary Benefit (95% CI, $) | Probability of Being Cost-Effective | |
|---|---|---|---|
| 100,000 | -51,073 | -96,589 – -5,557 | 0.014 |
| 150,000 | -29,128 | -95,389 – 37,133 | 0.194 |
| 200,000 | -7,183 | -94,608 – 80,242 | 0.436 |
| 250,000 | 14,762 | -94,001 – 123,525 | 0.605 |
| 300,000 | 36,707 | -93,482 – 166,896 | 0.710 |
| 350,000 | 58,652 | -93,015 – 210,319 | 0.776 |
| 400,000 | 80,596 | -92,579 – 253,773 | 0.819 |
| 450,000 | 102,542 | -92,165 – 297,249 | 0.849 |
| 500,000 | 124,487 | -91,766 – 340,740 | 0.870 |
CI = confidence interval.
Novel agent-based therapy was associated with a positive survival effect. This benefit, however, is offset by the higher costs associated with it when the willingness to pay is relatively low, such that the iNMB is negative. With higher levels of willingness to pay, the cost of improved survival is not offset by the costs, resulting in a positive iNMB. For example, given that a payer is willing to pay only $100,000 per life-year gained, then novel agent-based therapy yields an iNMB of -$51,073 (95% CI = -$96,589 to -$5,557). On the opposite spectrum, if a payer is willing to spend as much as $300,000 per life-year gained, then the observed higher costs of novel agent-based therapy becomes overwhelmed by the high willingness to pay, and use of novel agent-based therapy yields an iNMB of $36,707 (95% CI = -$93,482-$166,896). A threshold of $150,000 per quality-adjusted life-year (QALY) gained was used for the U.S. probabilistic analyses,23,24 and the Institute for Clinical and Economic Review typically applies the threshold range of $100,000 to $150,000 per QALY for cancer in current assessments. In our analysis, at the norm for a willingness to pay of $150,000 per life-year gained for MM, novel agent-based therapy has a negative iNMB of -$29,128, with a probability of 19.4% being cost-effective. There is, however, considerable uncertainty around this estimate, with a 95% CI of -$95,389-$37,133. The incremental cost-effectiveness ratio (ICER) was calculated as incremental costs per life-year gained, which was $220,681 (95% CI = -$4,311,571-$5,253,916).
Discussion
The cost of cancer treatments is rising at an unsustainable rate of 15% per year in the United States.25 Cancer costs account for approximately 5% of U.S. health care spending.26 Since this proportion is likely to continue to increase as cancer patients live longer with their disease and thus consume a greater share of health care resources, which will outpace the expansion of available resources, it is increasingly important to carry out economic evaluations to identify the drug with the best value within its therapeutic class.
Our results suggest that novel agent use is only favorable compared with conventional chemotherapy when the willingness-to-pay thresholds are very high. This conclusion is based on the observation that the total MM-related spending in MM patients receiving novel agent-based regimen was significantly higher than patients receiving conventional chemotherapy, which translates into superior effectiveness. The cost-effectiveness acceptability curve was typical for treatments that are more effective but more expensive than the alternative option. Because MM is a rare form of cancer, the inclusion of novel agent-based therapy on a formulary appears to have a relatively small effect on the health care budget. However, using novel agent-based regimens as front-line therapy means that to reach standard cost-effectiveness levels the entire regimen would need to be deeply discounted. For example, to reach the threshold $150,000 per life-year gained, novel agent-based treatment would need to be discounted by about 21.5%.
In our study, bortezomib had the largest market share in the study period. Of the 2,066 patients receiving novel agent-based therapy, 56.6% (n= 1,169) received bortezomib-based regimens, and 17.4% (n = 360) received bortezomib in combination with an IMiD (lenalidomide or thalidomide). In the United States, bortezomib was approved by the U.S. Food and Drug Administration in 2003, with full approval in 2005. The bortezomib formulation patent is expected to expire in 2017. Generic bortezomib market entry in 2017 is expected to have a positive and significant influence on the antimyeloma drug costs and lower the ICER for novel agent-based therapy.
To the best of our knowledge, this is the first U.S. study to empirically measure the cost-effectiveness of novel agents among a large cohort of elderly MM patients. European research by Blommestein et al. (2016) studied the effect of novel treatments for elderly patients with MM in daily practice by comparing real-world effects, including overall survival, QALY, and costs over time.27 Patients who received firstline treatment (n = 1,054) during 2004-2007 (cohort 1) and 2008-2013 (cohort 2) were included for the cost-effectiveness comparison, which used a patient-level simulation model comprising regression models. As reported in the study, use of novel agents was higher for cohort 2 compared with cohort 1. Mean overall survival and total MM-related costs for cohort 1 was 38 months and €44,200 and 42 months and €69,107 for cohort 2. The study estimated potential overall survival gains if all patients were to be treated using thalidomide-, lenalidomide-, and bortezomib-based regimens in that particular order and reported that compared with real-world treatment, this treatment sequence was associated with the ICER €24,618 per life-year gained and €34,875 per QALY. The Blommestein study concluded that increased use of novel agents improved survival and increased costs for real-world patients with MM in the Netherlands.27
These findings are consistent with what we found in our study: Novel agent-based therapy use resulted in significantly better long-term survival than conventional chemotherapy in Medicare patients with MM at the expense of significantly higher costs. Average 12-month antimyeloma pharmacy costs of patients receiving novel agents ($45,095) were more than 5 times of those receiving conventional chemotherapy ($8,921). Indeed, the cost of these novel agents is higher than previously used chemotherapy regimens, and these agents would be under the scrutiny of regulatory bodies such as the National Institute for Health and Clinical Excellence in the United Kingdom.28,29
A strength of our study is the measurement of the cost-effectiveness of novel agent-based therapy using data from a large cohort of geographically dispersed population-based elderly patients receiving novel agents or chemotherapy for MM. From a health care policy perspective, the significance of this study lies in the fact that MM is one of the most expensive cancer to treat, and with breakthrough drugs coming onto the market, it becomes increasingly important to identify the most cost-effective means by which to manage it.
Limitations
Several limitations of this study need to be noted. First, the greatest limitation is the lack of adjustment for quality of life (QoL). Improved QoL has been observed for patients receiving novel agent-based therapy in randomized trials.30-32 The use of novel agents may have a positive effect on QoL in real-world treatment, as well. The incorporation of QALY may increase the estimated effectiveness of novel agent-based therapy and could plausibly alter the cost-effectiveness of novel agent-based therapy reported in this analysis in a positive direction.
Second, although the propensity score adjustment was used to control for observable differences between comparison groups, and a regression-based KMSA model was used to estimate costs, the observational nonrandomized nature of this study leaves open the possibility of residual confounding. Furthermore, because tumor characteristic for MM only included distant stage, it was difficult to distinguish between high-risk disease and low-risk disease in this dataset, which could have affected the cost-effectiveness of novel therapy and chemotherapy in patients with MM.
Third, the study population included elderly patients who had continuous enrollment in Medicaid Part A and Part B coverage and were not health maintenance organization members. Findings may not be generalizable to a younger patient population. Moreover, some people may question that a few patients were still on front-line therapy at the end of 12 months, and MM-related costs may be underestimated based on 1-year follow-up data. In order to address this concern, a sensitivity analysis was conducted using 18-month costs and survival, which showed that there was no effect on the basic cost-effectiveness findings (Appendix B). In the cost analyses, we excluded non-MM treatment costs to avoid bias because of the elderly population, which is at higher risk for multiple morbidities that can cause high costs but are not attributable to MM care.33 So, it is worth noting that the cost-effectiveness ratio may change in a specific population when total health care costs are considered.
Finally, our methods relied on health care service codes on health insurance claims related to antimyeloma therapy. Errors in coding could introduce imprecision into our estimates. Patients enrolled in clinical trials do not have insurance claims associated with experimental treatment, so such treatment would be underestimated. Medicare claims may not capture all relevant health care costs. In addition, only therapies available up to 2010 were captured in the analysis, so recently approved therapies, such as the PI drug carfilzomib and the IMiD drug pomalidomide, were not part of this analysis.
Conclusions
Given the most common treatment practices in the United States, the use of novel agent-based therapy is not cost-effective at their current level of cost and effectiveness. Future studies should attempt to evaluate the generalizability of these results by evaluating cost-effectiveness of novel agent-based therapy use in different patient populations.
APPENDIX A. Cost-Effectiveness Acceptability Curves by Receipt of Novel Agent-Based Therapy

APPENDIX B. Multivariate OS Analysis of MM Patients Receiving Novel Agent-Based Therapy Versus Chemotherapy by the Cox Proportional Hazards Model (18-Month Follow-up)
| Characteristic | Univariate | Multivariate | ||||
|---|---|---|---|---|---|---|
| Hazard Ratio | 95% CI | P Value | Hazard Ratio | 95% CI | P Value | |
| Front-line treatment | ||||||
| Chemotherapy | 1.00 (Ref) | – | 1.00 (Ref) | – | ||
| Novel agent based | 0.83 | 0.70-0.99 | 0.034 | 0.78 | 0.66-0.93 | 0.006 |
| Age at diagnosi, years | ||||||
| 65-69 | 1.00 (Ref) | – | 1.00 (Ref) | – | ||
| 70-74 | 1.29 | 1.07-1.57 | 0.008 | 1.29 | 1.06-1.57 | 0.009 |
| 75-79 | 1.49 | 1.22-1.83 | < 0.001 | 1.52 | 1.24-1.87 | < 0.001 |
| 80-84 | 1.91 | 1.54-2.37 | < 0.001 | 1.92 | 1.54-2.39 | < 0.001 |
| 85-90 | 2.44 | 1.83-3.26 | < 0.001 | 2.45 | 1.83-3.29 | < 0.001 |
| Sex | ||||||
| Male | 1.00 (Ref) | – | 1.00 (Ref) | – | ||
| Female | 0.89 | 0.78-1.03 | 0.118 | 0.87 | 0.75-1.01 | 0.070 |
| Race | ||||||
| White | 1.00 (Ref) | – | 1.00 (Ref) | – | ||
| Black | 1.16 | 0.96-1.41 | 0.132 | 1.15 | 0.93-1.42 | 0.207 |
| Other | 0.85 | 0.60-1.21 | 0.369 | 0.84 | 0.59-1.20 | 0.335 |
| Unknown/missing | 0.62 | 0.31-1.24 | 0.174 | 0.69 | 0.33-1.45 | 0.325 |
| Region | ||||||
| West | 1.00 (Ref) | – | 1.00 (Ref) | – | ||
| Northeast | 1.04 | 0.85-1.26 | 0.717 | 1.03 | 0.84-1.27 | 0.746 |
| Midwest | 1.14 | 0.93-1.40 | 0.210 | 1.10 | 0.89-1.35 | 0.400 |
| South | 1.03 | 0.86-1.23 | 0.772 | 1.00 | 0.82-1.21 | 0.978 |
| Marital status | ||||||
| Married | 1.00 (Ref) | – | 1.00 (Ref) | – | ||
| Unmarried | 1.09 | 0.93-1.26 | 0.282 | 1.02 | 0.86-1.21 | 0.847 |
| Unknown | 0.88 | 0.64-1.21 | 0.436 | 0.89 | 0.64-1.23 | 0.474 |
| Socioeconomic status | ||||||
| 0% to < 25% (low) | 1.00 (Ref) | – | 1.00 (Ref) | – | ||
| 25% to < 50% | 0.91 | 0.74-1.11 | 0.346 | 0.96 | 0.78-1.19 | 0.732 |
| 50% to < 75% | 0.91 | 0.75-1.11 | 0.339 | 0.95 | 0.76-1.17 | 0.604 |
| 75% to 100% (high) | 0.83 | 0.68-1.01 | 0.063 | 0.87 | 0.70-1.08 | 0.210 |
| Unknown/missing | 0.84 | 0.41-1.70 | 0.628 | 1.05 | 0.50-2.18 | 0.905 |
| Baseline CCI score | ||||||
| 0 | 1.00 (Ref) | – | 1.00 (Ref) | – | ||
| 1 | 1.19 | 0.96-1.48 | 0.269 | 1.11 | 0.89-1.39 | 0.362 |
| 2+ | 1.58 | 1.27-1.98 | 0.001 | 1.43 | 1.14-1.79 | 0.002 |
| Adjusted propensity score | ||||||
| Chemotherapy | 1.00 (Ref) | |||||
| Novel agent-based | 0.79 | 0.66-0.94 | 0.007 | |||
CCI = Charlson Comorbidity Index; CI = confidence interval; MM = multiple myeloma; OS = overall survival; Ref=reference.
REFERENCES
- 1.American Cancer Society. About multiple myeloma. Revised January 19, 2016. Available at: https://www.cancer.org/content/dam/CRC/PDF/Public/8738.00.pdf. Accessed July 6, 2017.
- 2.Shah D, Seiter K.. Multiple myeloma. Medscape. Updated May 26, 2017. Available at: http://emedicine.medscape.com/article/204369-overview. Accessed June 25, 2017.
- 3.Braggio E, Fonseca R.. Genomic strategies determining progression from MGUS to multiple myeloma. In: Munshi NC, Anderson KC, eds. Advances in Biology and Therapy of Multiple Myeloma. Vol 1: Basic Science. New York: Springer; 2012:3-24. [Google Scholar]
- 4.Rajkumar SV. Treatment of multiple myeloma. Nat Rev Clin Oncol. 2011;8(8):479-91. [DOI] [PMC free article] [PubMed] [Google Scholar]
- 5.Rajkumar SV, Gahrton G, Bergsagel PL.. Approach to the treatment of multiple myeloma: a clash of philosophies. Blood. 2011;118(12):3205-11. [DOI] [PMC free article] [PubMed] [Google Scholar]
- 6.National Cancer Institute, Surveillance, Epidemiology, and End Results Program. Cancer stat facts: myeloma. Retrieved August 29, 2016. Available at: https://seer.cancer.gov/statfacts/html/mulmy.html. Accessed June 25, 2017.
- 7.Warren, JL, Harlan LC, Stevens J, Little RF, Abel GA.. Multiple myeloma treatment transformed: a population-based study of changes in initial management approaches in the United States. J Clin Oncol. 2013;31(16):1984-89. [DOI] [PMC free article] [PubMed] [Google Scholar]
- 8.Bladé J, Rosiñol L.. Complications of multiple myeloma. Hematol Oncol Clin North Am. 2007;21(6):1231-46. [DOI] [PubMed] [Google Scholar]
- 9.Benboubker L, Dimopoulos MA, Dispenzieri A, et al. Lenalidomide and dexamethasone in transplant-ineligible patients with myeloma. N Engl J Med. 2014;371(10):906-17. [DOI] [PubMed] [Google Scholar]
- 10.San Miguel JF, Schlag R, Khuageva NK, et al. Bortezomib plus melphalan and prednisone for initial treatment of multiple myeloma. N Engl J Med. 2008;359(9):906-17. [DOI] [PubMed] [Google Scholar]
- 11.Rajkumar SV, Rosinol L, Hussein M, et al. Multicenter, randomized, double-blind, placebo-controlled study of thalidomide plus dexamethasone compared with dexamethasone as initial therapy for newly diagnosed multiple myeloma. J Clin Oncol. 2008;26(13):2171-77. [DOI] [PMC free article] [PubMed] [Google Scholar]
- 12.National Comprehensive Cancer Network. NCCN Clinical Practice Guidelines in Oncology (NCCN Guidelines). Multiple myeloma. Version 1.2012. Available at: http://www.lecba-rakoviny.cz/dokumenty/NCCN_Guidelines_myeloma_2011.pdf. Accessed July 3, 2017. [DOI] [PubMed]
- 13.Arikian SR, Milentijevic D, Binder G, et al. Patterns of total cost and economic consequences of progression for patients with newly diagnosed multiple myeloma. Curr Med Res Opin. 2015;31(6):1105-15. [DOI] [PubMed] [Google Scholar]
- 14.Teitelbaum A, Ba-Mancini A, Huang H, Henk HJ.. Health care costs and resource utilization, including patient burden, associated with novel-agent-based treatment versus other therapies for multiple myeloma: findings using real-world claims data. Oncologist. 2013;18(1):37-45. [DOI] [PMC free article] [PubMed] [Google Scholar]
- 15.Warren JL, Klabunde CN, Schrag D, Bach PB, Riley GF.. Overview of the SEER-Medicare data: content, research applications, and generalizability to the United States elderly population. Med Care. 2002;40(Suppl 8):IV-3-8. [DOI] [PubMed] [Google Scholar]
- 16.Rubin DB, Thomas N.. Matching using estimated propensity scores: relating theory to practice. Biometrics. 1996;52(1):246-64. [PubMed] [Google Scholar]
- 17.Cochran WG. The effectiveness of adjustment by subclassification in removing bias in observational studies. Biometrics. 1968;24(2):296-313. [PubMed] [Google Scholar]
- 18.Rosenbaum PR, Rubin DB.. Reducing bias in observational studies using subclassification on the propensity score. J Am Stat Assoc. 1984;79(387):516-24. [Google Scholar]
- 19.Lin DY, Feuer EJ, Etzioni R, Wax Y.. Estimating medical costs from incomplete follow-up data. Biometrics. 1997;53(2):419-34. [PubMed] [Google Scholar]
- 20.Sloan JA, Cha SS, Wagner JL, Alberts SR, Lindman J, Allmer C.. Analyzing oncology patient health care costs using the SAS system. Paper presented at: SAS Users Groups International (SUGI) Conference 24, Statistics, Data Analysis, and Modeling; April 11-14, 1999; Miami Beach, FL. Available at: http://www2.sas.com/proceedings/sugi24/Stats/p284-24.pdf. Accessed June 25, 2017. [Google Scholar]
- 21.Brown ML, Riley GF, Schussler N, Etzioni R.. Estimating health care costs related to cancer treatment from SEER-Medicare data. Med Care. 2002;40(8 Suppl):IV-104-17. [DOI] [PubMed] [Google Scholar]
- 22.Farr AM, Stott-Miller M.. Front-line treatment patterns associated with elderly newly diagnosed multiple myeloma patients treated in the U.S. community setting. Blood. 2015;126(23):5360. Available at: http://www.bloodjournal.org/content/126/23/5360?sso-checked=true. Accessed June 25, 2017. [Google Scholar]
- 23.Hillner BE, Smith TJ.. Efficacy does not necessarily translate to cost effectiveness: a case study in the challenges associated with 21st-century cancer drug pricing. J Clin Oncol. 2009;27(13):2111-13. [DOI] [PubMed] [Google Scholar]
- 24.Neumann PJ, Cohen JT, Weinstein MC.. Updating cost-effectiveness— the curious resilience of the $50,000-per-QALY threshold. N Engl J Med. 2014;371(19):796-97. [DOI] [PubMed] [Google Scholar]
- 25.Kritz FL. Cancer patients facing costly treatments can benefit from frank talks with doctors. Los Angeles Times. February 16, 2009. Available at: http://articles.latimes.com/2009/feb/16/health/he-yourmoneynew16. Accessed June 25, 2017.
- 26.Marsland T, Robbins G, Marks A, Cassell R, Philips DG, King K.. Reducing cancer costs and improving quality through collaboration with payers: a proposal from the Florida Society of Clinical Oncology. J Oncol Pract. 2010;6(5):265-69. [DOI] [PMC free article] [PubMed] [Google Scholar]
- 27.Blommestein HM, Verelst SG, de Groot S, Huijgens PC, Sonneveld P, Uyl-de Groot CA.. A cost-effectiveness analysis of real-world treatment for elderly patients with multiple myeloma using a full disease model. Eur J Haematol. 2016;96(2):198-208. [DOI] [PubMed] [Google Scholar]
- 28.Low E. Many new cancer drugs in the United Kingdom are facing negative NICE rulings. J Clin Oncol. 2007;25(18):2635-36 [Letter]. [DOI] [PubMed] [Google Scholar]
- 29.Schey S, Higginson I.. Cost-effectiveness of lenalidomide in multiple myeloma. Expert Rev Pharmacoecon Outcomes Res. 2010;10(3):229-38. [DOI] [PubMed] [Google Scholar]
- 30.Lee SJ, Richardson PG, Sonneveld P, et al. Bortezomib is associated with better health-related quality of life than high-dose dexamethasone in patients with relapsed multiple myeloma: results from the APEX study. Br J Haematol. 2008;143(4):511-16. [DOI] [PubMed] [Google Scholar]
- 31.Alegre A, Oriol-Rocafiguera A, Garcia-Larana J, et al. Efficacy, safety and quality-of-life associated with lenalidomide plus dexamethasone for the treatment of relapsed or refractory multiple myeloma: the Spanish experience. Leuk Lymphoma. 2012;53(9):1714-21. [DOI] [PubMed] [Google Scholar]
- 32.Delforge M, Minul L, Eisenmann JC, et al. Health-related quality-of-life in patients with newly diagnosed multiple myeloma in the FIRST trial: lenalidomide plus low-dose dexamethasone versus melphalan, prednisone, thalidomide. Haematologica. 2015;100(6):826-33. [DOI] [PMC free article] [PubMed] [Google Scholar]
- 33.Ramsey S, Willke R, Briggs A, et al. Good research practices for cost-effectiveness analysis alongside clinical trials: the ISPOR RCT-CEA Task Force report. Value Health. 2005;8(5):521-33. [DOI] [PubMed] [Google Scholar]