

Abstract
BACKGROUND:
In patients with acute coronary syndrome (ACS) treated with percutaneous coronary intervention (PCI), newer antiplatelet agents prasugrel and ticagrelor have lower rates of cardiovascular events when compared with clopidogrel. However, it is unclear whether there are differences in economic outcomes when comparing these agents in ACS-PCI patients.
OBJECTIVE:
To assess aggregated costs and medical resource utilization among ACS-PCI patients prescribed prasugrel, ticagrelor, or generic clopidogrel, using a large commercial insurance claims database.
METHODS:
Costs attributable to any medical and pharmacy service and resource utilization including number of admissions, length of hospital stay, emergency room visits, and office visits over the 180-day postdischarge period were compared. All-cause and cardiovascular health care costs and resource utilization were separately analyzed for patients enrolled in the data over the continuous follow-up (CFU) period, and for patients continuously taking their initial treatment for 6 months (CTX). Potential confounders collected over a 6-month baseline assessment period were controlled for, using a generalized linear model.
RESULTS:
Over the 180-day follow-up, prasugrel and ticagrelor patients underwent fewer admissions (rate ratio [RR] = 0.87, 95% CI = 0.80-0.95) from CFU and RR = 0.81, 95% CI = 0.71-0.89 from CTX) compared with clopidogrel patients. The newer agent cohort incurred more overall health care costs than the generic clopidogrel group, with added costs of $957 (95% CI = $236-$1,725) in the CFU group and $1,122 (95% CI = $455-$1,865) in the CTX group, which were smaller than the increase in all-cause outpatient pharmacy costs associated with the newer agents versus clopidogrel (CFU: $1,175, 95% CI = $1,079-$1,278 and CTX: $1,360, 95% CI = $1,256-$1,487). Overall, there was no statistically significant difference in the economic outcomes associated with prasugrel and ticagrelor. There were, however, significant correlations between all-cause and cardiovascular-related outcomes.
CONCLUSIONS:
The higher price of prasugrel and ticagrelor was partially offset by a decrease in hospital admission compared with generic clopidogrel over a 6-month postdischarge period. Aggregated medical costs and resource utilization were not significantly different between prasugrel and ticagrelor patients.
What is already known about this subject
Antiplatelet therapy is an effective first-line treatment to prevent patients with acute coronary syndrome (ACS) from atherothrombotic complications.
Prasugrel and ticagrelor, compared with clopidogrel, are associated with fewer major adverse cardiovascular events in patients with ACS after percutaneous coronary intervention (PCI), which has been confirmed by pivotal clinical trials, as well as by retrospective cohort studies.
What this study adds
In patients receiving a PCI for ACS, the initiation of or persistence to prasugrel or ticagrelor, as compared with generic clopidogrel, was associated with a decrease in hospital admissions over a 6-month period.
Lower resource utilization of prasugrel or ticagrelor was attributable to a decrease in cardiovascular-related events.
The higher cost of the newer oral antiplatelet agents prasugrel or ticagrelor was partially offset by savings from lower resource utilization.
Acute coronary syndrome (ACS) is a set of coronary artery disorders including ST-segment elevation myocardial infarction (STEMI), non-ST-segment elevation myocardial infarction, and unstable angina.1 Many patients receive percutaneous coronary intervention (PCI) for treatment of ACS, which is recommended to be followed by a yearlong antiplatelet therapy with a P2Y12 antagonist along with aspirin.2-4 Clopidogrel, a second-generation P2Y12 antagonist, has stood as a gold-standard antiplatelet agent. Since 2009 and 2011, however, 2 third-generation oral antiplatelet agents (OAAs)—prasugrel (2009) and ticagrelor (2011)—have been available in the U.S. health care market.5-10 These newer agents have been shown to reduce the incidence of a composite of myocardial infarction, ischemic stroke, and cardiovascular death compared with clopidogrel, although there has been some evidence of a higher incidence of bleeding.11,12
Previous studies have retrospectively compared clinical outcomes of 3 OAAs in real-world ACS populations using administrative databases.13-15 But there has been limited information regarding economic outcomes in patients managed by OAAs. A recent study compared resource utilization up to 90 days, but because the study relied on a hospital charge master database, the overall interpretation was limited to the inpatient and hospital outpatient settings.16 Another recent study, using the same database as the current study, provided better insight into the real-world outcomes of prasugrel and ticagrelor but did not focus on health care cost estimation from a payer’s perspective.17 Meanwhile, another study analyzed longitudinally collected claims data that followed ACS patients up to a year, but the follow-up period was inconsistent across study subjects.18 Furthermore, this study implicitly assumed that health care utilization was proportional to the length of follow-up, which potentially overestimated the treatment effect on medical costs because a patient with a cardiovascular disorder exhausts more resources during the early phases of follow-up.18-21 Additional analysis of health care costs is warranted, since the price difference between the generic version of clopidogrel and the branded newer agents is claimed as a major obstacle to prescribing prasugrel or ticagrelor.22
To add to these previous studies, aggregated costs and resource utilization associated with the use of prasugrel, ticagrelor, and generic clopidogrel for the treatment of ACS treated with PCI (ACS-PCI) were analyzed in this study, using a nationally collected insurance claims database in which data collection was not limited to a hospital information system or to a single inpatient setting.
Methods
Study Design and Analytic Cohort
A retrospective cohort study was used to assess the effect of using different OAAs on health care resource utilization and costs after a discharge from a PCI for ACS from the perspective of a third-party payer. The study cohort was a subset of the cohort from a previous study9 that was extracted from the Truven Health Analytics MarketScan Databases, which covers medical claims for about 130 million commercially insured individuals in the United States. The use of this de-identified dataset was deemed exempt by a local institutional review board.
Patients included in this study were hospitalized with a primary discharge diagnosis code of ACS (International Classification of Diseases, Ninth Revision, Clinical Modification [ICD-9-CM] codes 410.xx [except 410.x2], 411.1x, and 411.8x) between September 2011 and December 2013. In addition, a patient had to have at least 1 claim of PCI during this index admission to be included in the study cohort, which was determined based on Current Procedure Terminology and ICD-9-CM procedure codes.13,14 The date of discharge from the index admission was considered the index date, and patients continuously enrolled over the 180 days before the index date were eligible to move forward. To be a study subject, a patient had to receive either prasugrel, ticagrelor, or generic clopidogrel for care after the ACS-PCI treatment within 14 days from the date of index discharge, which was determined using National Drug Code numbers and Generic Product Identifiers. To avoid misinterpretation related to any intended OAA switching during the initial postdischarge phase, patients who filled different OAAs during the first 14 days were removed from the analytic cohort.9 We also excluded patients who had a history of PCI or OAA use during the 6-month period before the index admission (Figure 1). Using enrollment information and ICD-9-CM codes, patient age, gender, geographic location, type of health plan, comorbidity, and health care spending were also collected over the 6-month baseline assessment period.13,15,23
FIGURE 1.

Cohort Extraction Flowchart
When examining costs, a small portion of observations with negative costs were identified. However, the specific causes of negative-cost claims were not available from the database. For this reason, patients with a negative reimbursement that was not cancelled out within a day by a claim having the same procedure code were excluded. All costs were inflated to 2015 U.S. dollars using the medical care component of the Consumer Price Index available from the U.S. Bureau of Labor Statistics.24
To account for potential differences in the treatment effect between patients who had been prescribed an antiplatelet agent for care after ACS-PCI and those who maintained their initial OAA, our study used 2 sets of analytic cohorts: (1) the continuous follow-up (CFU) cohort, which included all subjects who started 1 of the OAAs and were continuously enrolled in the data over the 180-day follow-up period regardless of switching or discontinuation of antiplatelet agent, and (2) the continuous treatment (CTX) cohort, which consisted of patients who continued to use the initial antiplatelet agent over the entire study period. Patients were excluded from the CTX cohort if they incurred a medication claim of an antiplatelet agent different from the initial one any time during the 6-month follow-up or if a patient had a 30-day medication gap. Patients who had received branded clopidogrel were excluded from both cohorts.
Baseline
Baseline comparisons were performed for the combined third-generation agents versus generic clopidogrel and for prasugrel versus ticagrelor. Statistical difference in the age distribution across exposure status was evaluated using a Student’s t-test, which was followed by a chi-square test for age group (< 55, 55-64, or ≥ 65 years) across the treatment groups. Nominal variables, including STEMI as an index diagnosis, gender, comorbid conditions, geographic region, and the type of health care plan, were analyzed using frequency tables and chi-square tests. When the expected number of subjects in a cell of a frequency table was ≤ 5, a Fisher’s exact test was used instead of a chi-square test.
For baseline health care cost measures, paid claims over the 180-day baseline assessment period were identified first, and the Consumer Price Index-adjusted gross payments linked to each claim were summed up. Central tendency was presented using a mean and median cost, and the dispersion of the cost in each group was expressed in terms of a standard deviation (SD), as well as minimum and maximum values. A Student’s t-test was performed on the log-transformed baseline cost across the antiplatelet agent groups.
Outcome
The primary goal of this study was to estimate differences in costs and rate ratios (RR) of various categories of health care utilization attributable to the choice of OAA. Aggregated all-cause medical care cost incurred during the 180-day follow-up period in each treatment group was calculated from a gross payment adjudicated to claimed services. Costs incurred at the outpatient pharmacy and in the inpatient setting were separately analyzed in addition to total aggregated cost. Resource utilization outcomes included the number of admissions, the number of emergency room (ER) visits, and the number of office visits. Conditional on hospital admission during the 180-day follow-up period, the number of bed days per patient (i.e., length of stay) was counted.
Health care expenditures attributable to cardiovascular conditions were also analyzed. Cardiovascular expenditures were identified from inpatient and outpatient claims with the ICD-9-CM codes indicating cardiovascular disorders (390.xx-459.xx) at any diagnosis position of a paid claim and pharmacy claims for cardiovascular medications. Prescriptions for cardiovascular drugs were identified based on the therapeutic drug class, including antihyperlipidemic drugs, angiotensin-converting enzyme inhibitors, alpha and/or beta blockers, antiarrhythmic agents, calcium channel blockers, cardiac glycosides, hypotensive agents, natriuretic peptides, sclerosing agents, vasodilating agents, other cardiac drugs, thrombolytic agents, and antiplatelet agents.25 Costs of all cardiovascular medications and OAA prescriptions were separately summarized.
Outcome statistics were described in median, minimum, and maximum values for each treatment group, as well as the mean and SD. Statistical significance of the outcomes across the treatment groups was tested using Student’s t-tests and Mann-Whitney U tests. In order to assess any longitudinal changes in the burden of disease, mean monthly health care costs were also calculated for the 3 treatment groups.
Measures of Treatment Effect on Health Care Costs and Resource Utilization
Incremental costs and resource utilization were estimated for the newer agents versus generic clopidogrel patients, and for prasugrel versus ticagrelor patients. The association between the selection of an OAA and health care cost, controlling for baseline characteristics, was estimated using a generalized linear model (GLM) in which the treatment effects were measured with a gamma error distribution with a log-link function.26 Selection between a GLM and ordinary least square on log-transformed outcomes was in accordance with recommendations by Manning and Mullahy (2001) and Manning et al. (2005).27,28 Resource utilization data were analyzed using a GLM with a zero-inflated negative binomial distribution to account for the overdispersed data, with a significant portion of zero from the aggregated resource use.29,30 The GLMs controlled for baseline health care cost, demographics, and comorbidity, whose P value for the difference in distributions across the treatment strategy was less than 0.1.
To determine statistical significance, 95% confidence intervals (CI) of the measures were determined from 500 bootstrap samples and a percentile approach.31 The resampling was stratified by the treatment, which maintained the same number of subjects and degrees of freedom in each group across all the bootstrap samples. To describe the influence of cardiovascular events on the all-cause outcomes, coefficients of determination correlating the treatment effect for all-cause outcomes to the estimated effect for cardiovascular-related outcomes were used. The analyses were performed using SAS version 9.4 (SAS Institute, Cary, NC).
Matched Cohort Analysis
In order to account for the uncertainty in the selection of a statistical approach controlling for potential confounders, the measures of treatment effect were tested again in matched cohorts. The first step was to match ticagrelor patients to prasugrel patients. A propensity score of being treated with ticagrelor with given baseline characteristics was calculated from a logistic regression model, where the variable selection was performed using a forward stepwise model selection process with a P value of 0.1 for the covariate entering and remaining. This first step matched a ticagrelor patient to 3 prasugrel patients, using a greedy matching algorithm with a range of 0.2 times the pooled SD of the logit of the propensity score.
The second step of the matching was performed between the matched newer agent cohort and the clopidogrel group with the same statistical approach, but the ratio of matching for a newer agent to clopidogrel was 1:1. Hence, by the end, the matched analytic cohort coupled 1 ticagrelor patient with 3 prasugrel patients and 4 clopidogrel patients. The matching was separately performed for the CFU and CTX cohorts, and effect measures in both matched cohorts were adjusted for any residual confounders. In a bootstrap sampling for 95% CI estimation, a cluster of 3 prasugrel and 4 clopidogrel patients matched with 1 ticagrelor patient was sampled from each random selection to maximize the benefits of the propensity score approach (Figure 1).
Sample Size
Assuming 75% of the ACS-PCI-OAA population received clopidogrel, and half of the clopidogrel patients were prescribed with a generic, our study required 12,622 patients to have 80% power to detect the relative incidence rate of 0.8, given the rate in the reference cohort (i.e., generic clopidogrel group) of 0.2 over the 6 months.9 This sample size calculation was performed using STATA version 12.0 (StataCorp, College Station, TX).
Results
Baseline
The CFU cohort consisted of 8,246 generic clopidogrel, 6,630 prasugrel, and 1,287 ticagrelor patients. Of the subjects in the CFU cohort, 6,353 clopidogrel, 4,810 prasugrel, and 873 ticagrelor patients (P < 0.05, log-rank test), who constituted the CTX cohort, continued their initial antiplatelet regimen over the 6 months. Of the patients in the CFU cohort, clopidogrel patients were significantly older (mean ± SD, 62.3 ± 12.6 years) and had a lower proportion of males (71.5%) than prasugrel (56.0 ± 9.1 years, 80.3% male) and ticagrelor (58.7 ± 11.3 years, 74.7% male) users. The age and gender distributions in the CTX cohort were similar to those from the CFU cohort. Compared with the new agents, the clopidogrel group showed a higher prevalence of comorbid conditions. Limiting the comparison to the newer agents, the ticagrelor cohort was older and had a larger proportion of patients with a cerebrovascular event, congestive heart failure, cancer, renal disorder, and substance abuse than the prasugrel group. Differences in geographic region and the types of health care plans held by the patients were also statistically significant. Differences in patient characteristics across the 3 treatment groups were similarly observed in the CFU and CTX cohorts (Table 1).
TABLE 1.
Baseline Characteristics
| CFU Cohort | CTX Cohort | |||||||||
|---|---|---|---|---|---|---|---|---|---|---|
| Clopidogrel (n = 8,246) | Prasugrel (n = 6,630) | Ticagrelor (n = 1,287) | Clopidogrel (n = 6,353) | Prasugrel (n = 4,810) | Ticagrelor (n = 873) | |||||
| Baseline cost (USD) | ||||||||||
| Mean (SD) | 8,771 (22,863) | a | 7,315 (17,503) | b | 7,856 (13,624) | 8,235 (21,298) | a | 6,342 (13,623) | b | 6,814 (18,828) |
| Median (Minimum-maximum) | 3,221 (0-1,016,574) | 3,097 (0-880,264) | 3,943 (0-335,311) | 3,149 (0-1,016,574) | 2,531 (0-312,866) | 2,638 (0-335,311) | ||||
| Male | 5,896 (71.5) | a | 5,321 (80.3) | b | 961 (74.7) | 4,542 (71.5) | a | 3,882 (80.71) | b | 665 (76.17) |
| Age, years (mean ± SD) | 62.3 (12.6) | a | 56.0 (9.1) | b | 58.7 (11.3) | 61.9 (12.4) | a | 56.0 (9.0) | b | 58.7 (11.1) |
| Age groups, n (%) | ||||||||||
| ≥ 65 | 3,118 (37.8) | a | 1,020 (15.4) | b | 310 (24.1) | 2,314 (36.4) | a | 722 (15.0) | b | 207 (23.7) |
| 55-64 | 2,939 (35.6) | 2,933 (44.2) | 527 (41.0) | 2,294 (36.1) | 2,148 (44.7) | 268 (42.2) | ||||
| < 55 | 2,189 (26.5) | 2,677 (40.4) | 450 (35.0) | 1,745 (27.5) | 1,940 (40.3) | 298 (34.1) | ||||
| Diagnosis: STEMI, n (%) | 3,879 (47.0) | a | 3,795 (57.2) | 708 (55.0) | 3,047 (48.0) | a | 2,789 (58.0) | 482 (55.2) | ||
| Comorbid conditions, n (%) | ||||||||||
| CABG | 58 (0.7) | a | 28 (0.4) | b | 7 (0.5) | 63 (0.5) | 21 (0.4) | 3 (0.3) | ||
| CHF | 1,384 (16.8) | a | 720 (10.1) | b | 160 (12.4) | 2,003 (15.3) | a | 496 (10.31) | b | 115 (13.17) |
| Cerebrovascular events | 642 (7.8) | a | 204 (3.1) | b | 72 (5.6) | 889 (6.8) | a | 144 (3.0) | b | 44 (5.0) |
| IS | 152 (1.8) | a | 32 (0.5) | b | 12 (0.9) | 196 (1.5) | a | 22 (0.46) | 5 (0.57) | |
| ICH | 26 (0.3) | a | 2 (0.03) | b | 6 (0.5) | 32 (0.24) | a | 1 (0.02) | 1 (0.1) | |
| TIA | 104 (1.3) | a | 33 (0.5) | 11 (0.9) | 147 (1.1) | a | 23 (0.5) | 8 (0.9) | ||
| Otherc | 515 (6.2) | a | 155 (2.3) | b | 59 (4.6) | 720 (5.5) | a | 110 (2.3) | b | 41 (4.7) |
| DM | 2,209 (26.8) | a | 1,666 (25.1) | 325 (25.3) | 3,324 (25.4) | a | 1,145 (23.8) | 220 (25.2) | ||
| DM with complication | 454 (5.5) | a | 272 (4.1) | 53 (4.1) | 667 (5.1) | a | 184 (3.8) | 39 (4.5) | ||
| Pulmonary disorder | 251 (3.0) | a | 123 (1.9) | 26 (2.0) | 368 (2.8) | a | 90 (1.9) | 16 (1.8) | ||
| Dementia | 53 (0.6) | a | 7 (0.1) | d | 4 (0.3) | 61 (0.5) | a | 4 (0.08) | 2 (0.23) | |
| Dyslipidemia | 4,912 (58.6) | 3,981 (60.0) | 756 (58.7) | 7,755 (59.3) | 2,896 (60.2) | 517 (59.2) | ||||
| ECH (including peptic ulcer) | 651 (7.9) | a | 362 (5.5) | 74 (5.7) | 963 (7.4) | a | 253 (5.3) | 50 (5.7) | ||
| Peptic ulcer | 31 (0.38) | a | 9 (0.14) | 2 (0.16) | a | |||||
| HIV | 21 (0.3) | e | 28 (0.4) | 4 (0.3) | 34 (0.3) | 20 (0.4) | 4 (0.5) | |||
| Para or hemiplegia | 44 (0.5) | a | 8 (0.1) | b | 5 (0.4) | 56 (0.4) | a | 6 (0.12) | 2 (0.23) | |
| Hypertension | 5,163 (62.6) | a | 3,810 (57.5) | 743 (57.7) | 7,972 (60.9) | a | 2,734 (56.8) | 510 (58.4) | ||
| Liver disorder | 230 (2.8) | 174 (2.6) | 28 (2.2) | 345 (2.64) | 118 (2.5) | 17 (1.9) | ||||
| Cancer (incl. metastasis) | 507 (6.1) | a | 255 (3.8) | b | 67 (5.2) | 723 (5.5) | a | 182 (3.8) | b | 45 (5.2) |
| Metastatic tumor | 31 (0.4) | a | 10 (0.2) | 4 (0.3) | 39 (0.3) | a | 4 (0.1) | 1 (0.1) | ||
| MI | 857 (10.4) | a | 546 (8.2) | 95 (7.4) | 1,268 (9.7) | a | 380 (7.9) | 61 (7.0) | ||
| Renal disorder | 870 (10.6) | a | 379 (5.7) | b | 105 (8.2) | 1,214 (9.3) | a | 256 (5.3) | b | 67 (7.0) |
| Rheumatoid arthritis | 197 (2.4) | a | 123 (1.9) | 26 (2.0) | 315 (2.4) | e | 99 (2.1) | 15 (1.7) | ||
| Substance abuse | 1,707 (20.7) | a | 1,598 (24.1) | b | 246 (19.1) | 2,789 (21.3) | a | 1,162 (24.2) | b | 155 (17.8) |
| Enrolled in Medicare, n (%) | 3,129 (37.9) | a | 1,013 (15.3) | b | 310 (24.1) | 2,324 (36.6) | a | 715 (14.9) | b | 207 (23.7) |
| Health plan, n (%) | ||||||||||
| PPO | 4,394 (53.3) | a | 3,971 (59.9) | 745 (57.9) | 7,722 (55.2) | a | 2,884 (60.0) | 515 (59.0) | ||
| HMO | 1,101 (13.4) | 728 (11.0) | 156 (12.1) | 1,746 (13.3) | 534 (11.1) | 107 (12.3) | ||||
| Comprehensive | 1,551 (18.8) | 656 (9.9) | 149 (11.6) | 2,038 (15.9) | 461 (9.6) | 95 (10.9) | ||||
| Other | 1,200 (14.6) | 1,275 (19.2) | 237 (18.4) | 2,037 (15.4) | 931 (19.4) | 156 (17.9) | ||||
| Region, n (%) | ||||||||||
| Northeast | 1,608 (19.5) | a | 1,139 (17.2) | 269 (20.9) | 2,709 (20.7) | a | 850 (17.7) | b | 187 (21.4) | |
| North Central | 2,455 (29.8) | 1,715 (25.8) | 314 (24.4) | 3,786 (28.9) | 1,251 (26.0) | 231 (26.5) | ||||
| South | 2,583 (31.3) | 2,581 (38.9) | 353 (43.0) | 4,172 (31.8) | 1,836 (38.2) | 355 (40.7) | ||||
| West | 1,506 (18.3) | 1,077 (16.2) | 141 (11.0) | 2,257 (17.2) | 790 (16.4) | 92 (10.5) | ||||
| Other | 94 (1.1) | 118 (1.8) | 10 (0.8) | 164 (1.3) | 83 (1.73) | 8 (0.9) | ||||
Note: Fisher’s exact test was performed when an expected number of events in each group was less than 5. Baseline cost comparisons were performed using Student’s t-tests for log-transformed values.
aThird-generation agent vs. clopidogrel, P < 0.05.
bTicagrelor vs. prasugrel, P < 0.05.
cOther = cerebrovascular events not classfied as IS, ICH, or TIA.
dTicagrelor vs. prasugrel, P < 0.1.
eThird-generation agent vs. clopidogrel, P < 0.1.
CABG = coronary artery bypass graft; CFU = continuous follow-up; CHF = congestive heart failure; CTX = continuous treatment; DM = diabetes mellitus; ECH = extracerebral hemorrhage; HIV = human immunodeficiency virus; HMO = health maintenance organization; ICH = intracerebral hemorrhage; IS = ischemic stroke; MI = myocardial infarction; PPO = preferred provider organization; STEMI = ST-segment elevation myocardial infarction; SD = standard deviation; TIA = transient ischemic attack; USD = U.S. dollars.
Outcomes, Descriptive Statistics, and Crude Comparisons
In the CFU cohort, the mean total 6-month health care costs were similar across the 3 treatment groups ($16,718, $16,409, and $16,998 for clopidogrel, prasugrel, and ticagrelor, respectively), but the median overall health care costs were lower in patients who initiated generic clopidogrel ($6,426) in reference to the newer agents ($7,663 for prasugrel and $8,553 for ticagrelor), and the differences were significant (P < 0.01). In the CTX cohort, the order across the treatment groups and the statistical significance were similar to the results from the CFU cohort (Table 2). In all 3 antiplatelet agent cohorts, patients exhausted a large portion of health care costs during the early phase of the follow-up period (Figure 2).
TABLE 2.
Descriptive Statistics of Cost and Health Care Utilization
| Mean (SD) Median (Range) | CFU Cohort | CTX Cohort | ||||||||
|---|---|---|---|---|---|---|---|---|---|---|
| Clopidogrel | Prasugrel | Ticagrelor | Clopidogrel | Prasugrel | Ticagrelor | |||||
| All-cause medical cost ($) | ||||||||||
| Totala | 16,718 (35,522) | 16,409 (29,345) | 16,998 (27,100) | 14,857 (31,951) | 14,927 (25,056) | 14,998 (19,930) | ||||
| 6,426 (9-1,394,303) | b | 7,663 (0-697,239) | c | 8,533 (361-314,748) | 6,148 (232-1,394,303) | b | 7,715 (81-697,239) | c | 8,577 (361-240,500) | |
| Pharmacy | 1,910 (3,281) | b | 2,980 (2,693) | c | 3,172 (3,259) | 1,863 (3,335) | b | 3,203 (0-41,194) | c | 3,443 (0-62,463) |
| 1,076 (0-139,457) | b | 2,402 (0-48,575) | c | 2,522 (0-62,463) | 1,078 (0-139,457) | b | 2,667 (0-41,194) | c | 2,690 (0-62,463) | |
| Inpatient | 5,614 (25,763) | b | 4,736 (22,077) | 4,564 (17,605) | 4,349 (24,045) | b | 3,322 (18,100) | 2,913 (10,878) | ||
| 0 (0-1,372,203) | b | 0 (0-657,273) | 0 (0-273,183) | 0 (0-1,372,203) | b | 0 (0-657,273) | 0 (0-85,776) | |||
| All-cause resource utilization (count) | ||||||||||
| Admission | 0.22 (0.59) | b | 0.17 (0.49) | 0.18 (0.52) | 0.18 (0.51) | b | 0.13 (0.41) | 0.13 (0.42) | ||
| 0 (0-9) | b | 0 (0-7) | 0 (0-5) | 0 (0-9) | b | 0 (0-6) | 0 (0-4) | |||
| LOSd | 5.58 (6.82) | e | 4.93 (5.77) | c | 5.96 (6.90) | 4.70 (4.97) | b | 4.06 (4.34) | 4.60 (3-34) | |
| 4 (1-80) | b | 3 (1-75) | c | 4 (1-52) | 3 (1-62) | b | 3 (1-40) | c | 4 (1-16) | |
| ER visit | 0.39 (0.82) | b | 0.33 (0.72) | c | 0.38 (0.77) | 0.36 (0.75) | b | 0.29 (0.65) | 0.33 (0.66) | |
| 0 (0-13) | b | 0 (0-9) | c | 0 (0-8) | 0 (0-9) | b | 0 (0-6) | c | 0 (0-6) | |
| Office visit | 6.19 (4.77) | b | 5.46 (3.53) | c | 5.93 (4.02) | 6.12 (4.63) | b | 5.38 (3.43) | c | 5.88 (3.87) |
| 5 (0-164) | b | 5 (0-34) | c | 5 (0-31) | 5 (0-164) | b | 5 (0-34) | c | 5 (0-28) | |
| CV medical cost ($) | ||||||||||
| CV total | 14,318 (32,310) | 14,457 (26,434) | 14,776 (22,329) | 12,990 (30,206) | 13,343 (22,935) | 13,440 (18,689) | ||||
| 5,262 (0-1,363,506) | b | 6,569 (0-696,695) | c | 7,322 (361-237,516) | 5,094 (130-1,363,506) | b | 6,619 (81-696,694) | c | 7,433 (361-237,516) | |
| CV medication | 801 (1,604) | b | 2,015 (924) | c | 2,105 (870) | 829 (1,789) | b | 2,216 (763) | c | 2,347 (762) |
| 607 (0-135,396) | b | 1,950 (0-22,060) | c | 2,031 (0-7,976) | 639 (0-135,396) | b | 2,121 (0-8,494) | c | 2,184 (0-7,976) | |
| OAA | 279 (223) | b | 1,303 (450) | c | 1,461 (492) | 283 (168) | b | 1,462 (321) | c | 1,667 (305) |
| 242 (0-2,829) | b | 1,375 (0-2,193) | c | 1,565 (0-3,143) | 268 (0-2,017) | b | 1,483 (0-2,656) | c | 1,623 (0-2,694) | |
| CV inpatient | 4,330 (23,185) | e | 3,784 (18,657) | 3,446 (12,855) | 3,521 (22,867) | b | 2,733 (16,290) | 2,459 (9,877) | ||
| 0 (0-1,344,966) | b | 0 (0-675,273) | 0 (0-108,916) | 0 (0-1,344,966) | b | 0 (0-657,273) | 0 (0-85,776) | |||
| CV resource utilization (count) | ||||||||||
| Admission | 0.21 (0.56) | b | 0.16 (0.48) | 0.17 (0.50) | 0.18 (0.50) | b | 0.13 (0.40) | 0.13 (0.40) | ||
| 0 (0-9) | b | 0 (0-7) | 0 (0-5) | 0 (0-9) | b | 0 (0-5) | 0 (0-4) | |||
| LOSf | 5.45 (6.59) | e | 4.85 (5.70) | g | 5.83 (6.24) | 4.63 (4.96) | b | 3.92 (4.21) | 4.51 (3.26) | |
| 3 (1-80) | b | 3 (1-75) | c | 4 (1-52) | 3 (1-62) | b | 3 (1-40) | c | 3.5 (1-16) | |
| ER visit | 0.05 (0.23) | b | 0.03 (0.19) | 0.04 (0.20) | 0.04 (0.21) | b | 0.03 (0.18) | 0.03 (0.19) | ||
| 0 (0-3) | b | 0 (0-2) | 0 (0-2) | 0 (0-3) | b | 0 (0-2) | 0 (0-2) | |||
| Office visit | 2.98 (1.79) | b | 2.92 (1.68) | 2.93 (1.68) | 2.98 (1.78) | b | 2.91 (1.65) | 2.94 (1.63) | ||
| 3 (0-17) | 3 (0-15) | 3 (0-12) | 3 (0-16) | e | 3 (0-15) | 3 (0-11) | ||||
Note: The Student’s t-test was used for parametric approach (mean), and the Mann-Whitney U test was used for nonparametric approach (median).
aTotal health care cost consisted of inpatient, outpatient (or ER), and outpatient pharmacy costs.
bThird-generation agent vs. clopidogrel, P < 0.05.
cTicagrelor vs. prasugrel, P < 0.05.
dLength of hospital stay per patient who had at least 1 hospital admission.
eThird-generation agent vs. clopidogrel, P < 0.1.
fLength of hospital stay with CV admission per patient who had at least 1 hospital admission with a diagnosis of a CV condition.
gTicagrelor vs. prasugrel, P < 0.1.
CFU = continuous follow-up; CTX = continuous treatment; CV = cardiovascular; ER = emergency room; LOS = length of stay; OAA = oral antiplatelet agent; SD = standard deviation.
FIGURE 2.
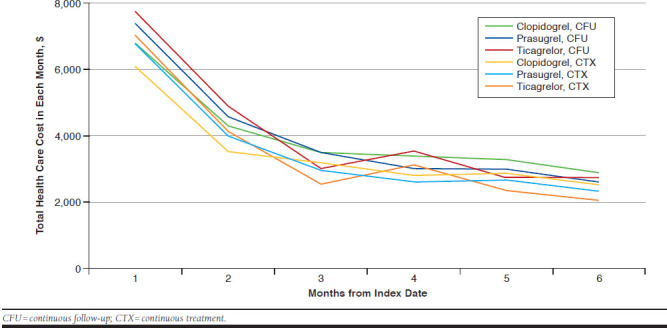
Mean All-Cause Health Care Cost per Patient by Month
A large portion of the total costs were attributable to cardiovascular conditions, with around 87% of the medical expenditure related to a treatment adjudicated with diagnosis of a cardiovascular disorder. Average outpatient pharmacy costs were significantly (P < 0.01) lower in clopidogrel patients ($1,910 in the CFU and $1,863 in the CTX cohorts) than in prasugrel ($2,980 in the CFU and $3,204 in the CTX cohorts) and ticagrelor ($3,172 in the CFU and $3,444 in the CTX cohorts) users. By limiting the analysis to third-generation OAAs, average total pharmacy cost was higher in the ticagrelor group than the prasugrel cohort. Contrary to outpatient pharmacy costs, mean and median costs of inpatient service from the generic clopidogrel cohort were significantly (P < 0.01) higher than the newer agent cohort. Differences in medication costs and their statistical significances were similarly observed when the analyses were limited to cardiovascular medications and OAAs (Table 2).
The descriptive analysis showed that patients treated with clopidogrel used more resources compared with those treated with the newer agents. The mean number of admissions across 6 months of clopidogrel users in the CFU cohort was 0.22, which was significantly (P < 0.01) higher than the numbers of prasugrel (0.17) or ticagrelor (0.18) users. Among hospitalized patients, clopidogrel users stayed in the hospital 0.6 days longer than patients treated with 1 of the newer agents over the 6 months (P < 0.05). The clopidogrel group also encountered more ER visits (0.40 vs. 0.34, P < 0.01) and more office visits (6.13 vs. 5.54, P < 0.01) than the newer agent group. The mean numbers of ER visits, office visits, and length of hospital stay were larger in the ticagrelor than the prasugrel group. More than 90% of hospital admissions were associated with diagnosis of a cardiovascular condition. Results from the descriptive analyses for resource utilization in the CTX cohort were similar to those in the CFU cohort (Table 2).
Measures of Treatment Effect from GLM Controlling for Potential Confounders
Initiation and continuation of either prasugrel or ticagrelor were associated with a significant increase in overall medical costs over the 6 months compared with clopidogrel, with the incremental cost estimates of $957 (95% CI = 236-1,725] from the CFU cohort and $1,122 (95% CI = 455-1,865] from the CTX cohort. Essentially, increases in the overall costs were attributable to the difference in pharmacy costs for the newer medication versus generic clopidogrel ($1,175, 95% CI = 1,079-1,278 from the CFU cohort and $1,360, 95% CI = 1,256-1,487 from the CTX cohort). Average increase in the total aggregated cost between third-generation agents versus generic clopidogrel was significantly less (P < 0.01), Student’s t-test than that of pharmacy cost.
All-cause hospital admissions were significantly lowered with the use of newer agents compared with generic clopidogrel over 6 months, with RRs of 0.87 (95% CI = 0.80-0.95] in the CFU cohort and 0.81 (95% CI = 0.71-0.89) in the CTX cohort. Prasugrel or ticagrelor was likely associated with a decrease in the length of hospital stay per admitted patient in reference to the generic clopidogrel, but the estimates were not statistically significant (RR = 0.97, 95% CI = 0.89-1.06 from the CFU cohort and RR = 0.92, 95% CI = 0.83-1.01 from the CTX cohort). The estimated cost of inpatient service was less in the newer agent group than the clopidogrel group, with the differences of -$453 (95% CI = -1,070-73) in the CFU cohort and -$974 (95% CI = -1,046, -108 in the CTX cohort based on the GLM. The regressions also showed significant reduction in the rate of ER (0.92, 95% CI = 0.87-0.99) and office (0.98, 95% C = 0.96-1.00) visits for the use of newer agents versus clopidogrel in the CTX cohort, although they were not significant in the CFU cohort. Measures of the treatment effect between prasugrel and ticagrelor on all-cause resource utilization or health care costs were not significant in the CFU and CTX cohorts, except the RR estimates of all-cause ER visits (1.04, 95% CI = 1.02-1.42; Table 3).
TABLE 3.
Measures of Treatment Effects over 6-Month Follow-Up and Bootstrap 95% CI Estimates: Results from GLMs with a Gamma Error Distribution with a Log-Link Function for Costs, Negative Binomial Model for LOS, and Zero-Inflated Negative Binomial Models for Other Health Care Resource Utilization
| Treatment Effect (95% CI) | CFU Cohort | CTX Cohort | ||
|---|---|---|---|---|
| Newer Agents vs. Generic Clopidogrel | Ticagrelor vs. Prasugrel | Newer Agents vs. Generic Clopidogrel | Ticagrelor vs. Prasugrel | |
| All-cause | ||||
| Δ total cost | 957 (236, 1,725)a | -96 (-1,753, 1,348) | 1,122 (455, 1,865)a | -377 (-1,767, 1,022) |
| Δ pharmacy cost | 1,175 (1,079, 1,278)a | 62 (-72, 208) | 1,360 (1,256, 1,487)a | 120 (-22, 271) |
| Δ inpatient service cost | -453 (-1,070, 73) | -257 (-1,921, 1,060) | -974 (-1,460, -108)a | -452 (-1,806, 929) |
| RR of admission | 0.87 (0.80, 0.95)a | 1.02 (0.83, 1.19) | 0.81 (0.71, 0.89)a | 1.02 (0.78, 1.20) |
| RR of LOSb | 0.97 (0.89, 1.06) | 1.13 (0.93, 1.33) | 0.92 (0.83, 1.01) | 1.15 (0.96, 1.36) |
| RR of ER visits | 0.97 (0.92, 1.03) | 1.09 (0.99, 1.33) | 0.92 (0.87, 0.99)a | 1.04 (1.02, 1.42) |
| RR of office visits | 0.99 (0.98, 1.01) | 1.03 (0.87, 1.21) | 0.98 (0.96, 1.00)a | 1.04 (1.00, 1.09) |
| Cardiovascular events/services | ||||
| Δ CV total cost | 959 (311, 1,645)a | 33 (-1,330, 1,257) | 1,120 (508, 1,804)a | -119 (-1,596, 862) |
| Δ CV pharmacy cost | 1,342 (1,284, 1,406)a | 77 (24, 137)a | 1,505 (1,448, 1,581)a | 110 (52, 165)a |
| Δ pharmacy cost, OAA only | 1,205 (1,161, 1,250)a | 158 (131, 186)a | 1,359 (1,315, 1,404)a | 200 (180, 226)a |
| Δ CV inpatient service cost | -484 (-1,042, -21)a | 18 (-1,298, 920) | -678 (-1,303, -103)a | 360 (-1,226, 1,295) |
| RR of admission | 0.88 (0.81, 0.96)a | 0.99 (0.83, 1.19) | 0.81 (0.71, 0.90)a | 0.93 (0.76, 1.17) |
| RR of LOSc | 0.98 (0.89, 1.07) | 1.13 (0.93, 1.32) | 0.91 (0.82, 1.01) | 1.17 (0.98, 1.38) |
| RR of ER visits | 1.03 (0.87, 1.18) | 1.03 (0.65, 1.43) | 1.06 (0.87, 1.23) | 1.05 (0.61, 1.41) |
| RR of office visits | 1.01 (0.99, 1.03) | 0.99 (0.91, 1.09) | 1.00 (0.98, 1.02) | 1.00 (0.96, 1.03) |
aEstimates for which 95% CIs do not include the null.
bLOS per patient who had at least 1 hospital admission.
cLOS with CV admission per patient who had at least 1 hospital admission with a diagnosis of a CV event.
Δ = difference estimate in U.S. dollars; CFU = continuous follow-up; CI = confidence interval; CTX = continuous treatment; CV = cardiovascular; GLM = generalized linear model; LOS = length of hospital stay; OAA = oral antiplatelet agent; RR = rate ratio.
Medical encounters in both in- and outpatient settings for a diagnosis of cardiovascular condition and cardiovascular medication were a large portion of the all-cause outcomes. Similar to the results from the analysis for the all-cause outcomes, treatment effects on health care costs associated with a cardiovascular event were significant in all comparisons, and rate of cardiovascular admission over the 6-month period significantly decreased with the use of prasugrel and ticagrelor compared with clopidogrel (RR = 0.88, 95% CI = 0.81-0.96 in the CFU cohort and RR = 0.81, 95% CI = 0.71-0.90 in the CTX cohort). The cost of outpatient pharmacy services for cardiovascular medications was disproportionately higher in the newer agent group compared with the clopidogrel patients. Limiting the analyses to the third-generation OAAs, the 6-month cardiovascular medication and P2Y12 antagonist costs were higher in the ticagrelor group, compared with the prasugrel group in the CFU and CTX cohorts (Table 3). Overall, cardiovascular encounters largely contributed to the differences in all-cause resource utilization and health care costs, with strong and significant coefficients of determination (P < 0.01, data not shown).
Matched Cohort Analysis
The total number of subjects was 9,568 in the CFU cohort and 6,704 in the CTX cohort, and the matched cohorts consisted of 12.5% ticagrelor, 37.5% prasugrel, and 50% clopidogrel users. Baseline characteristics across 3 matched antiplatelet agent groups were very similar to each other. Significant or marginally significant differences in the distribution of age groups, cerebrovascular disorder, and liver disorder were observed even after matching, but the dissimilarities were nominal and further adjusted for in GLM. Overall, measure-of-association estimates from the matched cohort analysis were very similar to the nonmatched analyses. Because of the decrease in the sample size and the number of outcomes, however, statistical significance for the measures of association did not continue in all the bootstrap estimates from the matched cohort (Appendices A and B, available in online article)
Discussion
Our study demonstrated an association of the selection of oral P2Y12 antagonist with economic outcomes over a 6-month post-discharge period, specifically between third-generation OAAs and clopidogrel. There was a significant increase in overall outpatient pharmacy expenditures with the use of the newer agents, which was essentially because the costs of the new agents were higher. Health care costs incurred by all-cause and by cardiovascular encounters were significantly higher in patients initiated or continued on either prasugrel or ticagrelor compared with generic clopidogrel. However, because of the savings in the number of hospital admissions, the incremental costs associated with the use of third-generation agents were lower than the differences seen in antiplatelet prescription costs.
Less frequent ER and office visits were observed in the newer agents group compared with generic clopidogrel, but the estimates were not significant or clinically meaningful in general. Overall, the results suggest that the increase in drug costs compared with generic clopidogrel is partially offset by decreased health care utilization with the use of prasugrel or ticagrelor, specifically the number of admissions and services provided at inpatient settings, but these did not completely counterbalance the increase in pharmacy costs. Our results are consistent with a recent model-based study that found that costs associated with an inpatient service were lower in patients receiving ticagrelor, but that decrease did not make up for the increase in the cost of medication in comparison with the clopidogrel group.32
When we examined economic outcomes between the 2 new agents, although most of the estimates were not significant, the estimated resource utilization was higher in the patients treated with ticagrelor compared with the prasugrel patients. Overall, this finding is consistent with results from another recently published resource utilization study, which showed an increased risk of medical encounters over 30 and 90 days after ACS-PCI discharge for ticagrelor compared with prasugrel.16 Our study found no significant difference in the number of admissions, which is also comparable to Simeone et al.’s (2015) recent publication where per-patient-per-month numbers of admission in prasugrel and ticagrelor users were very close to each other.18 However, considering the weak and statistically insignificant effects due to wide 95% CI estimates, data need to be collected over greater numbers of patients to know if there are meaningful differences between the 2 newer agents.
To the best of our knowledge, this is the first study that covers the 3 OAAs commonly used for PCI-treated ACS and includes all sources of encounters from a payer’s perspective in the analysis. Furthermore, this study includes statistical tests performed in matched and nonmatched cohorts. These strategies produced similar results, although the matched cohort analyses lost statistical significance for some estimates, suggesting that different statistical approaches to control for potential confounders did not influence the final conclusions.
One strength of this study was the inclusion of multiple cohorts. Of the patients enrolled in the initial health care plan over the 6-month study period, the percentage of patients who continued their initial antiplatelet agent for the 6-month follow-up was lower in the ticagrelor cohort than in the prasugrel or generic clopidogrel cohorts. Potential reasons for the differences in the discontinuation include clinical needs, high cost of the new agents, and side effects not captured by insurance claims. Compared with the CFU cohort, lower health care cost and resource utilization in the CTX cohort generally suggests that adhering to initial treatment lowers the cost of post-ACS management. Unfortunately, insurance claims database information cannot explain the reason for switching or discontinuing the initial OAA treatment. Nevertheless, by including the CFU and CTX cohorts, our study helped preclude this issue from causing systematic changes in outcome estimates. Estimated outcomes and 95% CIs from both cohorts were comparable, suggesting that the conclusions on the incremental cost and health care utilization were robust regardless of the continuation of the initial strategy.
Our findings should assist health care delivery systems. So far, there have been limited investigations into the economics of OAAs, potentially leading to continued use of clopidogrel over the costlier alternatives. In fact, recent investigations have found that current practice for patients with ACS-PCI still favor clopidogrel.9,10 From these longitudinal analyses, it is surmised that the high cost of new medications combined with limited investigation of the outcomes during the postdischarge period served as a barrier. Our study demonstrated that increase in drug costs were not completely offset by the decrease in medical resource utilization. However, the value of savings in medical encounters, specifically hospital admissions, should be taken into account for better optimization of care plans, as well as for value-based contracts.
Limitations
Any interpretation of our findings should be accompanied by consideration of several study limitations. First, our study did not include subjects who discontinued their initial enrolled health care plan, which is a potential source of immortal time bias. For this reason, expected costs and health care utilization in all patients at the beginning of the treatment could not be projected. However, because the dropout rate did not differ across the drugs, it is likely that the influence of this incomplete follow-up did not differ by treatment.
Second, patient follow-up went for 6 months, which was half of the length for OAA use recommended by clinical guide-lines.33 Nevertheless, considering that the majority of health care resource use tends to be incurred during the early phase of the postdischarge period, the insight into the economics of OAAs from our study is informative.19,21
Third, the study design was limited to insurance claims data. As such, we were subject to general limitations found in retrospective studies, such as the potential for miscoding, unmeasured confounders, and selection bias. Finally, as previously discussed, issues related to switching and discontinuation need to be investigated further.
Conclusions
The use of a third-generation antiplatelet agent was associated with a reduction in health care resource utilization, including hospital admissions and length of hospital stay, over a 6-month postdischarge period. The decrease in hospital costs offset a large portion of the difference but did not fully counterbalance the difference in the drug costs between the newer agents and generic clopidogrel. Although resource utilization outcomes slightly favored prasugrel over ticagrelor from the descriptive and bivariate analyses, further data collection should be performed to allow for robust and precise estimates comparing outcomes of the 2 newer agents.
APPENDIX A. Results from Matched Cohort Analysis: Baseline Characteristics
| Matched CFU | Matched CTX | |||||||||
|---|---|---|---|---|---|---|---|---|---|---|
| Clopidogrel (N = 4,784) | Prasugrel (N = 3,588) | Ticagrelor (N = 1,196) | Clopidogrel (N = 3,352) | Prasugrel (N = 2,514) | Ticagrelor (N = 838) | |||||
| Baseline cost (USD) | ||||||||||
| Mean (SD) | 8,005 (19,563) | 7,071 (21,668) | 7,355 (18,890) | 7,674 (23,292) | 6,827 (15,240) | 6,731 (19,068) | ||||
| Median (Minimum-maximum) | 2,865 (0-418,349) | 2,694 (0-880,264) | 2,710 (0-335,311) | 2,801 (0-1,016,574) | 2,622 (0-312,865) | 2,665 (0-335,311) | ||||
| Male | 3,665 (76.6) | 2,746 (76.5) | 903 (75.5) | 2,554 (76.2) | 1,925 (76.6) | 645 (77.0) | ||||
| Age, years (mean ± SD) | 58.6 (11.4) | a | 57.4 (9.5) | b | 58.5 (11.2) | 58.4 (11.2) | 57.2 (9.5) | b | 58.2 (10.9) | |
| Age group, n (%) | ||||||||||
| ≥ 65 | 1,086 (22.7) | 803 (22.4) | 277 (23.2) | 735 (21.9) | 563 (22.4) | 179 (21.4) | ||||
| 55-64 | 1,998 (41.8) | 1,477 (41.2) | 497 (41.6) | 1,410 (42.1) | 1,029 (40.9) | 363 (43.3) | ||||
| < 55 | 1,700 (35.5) | 1,308 (36.5) | 422 (35.2) | 1,207 (36.0) | 922 (36.7) | 296 (35.3) | ||||
| Diagnosis: STEMI, n (%) | 2,614 (54.6) | 1,998 (55.7) | 655 (54.8) | 1,849 (55.2) | 1,399 (55.6) | 465 (55.5) | ||||
| Comorbid conditions, n (%) | ||||||||||
| CABG | 36 (0.8) | 20 (0.6) | 7 (0.6) | 15 (0.45) | 15 (0.6) | 3 (0.4) | ||||
| CHF | 557 (11.6) | 411 (11.5) | 139 (11.6) | 398 (11.9) | 308 (12.3) | 105 (12.5) | ||||
| Cerebrovascular events | 251 (5.2) | 170 (4.7) | 67 (5.6) | 143 (4.3) | 104 (4.1) | 42 (5.0) | ||||
| IS | 58 (1.2) | 25 (0.7) | 11 (0.9) | 29 (0.9) | 16 (0.6) | 4 (0.5) | ||||
| ICH | 9 (0.2) | 2 (0.1) | c | 5 (0.4) | 9 (0.3) | a | 1 (0.04) | 1 (0.1) | ||
| TIA | 38 (0.8) | 25 (0.7) | 9 (0.8) | 25 (0.75) | 16 (0.6) | 7 (0.8) | ||||
| Other | 206 (4.3) | 134 (3.7) | 54 (4.5) | 118 (3.5) | 82 (3.3) | c | 39 (4.7) | |||
| DM | 1,185 (24.8) | 942 (26.3) | 306 (25.6) | 820 (24.5) | 627 (24.9) | 211 (25.2) | ||||
| DM with complications | 214 (4.5) | 158 (4.4) | 49 (4.1) | 131 (3.9) | 112 (4.5) | 38 (4.5) | ||||
| Pulmonary disorder | 94 (2.0) | 67 (1.9) | 25 (2.1) | 70 (2.1) | 54 (2.1) | 16 (1.9) | ||||
| Dementia | 8 (0.2) | 5 (0.1) | 2 (0.2) | 7 (0.2) | 4 (0.2) | 2 (0.2) | ||||
| Dyslipidemia | 2,765 (57.8) | 2,017 (58.7) | 685 (57.3) | 1,943 (58.0) | 1,461 (58.1) | 495 (59.1) | ||||
| ECH(including peptic ulcer) | 291 (6.1) | 208 (5.8) | 69 (5.8) | 189 (5.6) | 138 (5.5) | 45 (5.4) | ||||
| Peptic ulcer | 11 (0.2) | 3 (0.1) | 2 (0.2) | 8 (0.2) | 4 (0.2) | 0 (0.0) | ||||
| HIV | 10 (0.2) | d | 15 (0.4) | 4 (0.3) | 8 (0.2) | 8 (0.3) | 4 (0.5) | |||
| Para or hemiplegia | 7 (0.15) | 5 (0.1) | 4 (0.33 | 4 (0.1) | 3 (0.1) | 2 (0.2) | ||||
| Hypertension | 2,820 (58.9) | 2,120 (59.1) | 679 (56.8) | 1,939 (57.85) | 1,455 (57.9) | 483 (57.6) | ||||
| Liver disorder | 128 (2.7) | 99 (2.8) | 25 (2.1) | 80 (2.4) | 64 (2.5) | c | 13 (1.6) | |||
| Cancer (incl. metastasis) | 233 (4.9) | 152 (4.2) | 56 (4.7) | 153 (4.6) | 105 (4.2) | 37 (4.4) | ||||
| Metastatic tumor | 13 (0.3) | 4 (0.1) | 3 (0.3) | 7 (0.2) | 3 (0.1) | 1 (0.1) | ||||
| MI | 422 (8.8) | 317 (8.8) | c | 87 (7.3) | 258 (7.7) | 200 (8.0) | 57 (6.8) | |||
| Renal disorder | 386 (8.1) | 259 (7.2) | 95 (7.9) | 262 (7.8) | 184 (7.3) | 66 (7.9) | ||||
| Rheumatoid arthritis | 97 (2.0) | 70 (2.0) | 21 (1.8) | 60 (1.8) | 54 (2.1) | 14 (1.7) | ||||
| Substance abuse | 969 (20.3) | 699 (19.5) | 235 (19.6) | 618 (18.4) | 442 (17.6) | 153 (18.3) | ||||
| Enrolled in Medicare, n (%) | 1,090 (22.8) | 809 (22.5) | 276 (23.1) | 731 (21.8) | 567 (22.6) | 178 (21.2) | ||||
| Health plan, n (%) | ||||||||||
| PPO | 2,814 (58.8) | 2,090 (58.5) | 683 (57.1) | 1,981 (59.1) | 1,482 (58.9) | 492 (58.7) | ||||
| HMO | 571 (11.9) | 450 (12.5) | 137 (11.5) | 317 (11.1) | 293 (11.7) | 100 (11.9) | ||||
| Comprehensive | 544 (11.4) | 405 (11.3) | 146 (12.2) | 337 (10.05) | 265 (10.5) | 91 (10.9) | ||||
| Other | 855 (17.9) | 634 (17.67) | 230 (19.2) | 663 (19.8) | 474 (18.9) | 155 (18.5) | ||||
| Region, n (%) | ||||||||||
| Northeast | 997 (20.8) | 736 (20.5) | 240 (20.1) | 654 (19.5) | 480 (19.1) | 167 (19.9) | ||||
| North Central | 1,203 (25.1) | 903 (25.2) | 308 (25.8) | 944 (28.2) | 690 (27.4) | 224 (26.7) | ||||
| South | 2,002 (41.8) | 1,521 (42.4) | 498 (41.6) | 1,348 (40.2) | 1,035 (41.2) | 349 (41.6) | ||||
| West | 551 (11.5) | 407 (11.3) | 140 (11.7) | 374 (11.2) | 283 (11.3) | 90 (10.7) | ||||
| Other | 31 (0.6) | 21 (0.6) | 10 (0.8) | 32 (0.95) | 26 (1.0) | 8 (1.0) | ||||
Note: Fisher’s exact test was performed when an expected number of events in each group was less than 5. Baseline cost comparisons were performed using Student’s t-tests for log-transformed values.
aThird-generation agent vs. clopidogrel, P < 0.05.
bTicagrelor vs. prasugrel, P < 0.05.
cTicagrelor vs. prasugrel, P < 0.1.
dThird-generation agent vs. clopidogrel, P < 0.1.
CABG = coronary artery bypass graft; CFU = continuous follow-up; CHF = congestive heart failure; CTX = continuous treatment; DM = diabetes mellitus; ECH = extracerebral hemorrhage; HIV = human immunodeficiency virus; HMO = health maintenance organization; ICH = intracerebral hemorrhage; IS = ischemic stroke; MI = myocardial infarction; PPO = preferred provider organization; STEMI = ST-segment elevation myocardial infarction; SD = standard deviation; TIA = transient ischemic attack; USD = U.S. dollars.
APPENDIX B. Results from Matched Cohort Analysis: Measures of Treatment Effects over 6-Month Follow-Up and Bootstrap 95% Confidence Interval Estimates
| Treatment Effect (95% CI) | CFU Cohort | CTX Cohort | ||||||
|---|---|---|---|---|---|---|---|---|
| Newer Agents vs. Generic Clopidogrel | Ticagrelor vs. Prasugrel | Newer Agents vs. Generic Clopidogrel | Ticagrelor vs. Prasugrel | |||||
| All-cause | ||||||||
| Δ total cost | 980 (152, 1,706)a | -3 (-1,534, 1,535) | 1,069 (-17, 2,254) | -1,044 (-2,389, 243) | ||||
| Δ pharmacy cost | 1,055 (977, 1,137)a | 86 (-35, 232) | 1,258 (1,138, 1,383)a | 150 (-8, 298) | ||||
| Δ inpatient service cost | -350 (-909, 239) | -449 (-1,517, 636) | -636 (-1,454, 274) | -638 (-1,533, 473) | ||||
| RR of admission | 0.88 (0.79, 1.00)a | 1.03 (0.85, 1.25) | 0.86 (0.76, 1.00)a | 0.98 (0.76, 1.24) | ||||
| RR of LOSb | 0.99 (0.88, 1.11) | 1.18 (0.96, 1.43) | 0.90 (0.79, 1.02) | 1.16 (0.97, 1.42) | ||||
| RR of ER visits | 0.99 (0.90, 1.08) | 1.12 (0.98, 1.28) | 0.93 (0.84, 1.03) | 1.06 (0.91, 1.23) | ||||
| RR of office visits | 1.00 (0.97, 1.02) | 1.04 (1.00, 1.09) | 0.98 (0.95, 1.02) | 1.04 (0.99, 1.10) | ||||
| Cardiovascular events/services | ||||||||
| Δ CV total cost | 973 (266, 1,708)a | -38 (-1,305, 1,271) | 1,035 (-94, 2,162) | -826 (-1,983, 386) | ||||
| Δ CV pharmacy cost | 1,184 (1,096, 1,255)a | 90 (36, 144)a | 1,329 (1,186, 1,430)a | 109 (52, 170)a | ||||
| Δ pharmacy cost, OAA only | 1,076 (1,058, 1,094)a | 174 (143, 206)a | 1,213 (1,193, 1,233)a | 192 (168, 214)a | ||||
| Δ CV inpatient service cost | -375 (-833, 168) | -495 (-1,335, 363) | -683 (-1,449, 165) | -221 (-993, 706) | ||||
| RR of admission | 0.89 (0.79, 1.01) | 1.00 (0.83, 1.24) | 0.86 (0.76, 1.00) | 0.97 (0.75, 1.23) | ||||
| RR of LOSc | 1.01 (0.89, 1.14) | 1.18 (0.97, 1.45) | 0.88 (0.77, 1.01) | 1.20 (1.00, 1.47) | ||||
| RR of ER visits | 1.04 (0.83, 1.31) | 1.12 (0.81, 1.54) | 0.92 (0.71, 1.18) | 1.02 (0.68, 1.55) | ||||
| RR of office visits | 1.03 (1.00, 1.05) | 0.99 (0.95, 1.02) | 1.00 (0.98, 1.03) | 0.99 (0.95, 1.03) | ||||
aEstimates for which 95% CIs do not include the null.
bLOS per patient who had at least 1 hospital admission.
cLOS with CV admission per patient who had at least 1 hospital admission with a diagnosis of a CV event.
Δ = difference estimate in U.S. dollars; CFU = continuous follow-up; CI = confidence interval; CTX = continuous treatment; CV = cardiovascular; GLM = generalized linear model; LOS = length of hospital stay; OAA = oral antiplatelet agent; RR = rate ratio.
REFERENCES
- 1.Mozaffarian D, Benjamin EJ, Go AS, et al. Heart disease and stroke statistics-2016 update: a report from the American Heart Association. Circulation. 2015;133(4):e38-e360. [DOI] [PubMed] [Google Scholar]
- 2.Amsterdam EA, Wenger NK, Brindis RG, et al. 2014 AHA/ACC guideline for the management of patients with non-ST-elevation acute coronary syndromes: executive summary: a report of the American College of Cardiology/American Heart Association Task Force on Practice Guidelines. Circulation. 2014;130(25):2354-94. [DOI] [PubMed] [Google Scholar]
- 3.Levine GN, Bates ER, Bittl JA, et al. 2016 ACC/AHA guideline focused update on duration of dual antiplatelet therapy in patients with coronary artery disease: a report of the American College of Cardiology/American Heart Association Task Force on Clinical Practice Guidelines: an update of the 2011 ACCF/AHA/SCAI guideline for percutaneous coronary intervention, 2011 ACCF/AHA guideline for coronary artery bypass graft surgery, 2012 ACC/AHA/ACP/AATS/PCNA/SCAI/STS guideline for the diagnosis and management of patients with stable ischemic heart disease, 2013 ACCF/aha guideline for the management of ST-elevation myocardial infarction, 2014 AHA/ACC guideline for the management of patients with non-ST-elevation acute coronary syndromes, and 2014 ACC/AHA guideline on perioperative cardiovascular evaluation and management of patients undergoing noncardiac surgery. Circulation. 2016;134(10):e123-55. [DOI] [PubMed] [Google Scholar]
- 4.O’Gara PT, Kushner FG, Ascheim DD, et al. 2013 ACCF/AHA guideline for the management of ST-elevation myocardial infarction: a report of the American College of Cardiology Foundation/American Heart Association Task Force on Practice Guidelines. Circulation. 2013;127(4):e362-425. [DOI] [PubMed] [Google Scholar]
- 5.Anderson JL, Adams CD, Antman EM, et al. ACC/AHA 2007 guidelines for the management of patients with unstable angina/non-ST-Elevation myocardial infarction: a report of the American College of Cardiology/American Heart Association Task Force on Practice Guidelines (Writing Committee to revise the 2002 guidelines for the management of patients with unstable angina/non-ST-elevation myocardial infarction) developed in collaboration with the American College of Emergency Physicians, the Society for Cardiovascular Angiography and Interventions, and the Society of Thoracic Surgeons endorsed by the American Association of Cardiovascular and Pulmonary Rehabilitation and the Society for Academic Emergency Medicine. J Am Coll Cardiol. 2007;50(7):e1-e157. [DOI] [PubMed] [Google Scholar]
- 6.Kushner FG, Hand M, Smith SC, Jr., et al. 2009 focused updates: ACC/AHA guidelines for the management of patients with ST-elevation myocardial infarction (updating the 2004 guideline and 2007 focused update) and ACC/AHA/SCAI guidelines on percutaneous coronary intervention (updating the 2005 guideline and 2007 focused update): a report of the American College of Cardiology Foundation/American Heart Association Task Force on Practice Guidelines. J Am Coll Cardiol. 2009;54(23):2205-41. [DOI] [PubMed] [Google Scholar]
- 7.Effient (prasugrel) tablets, for oral use. Eli Lilly and Company. Revised July 2015. Available at: https://www.accessdata.fda.gov/drugsatfda_docs/label/2016/022307s014lbl.pdf. Accessed May 30, 2018.
- 8.Plavix (clopidogrel bisulfate) tablets, for oral use. Bristol-Myers Squibb/Sanofi Pharmaceuticals Partnership. Revised July 2017. Available at: https://packageinserts.bms.com/pi/pi_plavix.pdf. Accessed May 30, 2018.
- 9.Kim K, Lee TA, Touchette DR, DiDomenico RJ, Ardati AK, Walton SM.. Contemporary trends in oral antiplatelet agent use in patients treated with percutaneous coronary intervention for acute coronary syndrome. J Manag Care Spec Pharm. 2017;23(1):57-63. Available at: https://www.jmcp.org/doi/10.18553/jmcp.2017.23.1.57. [DOI] [PMC free article] [PubMed] [Google Scholar]
- 10.Sherwood MW, Wiviott SD, Peng SA, et al. Early clopidogrel versus prasugrel use among contemporary STEMI and NSTEMI patients in the U.S.: insights from the National Cardiovascular Data Registry. J Am Heart Assoc. 2014;3(2):e000849. [DOI] [PMC free article] [PubMed] [Google Scholar]
- 11.Wallentin L, Becker RC, Budaj A, et al. Ticagrelor versus clopidogrel in patients with acute coronary syndromes. N Engl J Med. 2009;361(11):1045-57. [DOI] [PubMed] [Google Scholar]
- 12.Wiviott SD, Braunwald E, McCabe CH, et al. Prasugrel versus clopidogrel in patients with acute coronary syndromes. N Engl J Med. 2007;357(20):2001-15. [DOI] [PubMed] [Google Scholar]
- 13.Bae JP, Faries DE, Ernst FR, et al. Real-world observations with prasugrel compared to clopidogrel in acute coronary syndrome patients treated with percutaneous coronary intervention in the United States. Curr Med Res Opin. 2014;30(11):2207-16. [DOI] [PubMed] [Google Scholar]
- 14.Olson WH, Ma YW, Laliberte F, et al. Prasugrel vs. clopidogrel in acute coronary syndrome patients treated with prasugrel. J Clin Pharm Ther. 2014;39(6):663-72. [DOI] [PubMed] [Google Scholar]
- 15.Kim K, Lee TA, Ardati AK, DiDomenico RJ, Touchette DR, Walton SM.. Comparative effectiveness of oral antiplatelet agents in patients with acute coronary syndrome. Pharmacotherapy. 2017;37(8):877-87. [DOI] [PubMed] [Google Scholar]
- 16.Molife C, Frech-Tamas F, DeKoven M, et al. Comparison of healthcare resource utilization and costs in patients hospitalized for acute coronary syndrome managed with percutaneous coronary intervention and receiving prasugrel or ticagrelor. J Med Econ. 2015;18(11):898-908. [DOI] [PubMed] [Google Scholar]
- 17.Larmore C, Effron MB, Molife C, et al. “Real-world” comparison of prasugrel with ticagrelor in patients with acute coronary syndrome treated with percutaneous coronary intervention in the United States. Catheter Cardiovasc Interv. 2016;88(4):535-44. [DOI] [PMC free article] [PubMed] [Google Scholar]
- 18.Simeone JC, Molife C, Marrett E, et al. One-year post-discharge resource utilization and treatment patterns of patients with acute coronary syndrome managed with percutaneous coronary intervention and treated with ticagrelor or prasugrel. Am J Cardiovasc Drugs. 2015;15(5):337-50. [DOI] [PubMed] [Google Scholar]
- 19.Menzin J, Wygant G, Hauch O, Jackel J, Friedman M.. One-year costs of ischemic heart disease among patients with acute coronary syndromes: findings from a multi-employer claims database. Curr Med Res Opin. 2008;24(2):461-68. [DOI] [PubMed] [Google Scholar]
- 20.Zhao Z, Winget M.. Economic burden of illness of acute coronary syndromes: medical and productivity costs. BMC Health Serv Res. 2011;11:35. [DOI] [PMC free article] [PubMed] [Google Scholar]
- 21.Mercaldi CJ, Siu K, Sander SD, et al. Long-term costs of ischemic stroke and major bleeding events among Medicare patients with nonvalvular atrial fibrillation. Cardiol Res Pract. 2012;2012:645469. [DOI] [PMC free article] [PubMed] [Google Scholar]
- 22.Serebruany VL, Fortmann SD.. Viewpoint: “underutilisation of novel antiplatelet agents—myths, generics, and economics.” Thromb Haemost. 2014;112(1):4-9. [DOI] [PubMed] [Google Scholar]
- 23.Quan H, Sundararajan V, Halfon P, et al. Coding algorithms for defining comorbidities in ICD-9-CM and ICD-10 administrative data. Med Care. 2005;43(11):1130-39. [DOI] [PubMed] [Google Scholar]
- 24.U.S. Department of Labor, Bureau of Labor Statistics. Consumer Price Index. January 13, 2016. Available at: http://data.bls.gov/timeseries/CUUR0000SAM?output_view=pct_12mths. Accessed May 30, 2018.
- 25.Johnston SS, Curkendall S, Makenbaeva D, et al. The direct and indirect cost burden of acute coronary syndrome. J Occup Environ Med. 2011;53(1):2-7. [DOI] [PubMed] [Google Scholar]
- 26.Barber J, Thompson S.. Multiple regression of cost data: use of generalised linear models. J Health Serv Res Policy. 2004;9(4):197-204. [DOI] [PubMed] [Google Scholar]
- 27.Manning WG, Mullahy J.. Estimating log models: to transform or not to transform? J Health Econ. 2001;20(4):461-94. [DOI] [PubMed] [Google Scholar]
- 28.Manning WG, Basu A, Mullahy J.. Generalized modeling approaches to risk adjustment of skewed outcomes data. J Health Econ. 2005;24(3):465-88. [DOI] [PubMed] [Google Scholar]
- 29.Cheung YB. Zero-inflated models for regression analysis of count data: a study of growth and development. Stat Med. 2002;21(10):1461-69. [DOI] [PubMed] [Google Scholar]
- 30.Elhai JD, Calhoun PS, Ford JD.. Statistical procedures for analyzing mental health services data. Psychiatry Res. 2008;160(2):129-36. [DOI] [PubMed] [Google Scholar]
- 31.Desgagne A, Castilloux AM, Angers JF, LeLorier J.. The use of the bootstrap statistical method for the pharmacoeconomic cost analysis of skewed data. Pharmacoeconomics. 1998;13(5 Pt 1):487-97. [DOI] [PubMed] [Google Scholar]
- 32.Nikolic E, Janzon M, Hauch O, Wallentin L, Henriksson M.. Cost-effectiveness of treating acute coronary syndrome patients with ticagrelor for 12 months: results from the PLATO study. Eur Heart J. 2013;34(3):220-28. [DOI] [PubMed] [Google Scholar]
- 33.Levine GN, Bates ER, Bittl JA, et al. 2016 ACC/AHA guideline focused update on duration of dual antiplatelet therapy in patients with coronary artery disease: a report of the American College of Cardiology/American Heart Association Task Force on Clinical Practice Guidelines. J Am Coll Cardiol. 2016;68(10):1082-115. [DOI] [PubMed] [Google Scholar]