

Abstract
BACKGROUND:
In patients with type 2 diabetes (T2D) with poor glycemic control, there is an unmet need for treatment optimization involving the initiation and/or intensification of insulin therapy, which is often delayed because of clinical inertia. Educational initiatives that target patients and physicians might be one way to address this need.
OBJECTIVE:
To evaluate the effectiveness of educational materials mailed to physicians and their patients in affecting initiation of insulin therapy and other health care outcomes.
METHODS:
This study, named PIVOTs (Personalized care and the role of Insulin as a Vehicle to Optimizing Treatments), used integrated medical and pharmacy claims data from the U.S.-based HealthCore Integrated Research Database between January 1, 2006, and April 4, 2014, to identify patients who were potential candidates for insulin therapy. Eligible patients were aged 18-75 years, currently enrolled in a commercial or Medicare Advantage health plan, with T2D diagnosis codes. Patients selected for insulin treatment education had glycated hemoglobin A1c (A1c) > 10%, irrespective of the number of noninsulin antihyperglycemic drugs used, or A1c > 8.0% and ≤ 10% while receiving ≥ 2 noninsulin antihyperglycemic drugs. For each identified patient, a corresponding treating physician was identified on a hierarchical basis. Physician-level randomization was conducted to assign physicians and their linked patients to the following 4 cohorts: (1) a cross-sectional cohort in which educational materials were sent to patients and physicians on a single outreach date; (2) a longitudinal cohort in which educational materials were sent to patients and physicians on 2 occasions, 3 months apart; (3) an enhanced cohort in which patients and physicians received the same mailings as the longitudinal cohort, plus physicians were invited to attend a 1:1 video conference academic detailing session; and (4) a control cohort in which patients and physicians did not receive any educational materials. Insulin initiation rates, A1c levels, and medical and pharmacy costs were assessed from claims over 6 and 12 months follow-up within each cohort.
RESULTS:
Mean insulin initiation rates at 12 months ranged from 9.2%-10.3% (all patients) to 12.3%-14.9% (subset with baseline A1c ≥ 9.0%), with similar rates across the intervention and control cohorts. Reductions in A1c from baseline were also similar across cohorts for all patients (0.1%-0.6%), as well as for those with a baseline A1c ≥ 9.0% (0.9%-1.6%). Approximately 14%-20% of patients achieved A1c < 7.0%, with no differences across cohorts. Changes in mean total all-cause and diabetes-related health care costs were also similar across cohorts.
CONCLUSIONS:
The findings of this real-world, randomized intervention call into question the value of educational mailings as a means to overcoming clinical inertia and improving health outcomes in patients with T2D, at least in the context of insulin initiation.
What is already known about this subject
Despite guidance from the American Diabetes Association and the European Association for the Study of Diabetes, a majority of patients with type 2 diabetes in the United States fail to achieve the recommended glycosylated hemoglobin A1c target of ≤ 7.0%.
Many diabetic patients would benefit from the timely initiation of insulin-based therapy, yet patients and their physicians are often reluctant to initiate and/or intensify such therapy despite prolonged poor glycemic control.
Previous nonrandomized, real-world studies have used a pretest versus posttest study design to show potential benefits of mail-based educational interventions, raising the question if such educational initiatives directed at patients and physicians can help accelerate insulin initiation.
What this study adds
Real-world study designs that incorporate separate intervention and control cohorts with random assignment help overcome certain limitations of pretest-posttest intervention studies.
Based on this randomized intervention study, providing educational outreach via mail is not an effective strategy to engage patients and their physicians to escalate treatment in high-risk type 2 diabetic patients.
Diabetes mellitus is a complex, chronic illness requiring continuous medical care and is an important cause of mortality, morbidity, and health system costs. The number of adults living with diabetes worldwide has quadrupled since 1980.1 An estimated 21-22 million U.S. adults are currently living with a diagnosis of diabetes,1,2 and an additional 8 million may have undiagnosed diabetes. Diabetes can be treated and managed by healthy lifestyle decisions and medications to lower blood glucose levels. Previous guidance on the treatment of type 2 diabetes (T2D) offered algorithm-based recommendations, including fixed glycemic targets for all patients, consistent with a one-size-fits-all approach to the management of the disease (e.g., the 2007 4-T study by Holman et al. and previous versions of the consensus treatment guidelines).3,4 In contrast, the American Diabetes Association (ADA) and the European Association for the Study of Diabetes (EASD) 2012 and 2015 consensus statements present a new direction that involves individualized patient glycated hemoglobin A1c (A1c) targets, with additional specific advice on the type of patients who would potentially benefit from initiating insulin-based therapy. For instance, the personalized A1c targets for younger patients or those who are highly motivated and adherent could be lower compared with those for older patients or patients with important comorbid conditions.5,6
Despite extensive research demonstrating the clinical benefits of glycemic control and timely insulin initiation,7 at least 60% of U.S. patients with T2D fail to attain the ADA-recommended A1c goal of ≤ 7.0%.6,8 Barriers to optimizing insulin include physician and patient concerns about the potential risk of hypoglycemia, weight gain, and injection pain.9 In addition, the inconvenience of daily or multiple daily injection regimens imposes a burden on patients.9 These and other concerns may cause physicians to delay intervention or not intervene at all (i.e., clinical inertia).10 Education initiatives have been implemented by health plans to overcome patient and physician barriers, often with the hope of altering behavior through disseminating information from clinical guidelines.11 Validation of these educational materials has become a new standard for health care providers who wish to use materials within their organizations. However, the clinical and health economic effects of these materials are unclear.12-14
This study, named the “Personalized care and the role of Insulin as a Vehicle to Optimizing Treatments” (PIVOTs) study, was centered on an educational outreach initiative that aimed to communicate the ADA 2012 guidelines for initiating insulin therapy to high-risk insulin-naive individuals with T2D and their physicians, thereby helping to reduce clinical inertia. The objective of this study was to evaluate the effect of the PIVOTs initiative on patient insulin initiation rates, changes in A1c, and health care utilization and costs over 6 and 12 months of follow-up. Physician opinion on the usefulness of the intervention was assessed as an exploratory objective.
Methods
Study Design
The PIVOTs educational outreach initiative used integrated medical and pharmacy administrative claims and electronic laboratory result data from the U.S.-based HealthCore Integrated Research Database (HIRD). Database claims identified eligible participants who were adults (aged 18-75 years) and currently enrolled in a commercial or Medicare Advantage health plan, with a T2D diagnosis at any time during the study period between January 1, 2006, and April 4, 2014. Specifically, patients with ≥ 1 inpatient or emergency room (ER) medical claim or ≥ 2 office visits or other outpatient medical claims (at least 30 days apart) indicating the presence of T2D (International Classification of Diseases, Ninth Revision, Clinical Modification [ICD-9-CM] code 250.x0 or 250.x2) or ≥ 1 pharmacy claim for noninsulin and non-glucagon-like peptide-1 antihyperglycemic medications were selected. An index date was set between January 1, 2013, and April 4, 2014, representing the patients’ most recent qualifying encounters with their treating physicians.
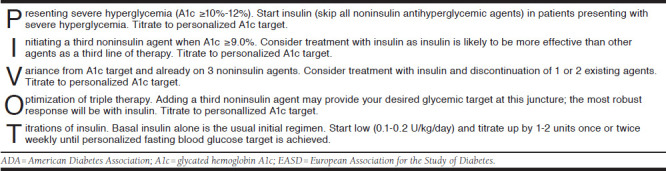
Patients selected for the insulin treatment educational outreach (correlated to the ADA/EASD 2012 position statement on initiation and titration of insulin therapy5; see the Appendix, available in online article) had poor glycemic control as observed in claims, defined as A1c > 10% irrespective of the number of noninsulin antihyperglycemic drugs or A1c > 8.0% and ≤ 10.0% while receiving ≥ 2 noninsulin antihyperglycemic drugs. The time frame for A1c assessment (for patient selection) began 1 year before the index date and continued until the end date of the available data stream at the point of patient identification (April 2014). Patients who did not meet these A1c criteria, and those with ≥ 1 pharmacy claim for insulin before August 6, 2014, were excluded from the educational outreach.
Physician Selection and Attribution Strategy
For each identified T2D patient, a corresponding treating physician was identified and attributed to that patient as the primary provider of diabetes care based on the provider information available from a longitudinal review of each patient’s medical and pharmacy claims data. Since a patient may have seen multiple physicians, a hierarchical approach was applied to determine the primary provider of diabetes care among all physician encounters with primary care or endocrinology specialties. Physicians listed in a patient’s medical claims for ≥ 1 T2D office visit and ≥ 1 pharmacy claim for antihyperglycemic medications were selected first followed by physicians with ≥ 1 T2D office visit but no pharmacy claims (in both cases, if multiple physicians were eligible, the one with the most T2D office visits was selected). Among patients without any office visits in the previous year, the prescribing physicians identified as being responsible for the most recent pharmacy claims for antihyperglycemic medications were selected. If more than 1 physician was eligible at that point, a physician was randomly assigned as the treating physician for that patient.
A physician-level randomization was conducted to assign physicians and their linked patients to 1 of 4 mutually exclusive cohorts. Each cohort received varying forms of PIVOTs educational outreach materials.
A cross-sectional cohort in which educational outreach materials were simultaneously sent to the patients and their treating physicians on a single occasion on the outreach date of August 6, 2014.
A longitudinal cohort in which educational materials were sent to patients and their treating physicians simultaneously on 2 occasions, including the outreach date and again 3 months later.
An enhanced cohort in which all patients received 2 mailings of educational materials similar to the longitudinal cohort, while physicians had 2 touchpoints: (a) they received the same educational materials via mail as the longitudinal cohort and (b) were also invited to participate in a 1:1 video conferencing academic detailing session, which connected physicians with clinical educators and provided a more in-depth educational experience to review the clinical guideline recommendations. Physicians who did not participate in the video conference received the materials a second time, at 3 months after the outreach date (i.e., they received 2 mailings instead of 1 mailing and 1 academic detailing session).
A control cohort in which patients and physicians did not receive any outreach materials associated with the PIVOTs study (Figure 1).
FIGURE 1.
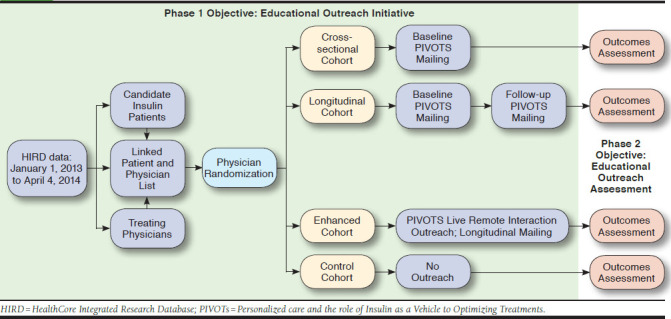
PIVOTs Educational Outreach Study Design
After patients had been identified via the integrated administrative claims data, paired with a physician, and randomized to an intervention group, patient use of targeted antihyperglycemic medications and A1c levels and physician prescribing behavior for antihyperglycemic therapies were tracked via the integrated administrative claims and electronic laboratory result data within the HIRD to evaluate the effect of each intervention on the study endpoints. Outcomes were evaluated twice: first over 6 months after the first outreach (among all patients with ≥ 6 months of health plan enrollment) and a second time over 12 months after the first outreach (among all patients with ≥ 12 months of health plan enrollment).
Patient Profiles
Following the selection of patients and their linked physicians, a claims-based profile was created for each patient that included information relating to demographic data, medication use, A1c measures, presence of microvascular complications, and T2D-related ER visits over the 6-month period before the index visit (baseline period). This information was shared with each patient’s treating physician as part of the mailed materials to potentially assist in decision making but was not part of our outcomes analysis.
Educational Intervention
The PIVOTs educational intervention consisted of a cover letter and a 2-sided brochure for patients and a cover letter, 2-sided brochure, patient claims profiles, and hard copies of the 2012 ADA/EASD position statement for physicians. The study protocol and all outreach materials were developed by HealthCore in conjunction with the study sponsor and were approved by a health plan review committee and the New England Institutional Review Board before the outreach. This study was conducted in full compliance with the relevant provisions of the Health Insurance Portability and Accountability Act.
Outcome Measures
Patient Evaluation.
Patient-level outcomes were collected from administrative claims and integrated laboratory results data. Metrics analyzed for the 6-month baseline period before the outreach date included demographics, comorbidities, and all-cause and T2D-related medical and pharmacy costs. For the 6-month and 12-month follow-up periods after the outreach date, insulin initiation rates (based on outpatient pharmacy claims), A1c levels (for a subset of patients with directly available laboratory data), and all-cause and T2D-related medical and pharmacy costs were assessed (6-month data were presented previously by Bieszk et al., 2016;15 the current analysis focuses on results over 12 months). For A1c and cost outcomes, the change from baseline to follow-up was calculated. Although all patients had A1c results when initially selected for the outreach, the baseline period used for A1c analysis was shorter and anchored to the outreach date (rather than index date, as previously defined); therefore, not all patients had A1c results available for analysis. Costs were based on all claims submitted for that patient—hospital stays, ER visits, and all outpatient visits—as well as medications. Costs included paid amounts by the health plan and the patient. T2D-related costs were based on medical claims with an ICD-9-CM code of 250.x0 or 250.x2 and on pharmacy claims for any antihyperglycemic medication.
Provider Evaluation.
A separate analysis looked at patient outcomes at the provider level in order to examine if the intervention affected provider-prescribing behavior. For each provider, a dataset containing claims information on all of their T2D patients in the period from 6 months before to 12 months after the outreach date was created (i.e., consisting of patients with coverage in health plans represented in the HIRD and including patients who were part of the outreach, as well as those who did not qualify but did have T2D diagnoses or antihyperglycemic fills over the time frame). The analysis examined the number of patients per provider and the mean number and percentage of patients per provider with selected claims-based outcomes (e.g., any insulin fill or number of A1c tests). Results were stratified by the 4 study cohorts.
Finally, all physicians who completed the academic detailing were invited to complete a small survey and semistructured interview, which asked about their perspectives on the usefulness of the intervention. Answers were rated on a 10-point Likert scale (1 to 10, with 10 indicating the highest effect/satisfaction).
Statistical Analysis
Descriptive statistics were used for baseline characteristics and included means (standard deviation [SD]) and relative frequencies. Baseline characteristics were compared between each of the 3 intervention cohorts and the control cohort using chi square tests for categorical variables and independent t-tests for continuous variables to verify the balance between the cohorts. For the 6-month and 12-month follow-up assessments, insulin initiation rates were determined for each cohort and expressed as means with 95% confidence intervals (CIs); differences across cohorts were also assessed using chi square tests. Changes from baseline in A1c levels and health care costs were derived and compared across cohorts using t-tests. CIs for proportions and mean changes were calculated within each cohort using the normal distribution approximation. Data were analyzed using SAS software version 9.4 (SAS Institute, Cary NC).
Results
Patient Demographic and Clinical Characteristics
A total of 4,693 patients and 3,812 physicians (of whom 94% were primary care physicians) were contacted during the outreach initiative and randomized, leading to 4,693 patient-physician pairs. Of the eligible patients contacted, 2,792 patients had 12-month postoutreach data and were included in the 12-month analytic sample, which consisted of 749 (27%) patients randomized to the cross-sectional cohort, 669 (24%) patients in the longitudinal cohort, 716 (26%) patients in the enhanced cohort, and 658 (24%) patients in the control cohort. Baseline characteristics of included patients are summarized in Table 1. The mean (SD) age of the overall patient cohort was 56 (10) years, with a majority of males (64%). Almost half had a preferred provider organization health care plan (49%), and 22% of patients had coverage through Medicare Advantage. When evaluating the entire patient population, each patient was receiving a mean of 1.8 oral antihyperglycemic drug (OAD) classes. In the subset of patients with available baseline A1c results, across the 4 cohorts the mean (SD) A1c ranged from 8.9-9.1 (1.84-1.92), and 41%-48% of patients had A1c ≥ 9.0%. Demographic and clinical baseline characteristics did not differ in a statistically significant way between the 4 cohorts (each of the 3 interventions cohorts compared with the control cohort), whether examined in the sample with the 6-month follow-up (data not shown) or with the 12-month follow-up.
TABLE 1.
Demographics and Patient Baseline Characteristics (12-Month Analytic Sample)
| Cohort | ||||
|---|---|---|---|---|
| Cross-sectional (n = 749) | Longitudinal (n = 669) | Enhanced (n = 716) | Control (n = 658) | |
| Female, n (%) | 251 (34) | 254 (38) | 263 (37) | 243 (37) |
| Age, mean (SD) | 56 (10.0) | 57 (10.5) | 56 (9.7) | 56 (10.1) |
| Geographic region, n (%) | ||||
| Northeast | 167 (22) | 151 (23) | 156 (22) | 135 (21) |
| Midwest | 69 (9) | 81 (12) | 71 (10) | 72 (11) |
| South | 307 (41) | 247 (37) | 271 (38) | 253 (38) |
| West | 206 (28) | 190 (28) | 218 (30) | 198 (30) |
| Health plan type, n (%) | ||||
| HMO | 361 (48) | 292 (44) | 307 (43) | 307 (47) |
| PPO | 346 (46) | 348 (52) | 374 (52) | 326 (50) |
| CDHP | 42 (6) | 29 (4) | 35 (5) | 25 (4) |
| Medicare Advantage, n (%) | 151 (20) | 152 (23) | 155 (22) | 136 (21) |
| QCI, mean (SD) | 0.4 (0.0) | 0.4 (0.0) | 0.4 (0.0) | 0.4 (0.0) |
| OAD classes, mean (SD) | 1.8 (0.97) | 1.8 (0.90) | 1.8 (0.89) | 1.8 (0.90) |
Note: There were no statistically significant differences across cohorts in any of the characteristics listed (P values > 0.1 from chi square tests for categorical variables and t-tests for continuous variables).
CDHP = consumer driven health plan; HMO = health maintenance organization; OAD = oral antihyperglycemic drug; PPO = preferred provider organization; QCI = Quan-Charlson Comorbidity Index; SD = standard deviation.
Patient Clinical Outcomes
Across all cohorts, the mean insulin initiation rates (for any type of insulin) in the 6-month and 12-month periods after the outreach date ranged from 4.9%-5.5% and 9.2%-10.3%, respectively (Figure 2). Insulin initiation rates were similar across the intervention and control cohorts (overlapping CIs and all P values > 0.1). In patients with a baseline A1c value ≥ 9.0%, insulin initiation rates were higher across all 4 cohorts, ranging from 8.5%-11.4% and 12.3%-14.9% over 6 and 12 months, respectively (Figure 2). Again, there was no difference in insulin initiation rates between the intervention and control cohorts (all P values > 0.1). Insulin was initiated with basal insulin in almost all cases (88%-97%), and the mean time from outreach date to insulin initiation was 2-3 months in the 6-month analytic sample and 5-6 months in the 12-month analytic sample (where patients who initiated after 6 months were included) and did not differ across cohorts. Rates of insulin initiation were marginally higher among patients who saw an endocrinologist compared with a primary care physician before outreach but without statistical significance (overlapping 95% CIs and all P values > 0.1).
FIGURE 2.
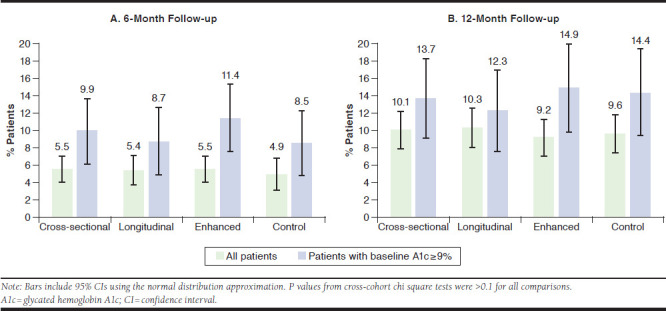
Insulin Initiation Rates During 6-Month and 12-Month Follow-up
In a subset of patients with available A1c data at baseline and 12-month follow-up (n = 139 to n = 183), patients in each of the cohorts had similar reductions from baseline in A1c level (0.1%-0.6%, with P values > 0.1, except for a marginally significant difference between the cross-sectional and control cohorts; see note in Table 2). Patients with an A1c ≥ 9.0% at baseline had a numerically greater reduction in mean A1c (0.9%-1.6%) compared with all other patients, but with overlapping CIs, and the reduction in this patient subgroup was also similar across the 3 intervention cohorts and the control cohort (all P values > 0.1). Those who initiated any type of insulin during the 12-month follow-up also had a numerically greater reduction in mean A1c (0.7%-1.3%) in every cohort except the control cohort, compared with all other patients (all P values > 0.1). Approximately 13%-21% of patients achieved A1c < 7.0%, and 41%-45% achieved A1c < 8.0%; there were no differences across cohorts.
TABLE 2.
A1c Changes from Baseline Among Patients with Available A1c Data at 12 Months (12-Month Analytic Sample)
| Cohort | ||||
|---|---|---|---|---|
| Cross-sectional (n = 749) | Longitudinal (n = 669) | Enhanced (n = 716) | Control (n = 658) | |
| Patients with A1c data at baseline, n (%) | 443 (59) | 400 (60) | 457 (64) | 396 (60) |
| Patients with A1c data at 12-month follow-up, n (%) | 215 (29) | 196 (29) | 225 (31) | 188 (29) |
| Patients with A1c data at baseline and 12-month follow-up, n (%) | 154 (21) | 148 (22) | 183 (26) | 139 (21) |
| A1c level at baseline, % (SD) | 9.1 (1.89) | 9.0 (1.84) | 8.9 (1.92) | 9.0 (1.85) |
| A1c level at 12-month follow-up, % (SD) | 8.8 (1.92) | 8.6 (1.74) | 8.6 (1.82) | 8.7 (1.87) |
| Overall reduction in A1c level, % (SD) | –0.1 (1.94) | –0.5 (1.62) | –0.4 (1.89) | –0.6 (1.98) |
| Among patients with A1c ≥ 9.0% at baseline | –0.9 (2.09) | –1.3 (1.75) | –1.4 (2.01) | –1.6 (2.11) |
| Among patients who initiated any insulin during follow-upa | –0.7 (2.70) | –1.3 (2.53) | –1.3 (2.55) | –0.5 (2.05) |
Note: There were no statistically significant differences across cohorts in any of the characteristics listed above (P values > 0.1 from chi square tests for categorical variables, and t-tests for continuous variables), with 1 exception: the test for a difference between the cross-sectional and control cohorts in the “overall reduction in A1c level” had a P value of 0.0289, which can be considered marginally significant.
an = 11 for the cross-sectional cohort, n = 9 for the longitudinal cohort, n = 19 for the enhanced cohort, and n = 15 for the control cohort.
A1c = glycated hemoglobin A1c; SD = standard deviation.
Change in Total Health Care Medical and Pharmacy Costs
There were no significant differences between the study cohorts in all-cause or diabetes-related health care costs at baseline (all P values > 0.1, except for all-cause prescription costs, with P = 0.03 for cross-sectional vs. control; Table 3). Mean total all-cause medical and pharmacy costs increased from baseline to 12 months, with similar changes across all cohorts (all P values > 0.1; Table 3). The change in mean total all-cause medical and pharmacy costs for the cross-sectional, longitudinal, enhanced, and control cohorts were $2,493, $2,463, $2,802, and $2,764, respectively. The majority of health care costs were diabetes-related, with numerically lower increases from baseline in diabetes-related total medical and pharmacy costs observed in the 3 interventional cohorts (cross-sectional, $1,941; longitudinal, $2,019; and enhanced, $2,182) compared with the control cohort ($2,640; all P values > 0.1).
TABLE 3.
Baseline All-Cause Health Care Costs and Changes from Baseline to 12 Months in All-Cause and Diabetes-Related Health Care Costs (12-Month Analytic Sample)a
| Cohort | P Valueb | ||||||
|---|---|---|---|---|---|---|---|
| Cross-sectional (n = 749) | Longitudinal (n = 669) | Enhanced (n = 716) | Control (n = 658) | Cross-sectional vs. Control | Longitudinal vs. Control | Enhanced vs. Control | |
| Baseline total costs, mean (SD), $ | |||||||
| All-cause medical | 2,580 (8,043) | 2,473 (7,574) | 2,790 (12,837) | 2,470 (7,023) | 0.733 | 0.775 | 0.485 |
| Inpatient | 991 (6,071) | 837 (5,414) | 914 (7,354) | 880 (5,651) | 0.818 | 0.310 | 0.392 |
| Emergency room | 202 (1,004) | 189 (962) | 236 (1,391) | 149 (689) | 0.560 | 0.954 | 0.972 |
| Outpatient | 1,387 (3,522) | 1,447 (3,807) | 1,640 (6,765) | 1,442 (3,315) | 0.751 | 0.930 | 0.462 |
| Baseline total pharmacy costs, mean (SD), $ | 1,848 (3,023) | 1,592 (2,147) | 1,695 (4,149) | 1,992 (7,590) | 0.030 | 0.273 | 0.526 |
| Change in costs, mean (95% CI), $ | |||||||
| Change in total medical costs | |||||||
| All-cause | 1,877 (–202-3,956) | 1,676 (–170-3,522) | 2,184 (437-3,931) | 2,507 (425-4,588) | 0.337 | 0.279 | 0.408 |
| Diabetes-related | 1,499 (–331-3,330) | 1,420 (–291-3,132) | 1,659 (203-3,116) | 2,139 (343-3,934) | 0.312 | 0.285 | 0.256 |
| Change in total pharmacy costs | |||||||
| All-cause | 616 (296-937) | 787 (588-986) | 618 (0-1,236) | 257 (–568-1,083) | 0.213 | 0.110 | 0.246 |
| Diabetes-related | 442 (319-565) | 599 (465-732) | 522 (399-646) | 501 (379-624) | 0.250 | 0.146 | 0.407 |
| Change in total medical and pharmacy costs | |||||||
| All-cause | 2,493 (378-4,608) | 2,463 (593-4,332) | 2,802 (1,031-4,572) | 2,764 (410-5,118) | 0.433 | 0.422 | 0.490 |
| Diabetes-related | 1,941 (101-3,782) | 2,019 (304-3,733) | 2,182 (719-3,645) | 2,640 (832-4,448) | 0.298 | 0.312 | 0.349 |
aDiabetes-related costs are obtained from health care claims with the presence of a diagnosis code for type 2 diabetes (ICD-9-CM 250.x0 or 250.x2) or a pharmacy claim for any antihyperglycemic medication.
bP values were obtained using Wilcoxon-Mann-Whitney test for baseline costs and t-test for change in costs.
CI = confidence interval; ICD-9-CM = International Classification of Diseases, Ninth Revision, Clinical Modification; SD = standard deviation.
Provider-Level Analysis and Survey
Among the 3,812 providers originally contacted, 3,671 could be identified for this analysis, with 944 (26%) in the cross-sectional cohort, 910 (25%) in the longitudinal cohort, 909 (25%) in the enhanced cohort, and 908 (25%) in the control cohort. The geographical distribution of providers was similar to that of the patients (by design). A large majority of providers (94%) were primary care physicians who saw on average 34 T2D patients (median 23) from this commercial health plan over the 6-month baseline and 12-month follow-up periods combined. Metrics were well balanced at baseline, with approximately 18% of patients associated with any given provider having had fills for insulin, 27% on multiple OADs, 50% with an A1c test over the 6-month baseline period, and a mean number of T2D-related office visits of approximately 3 (all P values > 0.1). These outcomes were virtually unchanged over the first 6 months of follow-up, with overlapping CIs (and all P values > 0.1) between each intervention cohort and the control cohort. Over 12 months, all outcomes increased numerically because of the longer time frame, but again, there were no differences across cohorts.
Finally, in the enhanced cohort, 61 academic detailing sessions were conducted. The results of a small survey of these physicians suggested the patient profile data and educational materials did affect their decision-making process, with a mean (SD) impact score regarding insulin initiation and A1c targets for their patients of 5.9 (2.9) and 6.1 (3.1), respectively (where 10 indicates the highest impact). A high overall satisfaction with the video conferencing academic detailing session was reported, with a mean score of 6.9 (2.9). Some physicians also provided additional unsolicited and unstructured feedback during the session. This feedback indicated that they believed patients are resistant to starting insulin therapy because of concerns over injections and a feeling that their diabetes must be severe to require insulin therapy. It also indicated that physicians delay insulin treatment because of a lack of time to educate patients about insulin.
Discussion
PIVOTs used a prospective, real-world, randomized controlled design to evaluate the effect of a diabetes outreach initiative intended to educate T2D patients and their treating physicians about clinical characteristics that favor initiation of insulin therapy. Patients who had a potential unmet need for insulin according to ADA/EASD recommendations, with a mean A1c at baseline of approximately 9.0%, were selected. Many patients had an A1c level above 10.0%, and a large proportion had poor glycemic control despite starting a third OAD. Despite there being an opportunity to further optimize treatment of these patients according to guideline recommendations, the findings suggest that the educational initiative did not result in a significant improvement in insulin initiation and also call into question the effectiveness of more aggressive interventions involving repeated patient mailings or academic video conference detailing sessions for physicians.
Consistent with previously published data,16,17 insulin initiation rates at 6 and 12 months after outreach were low at approximately 5% and 10%, respectively, across all cohorts, indicating a lack of effect as a result of the PIVOTs initiative in insulin initiation. Insulin initiation rates were numerically higher in patients with a baseline A1c ≥ 9.0% and marginally higher in those patients who had seen an endocrinologist, but there were no differences between the intervention and control cohorts. Although patients who initiated any type of insulin during the 12-month follow-up had a numerically larger reduction from baseline in mean A1c compared with the overall cohort, these reductions were not significantly different for the intervention and control cohorts and subject to very low sample sizes. Consistent with these clinical findings, the changes in all-cause and diabetes-related total medical and pharmacy costs during the 12-month follow-up period were similar in the intervention and control cohorts.
The findings of this study are comparable to those described in the “Act on Threes” study—an educational initiative conducted primarily in a Medicare population using a pretest/posttest design with randomization to target adult T2D patients with no A1c testing or A1c levels ≥ 8.0%.17 At the 1-year follow-up, that study reported that there were no significant differences between intervention and control groups with regard to frequency of A1c testing and change from baseline A1c. Insulin was initiated by 6.3% of patients in the intervention group compared with 7.6% of patients in the control group (P = 0.059), which is similar to our findings. Whereas other studies have used a pretest/posttest intervention design to derive positive findings in regard to changes made at the point of care to enhance diabetes-related outcomes,13,14 their lack of control cohorts and random assignment does not allow definitive conclusions about effectiveness. Our findings illustrate the value of randomized real-world study designs in assessing the effectiveness (or lack thereof) of educational efforts aimed at changing diabetes management. It should be noted that the complexity of insulin initiation and maintenance might reduce the effectiveness of a passive, mail-based initiative and that such interventions may have greater potential in other therapeutic areas.
Previous studies suggest that insulin initiation may be affected by barriers faced by patients and health care providers.18,19 For example, patients may fail to initiate insulin because of concerns about their inability to adjust insulin dosage, the effect on social life and work, injection pain, and side effects.20 For their part, physicians appear to prefer to delay insulin initiation until absolutely necessary,21 and some primary care providers are not comfortable initiating insulin at all.22 Based on physician feedback from our study, the perception of some physicians is that the clinical inertia relating to insulin initiation can be largely attributed to patient reluctance to begin insulin therapy and a lack of time among physicians to invest in patient education.
Few physicians took the opportunity to participate in the (uncompensated) academic detailing process. Although this lack of uptake by physicians may indicate a perception that such educational opportunities are of low value, a high overall satisfaction for the video conferencing academic detailing sessions in our study suggests that there are other reasons why physicians are not reached by educational initiatives, such as information overload or lack of time. Our study was not designed to distinguish which party—patient or physician—was the predominant contributor to clinical inertia. Such research may be helpful to better target future educational interventions.
Limitations
This study has some limitations to consider. First, selected patients were identified based on medical and pharmacy claims data extracted from a large U.S. administrative health care database. As a result, these patients may not be representative of all T2D patients and their treating physicians. There are also limits to the generalizability of these results to the U.S. national level, given the high share of patients residing in the South.
Second, this study relied on mailing materials that may not have been received, read, or understood by the patients and/or their physicians, and there was no opportunity to address any questions.
Third, insulin initiation is a major decision point for patients with diabetes and requires significant education, discussion, and counseling by the physician or other health care professional (e.g., nurse practitioner). Such efforts may not be adequately addressed or supported in unidirectional communication/outreach without more active engagement of patients or health care providers.
Fourth, there is a possibility that the study intervention was confounded by other educational materials sent out to physicians around the time of the intervention. The use of randomization in this study helped to mitigate against these possibilities by ensuring an even distribution of confounding events among patients and physicians.
Fifth, A1c results for a pre/post comparison were available for 21%-26% of patients and may not accurately reflect outcomes for the entire study sample.
Finally, this study did not explore patient or physician responses to the outreach initiative other than through a limited sample of physicians who completed the academic detailing session. Feedback on the type and suitability of educational materials would be valuable to guide further communication programs.
Conclusions
Although mailings are carried out frequently by health plans to patients and physicians to educate with the hope of altering health behaviors, typically in order to improve outcomes and/or reduce health care costs, the findings of the real-world, randomized PIVOTs intervention call into question the value of these educational mailings in T2D patients in the context of insulin initiation. There is a need to shift resources towards the development and testing of novel communication approaches designed to appropriately improve insulin initiation rates, glycemic control, and long-term clinical outcomes. The testing of such future interventions is better served through adequately designed randomized observational studies rather than pretest/posttest interventional assessments without control cohorts or random assignment.
ACKNOWLEDGMENTS
The authors received writing/editorial support in the preparation of this manuscript from Pim Dekker, PhD, of Excerpta Medica, funded by Sanofi US.
APPENDIX. Correlation of PIVOTs to Highlights of the 2012 ADA/EASD Position Statement on Initiation and Titration of Insulin Therapy5
REFERENCES
- 1.NCD Risk Factor Collaboration (NCD-RisC) . Worldwide trends in diabetes since 1980: a pooled analysis of 751 population-based studies with 4.4 million participants. Lancet. 2016;387(10027):1513-30. [DOI] [PMC free article] [PubMed] [Google Scholar]
- 2.Centers for Disease Control and Prevention . National diabetes statistics report: estimates of diabetes and its burden in the United States, 2014. U.S. Department of Health and Human Services, Atlanta, GA. Available at: http://choosehealth.utah.gov/documents/pdfs/factsheets/national-diabetes-report-web.pdf. Accessed September 22, 2017. [Google Scholar]
- 3.Holman RR, Thorne KI, Farmer AJ, et al. Addition of biphasic, prandial, or basal insulin to oral therapy in type 2 diabetes. N Engl J Med. 2007;357(17):1716-30. [DOI] [PubMed] [Google Scholar]
- 4.Nathan DM, Buse JB, Davidson MB, et al. Medical management of hyperglycemia in type 2 diabetes: a consensus algorithm for the initiation and adjustment of therapy: a consensus statement of the American Diabetes Association and the European Association for the Study of Diabetes. Diabetes Care. 2009;32(1):193-203. [DOI] [PMC free article] [PubMed] [Google Scholar]
- 5.Inzucchi SE, Bergenstal RM, Buse JB, et al. Management of hyperglycemia in type 2 diabetes: a patient-centered approach: position statement of the American Diabetes Association (ADA) and the European Association for the Study of Diabetes (EASD). Diabetes Care. 2012;35(6):1364-79. [DOI] [PMC free article] [PubMed] [Google Scholar]
- 6.Inzucchi SE, Bergenstal RM, Buse JB, et al. Management of hyperglycemia in type 2 diabetes, 2015: a patient-centered approach: update to a position statement of the American Diabetes Association and the European Association for the Study of Diabetes. Diabetes Care. 2015;38(1):140-49. [DOI] [PubMed] [Google Scholar]
- 7.Smolen HJ, Murphy DR, Gahn JC, et al. The evaluation of clinical and cost outcomes associated with earlier initiation of insulin in patients with type 2 diabetes mellitus. J Manag Care Spec Pharm. 2014;20(9):968-84. Available at: http://www.jmcp.org/doi/10.18553/jmcp.2014.20.9.968. [DOI] [PMC free article] [PubMed] [Google Scholar]
- 8.National Committee for Quality Assurance . The state of health care quality report 2015. Available at: http://www.ncqa.org/report-cards/health-plans/state-of-health-care-quality. Accessed September 22, 2017.
- 9.Peyrot M, Barnett AH, Meneghini LF, et al. Insulin adherence behaviours and barriers in the multinational Global Attitudes of Patients and Physicians in Insulin Therapy study. Diabet Med. 2012;29(5):682-89. [DOI] [PMC free article] [PubMed] [Google Scholar]
- 10.Lovshin JA, Zinman B. Diabetes: clinical inertia—a barrier to effective management of T2DM. Nat Rev Endocrinol. 2013;9(11):635-36. [DOI] [PubMed] [Google Scholar]
- 11.Vickery DM, Fries JF. Take Care of Yourself: The Complete Illustrated Guide to Medical Self-Care. 7th ed. Perseus Books Group; 2001. [Google Scholar]
- 12.Funnell MM, Donnelly MB, Anderson RM, et al. Perceived effectiveness, cost, and availability of patient education methods and materials. Diabetes Educ. 1992;18(2):139-45. [DOI] [PubMed] [Google Scholar]
- 13.Weber V, Bloom F, Pierdon S, et al. Employing the electronic health record to improve diabetes care: a multifaceted intervention in an integrated delivery system. J Gen Intern Med. 2008;23(4):379-82. [DOI] [PMC free article] [PubMed] [Google Scholar]
- 14.Egbunike V, Gerard S. The impact of point-of-care A1c testing on provider compliance and A1c levels in a primary setting. Diabetes Educ. 2013;39(1):66-73. [DOI] [PubMed] [Google Scholar]
- 15.Bieszk N, Grabner M, Wei W, et al. Can patient and provider education increase insulin initiation? Diabetes. 2016;65(Suppl 1):A173 [Abstract 672-P]. [Google Scholar]
- 16.Levin PA, Wei W, Zhou S, et al. Outcomes and treatment patterns of adding a third agent to 2 OADs in patients with type 2 diabetes. J Manag Care Spec Pharm. 2014;20(5):501-12. Available at: http://www.jmcp.org/doi/10.18553/jmcp.2014.20.5.501. [DOI] [PMC free article] [PubMed] [Google Scholar]
- 17.Bieszk N, Reynolds SL, Wei W, et al. “Act on Threes” paradigm for treatment intensification of type 2 diabetes in managed care: results of a randomized controlled study with an educational intervention targeting improved glycemic control. J Manag Care Spec Pharm. 2016;22(9):1028-38. Available at: http://www.jmcp.org/doi/10.18553/jmcp.2016.22.9.1028. [DOI] [PMC free article] [PubMed] [Google Scholar]
- 18.Funnell MM. Overcoming barriers to the initiation of insulin therapy. Clin Diabetes. 2007;25(1):36-38. [Google Scholar]
- 19.Peyrot M, Rubin RR, Khunti K. Addressing barriers to initiation of insulin in patients with type 2 diabetes. Prim Care Diabetes. 2010;4(Suppl 1):S11-18. [DOI] [PubMed] [Google Scholar]
- 20.Karter AJ, Subramanian U, Saha C, et al. Barriers to insulin initiation: the translating research into action for diabetes insulin starts project. Diabetes Care. 2010;33(4):733-35. [DOI] [PMC free article] [PubMed] [Google Scholar]
- 21.Petznick AM. Identifying and addressing barriers to insulin acceptance and adherence in patients with type 2 diabetes mellitus. J Am Osteopath Assoc. 2013;113(4 Suppl 2):S6-16. [PubMed] [Google Scholar]
- 22.Peyrot M, Rubin RR, Lauritzen T, et al. Resistance to insulin therapy among patients and providers: results of the cross-national Diabetes Attitudes, Wishes and Needs (DAWN) study. Diabetes Care. 2005;28(11):2673-79. [DOI] [PubMed] [Google Scholar]