

Abstract
BACKGROUND:
Although the current methods of medication therapy management (MTM) delivery have demonstrably improved therapeutic, safety, economic, and humanistic health outcomes, patient- and prescriber-level barriers persist, limiting its reach and effectiveness.
OBJECTIVE:
To assess telephonic- and community-based clinical pharmacy services in improving health indicators for rural, underserved patients.
METHODS:
In 2014, an established MTM provider created a novel, collaborative pilot program with independent retail and community health center pharmacies to provide comprehensive, telephonic MTM services to rural Arizonans. This pilot program used a combined telephonic- and community-based pharmacist approach in the provision of MTM services for rural, underserved Arizona populations. Adults with diabetes mellitus and/or hypertension, seen by a prescriber or who filled prescriptions at a contracted, rural facility in 2014, were eligible to participate. Initial MTM telephonic consultations were conducted, and recommendations were communicated to patients’ prescribers and/or pharmacists. Patients received a follow-up telephone call at standard intervals, depending on risk severity.
RESULTS:
A total of 517 patients participated, and 237 medication-related and 1,102 health promotion interventions were completed. Positive trends were observed in fasting blood glucose, postprandial glucose, and diastolic blood pressure. Broad variation in prescriber acceptance of pharmacist recommendations was observed (27%-60%).
CONCLUSIONS:
Study results provide initial evidence to support the efficacy of collaborative efforts in the provision of MTM services for improving health indicators and safety measures while potentially reducing health care disparities. While the results are encouraging, future research is warranted in more diverse populations and settings.
What is already known about this subject
Medication therapy management (MTM) has demonstrably improved therapeutic, safety, economic, and humanistic health outcomes, yet barriers remain that affect optimal participation.
Comprehensive medication review completion rates remain relatively low (23.8%-49.8%), depending on the delivery approach used.
Several patient- and prescriber-level limitations have been identified, including patient acceptance of MTM services and prescriber acceptance of recommendations generated via MTM services.
What this study adds
This pilot program evaluation describes and evaluates a novel method of MTM delivery, using a partnership between a centralized MTM provider and several community pharmacy sites.
This approach demonstrates enhanced patient acceptance, while improving such health indicators as biomarkers, gaps in care, and medication-related problems.
The advent of medication therapy management (MTM) was a major hallmark in addressing medication-related issues, while simultaneously expanding the role of pharmacists from medication dispensers to integrated members of interprofessional, clinical health care teams. MTM is defined by the American Pharmacists Association as “a service or group of services that optimize therapeutic outcomes for individual patients” and consists of 5 core elements: (1) a comprehensive or targeted medication therapy review (CMR); (2) creation or formulation of a personal medication record; (3) development of a medication-related action plan; (4) implementation of the action plan through interventions and referrals; and (5) documentation and follow-up.1 The Medicare Prescription Drug, Improvement and Modernization Act requires that all Part D sponsors provide MTM services to eligible beneficiaries.2 Individual sponsors, such as health plans or MTM providers, determine the logistics of MTM delivery, yet most use a single or combined delivery model (e.g., telephonic, face-to-face, or combination of the two) to fulfill this requirement.3
While a growing body of literature demonstrates the efficacy of MTM in improving patient-related health measures and lowering health care costs,4-7 CMR completion rates—the first step in the provision of MTM services and a measurable benchmark of program reach—remain relatively low (23.8%-49.8%), depending on the delivery approach used.8 Furthermore, even the most commonly used MTM delivery models face substantial patient- and prescriber-related barriers, thus limiting the service’s reach and effectiveness.9
Patients can choose to opt-out of MTM services, so patient engagement is critical to improve participation and retention. In addition, many patients have reservations about pharmacists serving in a nondispensing capacity.10 Also, a general lack of patient understanding exists regarding the prescriber-MTM pharmacy staff relationship, yet it is one of the most important factors in determining patient participation in MTM services.11 On the prescriber side, acceptance rates of MTM recommendations made by pharmacists are lower than desired and vary widely (14.1%-60%).12-14 Lack of prescriber awareness of MTM services presents another challenge.15
To address these barriers, some sponsors have attempted to improve strategies or promotional approaches.8,16 Others have established stricter eligibility criteria and varying levels of MTM services to improve efficacy or integrated more targeted MTM programs into clinics.17,18 Observational data suggest that patients desire a collaborative relationship between their prescribers and their MTM providers.11 However, to our knowledge, no published research exists on collaboration between a centralized, telephonic, comprehensive MTM provider and community-based pharmacists and/or prescribers. Thus, a knowledge gap exists surrounding the logistics and efficacy of such a program. Yet, this collaborative concept is uniquely suited to help overcome the aforementioned barriers and to increase the reach and efficacy of MTM services.
In 2014, an established MTM provider created a novel, collaborative pilot program with independent retail and community health center pharmacies to provide comprehensive, telephonic MTM services to rural Arizonans. The objective of this program evaluation was to assess the ability of telephonic- and community-based clinical pharmacy services to improve health indicators for rural, underserved patients, who typically experience a shorter life expectancy, health workforce recruitment challenges, and decreased access to hospital facilities.19,20
Methods
Project Design and Study Population
This program evaluation project employed a pre-post design to assess the effect of MTM services (intervention). Patients were followed for a 1-year period.
Eligible patients met the following criteria: (a) received care at one of the community partner sites; (b) were aged 18 years or older; (c) had a current diagnosis of hypertension and/or diabetes mellitus; and (d) were currently living in a rural Arizona community. The participating community sites were considered rural, based on the definition in the Arizona statute.21 The Institutional Review Board deemed this project as a program evaluation given that the intent was to improve or evaluate a practice or process. Written patient consent was not required; all participants were informed of the program and given the option to participate.
Partner Sites
The MTM provider, housed at a nonrural academic institution, partnered with the participating rural community sites. Selection of community partner sites was based on the following: (a) long-standing relationships with the local academic institution and (b) the ability to target socioeconomically underserved areas to address health disparities as defined by the Centers for Disease Control and Prevention.22 Five contracted rural community partner sites were selected, including 3 independent retail pharmacies, with 2 owned by the same entity (Sites I1, I2, I3); 1 pharmacy imbedded at a Federally Qualified Health Center (Site C1); and 1 Rural Health Clinic pharmacy (Site C2). The sites were dispersed throughout rural areas in Arizona.
Patient Enrollment
Eligible patients were primarily recruited and enrolled by the community partner sites in person and via telephone. The centrally located MTM provider also furnished flyers for mail and e-mail dissemination and periodically conducted telephonic recruitment. Partner site personnel introduced and offered the pilot program to eligible patients. After a patient agreed to participate, site personnel completed a patient registration form and sent it to the MTM provider. Once the form was received, the MTM pharmacist contacted the patient to provide telephonic MTM services from a centralized, nonrural academic site (Figure 1).
FIGURE 1.
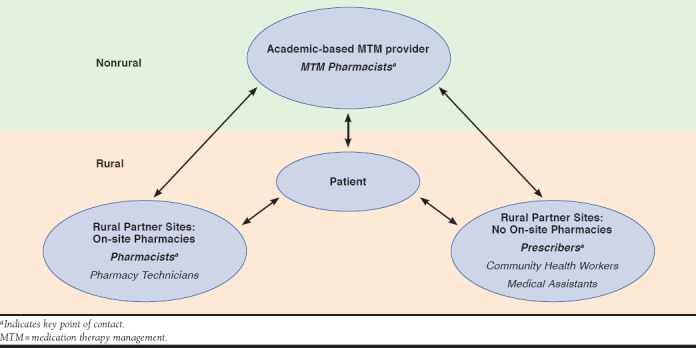
Interprofessional MTM Provider and Rural Partner Sites in Provision of MTM Services
Definition of Roles
The role of the centralized MTM pharmacist included providing comprehensive MTM services (e.g., CMR) to patients; sending recommendations to partner sites (i.e., community pharmacist and/or prescriber); and conducting follow-up patient consultations. In addition, staff at the partner sites recruited patients; discussed recommendations made by the MTM pharmacist with the patients (e.g, medication initiation, patient follow-up, recommended vaccinations, and dosing changes); and conducted periodic reviews of medication history to assess recommendation outcomes.
Partner site staff included community health workers, medical assistants, pharmacists, and/or prescribers, depending on the respective site. At one community partner site (Site C2), community health workers, or promotoras, served as front-line health aides (e.g., community representatives). When possible, community health workers were present in the patient’s home during the initial CMR to assist the patient during the medication reconciliation portion of the CMR; ensure patient understanding; and document any recommendations made during the call.
MTM Services
The MTM provider followed the American Pharmacists Association’s Core Elements of an MTM Service Model,1 with special emphasis on patient laboratory results and self-monitoring, appropriateness of therapy, medication-related problems, and health promotion. Interventions and referrals were communicated directly to staff at the respective community partner sites. Pharmacists at the on-site pharmacy sites (I1, I2, and I3) received the direct communication from the MTM pharmacist, while prescribers were the main point of contact at the health center sites (C1 and C2).
MTM pharmacists conducted a 30-day, follow-up review for identified high-risk patients to ensure that previously made interventions and/or recommendations were addressed appropriately. If patients did not meet the high-risk criteria, MTM pharmacists conducted a 90-day, follow-up review. High-risk criteria included hemoglobin A1c > 7%, average fasting blood glucose level (FBG) >130, frequent hypoglycemia, presence of diabetic complications, missing preventive screenings, blood pressure not at individualized goal, uncontrolled respiratory symptoms, confusion regarding inhaler use, fluid overload symptoms, missing fluid management plan, and any medication nonadherence. If deemed necessary, MTM pharmacists conducted additional follow-up (e.g., alarm symptoms present such as unusual bleeding or hypertensive urgencies and significant drug-drug interactions). In cases where the patient was unreachable, the MTM pharmacist completed a direct-to-site outreach. In these instances, the pharmacist provided MTM services based on available information (e.g., site-provided medication list) and made pertinent recommendations directly to the staff at the community partner site.
Data Collection
Patient demographics were collected for gender, age range, race, ethnicity, and tabulated medical conditions. Laboratory results and self-monitoring data were collected at baseline and follow-up, including systolic and diastolic blood pressure (SBP and DBP), hemoglobin A1c, FBG, and postprandial glucose levels (PPG). When available, laboratory results were obtained from the medical record by partner site staff. In cases where that information was not available, the laboratory results were obtained from the patients (self-report).
Gaps in care were assessed according to national consensus guidelines.23-29 The presence of a statin (3-hydroxy-3-methylglutaryl-coenzyme A reductase inhibitor) was assessed in patients with diabetes and atherosclerotic cardiovascular disease. Presence of a beta-adrenergic blocker was assessed in patients with reduced ejection fraction heart failure and in post-myocardial infarction patients. Inhaled corticosteriod presence was assessed in patients with asthma only; inhaled beta-2 adrenergic agonist presence (such as an albuterol inhaler) was assessed in patients with asthma and chronic obstructive disease. The presence of an inhaled corticosteroid was assessed in patients with asthma. These assessments were only made for patients when it was clinically appropriate based on guidelines. The presence of an angiotensin-converting enzyme inhibitor or angiotensin receptor blocker was not assessed during the pilot phase because of changes in hypertension and diabetes guidelines during the setup of clinical algorithms for the program year. A gap in care was measured by a lack of prescription for the previously mentioned drug classes when clinically indicated by nationally accepted guidelines. While the study eligibility criteria only specified hypertension and/or diabetes, patient comorbid conditions were also reviewed for appropriateness of therapy and safety, thus representing comprehensive care provision.
Each patient’s medication regimen was reviewed during the initial CMR and quarterly thereafter to ensure that therapy paralleled current chronic disease management guidelines; the MTM pharmacist recommended a medication change to address any inconsistencies. A successful medication therapy intervention was defined as a patient’s prescriber making a medication change per the pharmacist’s recommendation.
Given that the prevalence of diabetes and hypertension increases with age, the investigators expected the population to include a large percentage of older adults. For this reason, medication regimen safety was assessed according to the Beers Criteria, which outlines inappropriate medications for use in patients aged 65 years and older.30
Identified medication-related problems were recorded during the MTM pharmacist’s initial and follow-up calls to patients. Adherence to medication therapy was assessed via patient self-report at baseline and again at follow-up. Specifically, patients were asked about the frequency of missed doses. Nonadherence was defined as missing a dose more than 20% of the time in a given month.
Primary and Secondary Prevention and Health Promotion Activities
Prevention and health promotion activities were assessed and included patient education (e.g., how to identify and appropriately manage hypoglycemic events); missing and/or having recommended preventive screenings (e.g., daily foot exams and finger-stick fasting blood sugar for diabetic patients); medication utilization concerns (e.g., not taking medication as prescribed); clinically appropriate vaccination status; and community health care resource referrals (e.g., diabetes education, dietary consultation, and use of community health workers/promotora). Prescribers and/or pharmacists were notified regarding recommended therapy changes or vaccines, when appropriate.
Data Analysis
Chi-square tests (Yates correction used for cell frequency less than 5) were used to compare unpaired nominal data, while McNemar’s test was used for paired nominal data, as appropriate. Paired t-tests and Tukey’s honestly significant difference tests were used as appropriate to evaluate changes in paired interval-level data. An alpha of 0.05 was selected a priori, and Bonferroni corrections were used in the cases of multiple tests to decrease the possibility of a type I error. Participants who were lost to follow-up were excluded from the analysis. All analyses were performed using SPSS version 24 (IBM, Armonk, NY).
Results
Patient Acceptance of MTM Services and Demographics
The community partner sites enrolled and referred 552 eligible patients to the MTM provider for services. Of these, 517 patients participated by receiving an initial CMR (93.6% acceptance rate).
Roughly two thirds of program participants (n = 517) were female (64.8%) and had a median age range of 65-74 years. Most participants identified themselves as white (70.2%), while 19.9% did not disclose their race. Overall, half (50.5%) of the participants self-identified as non-Hispanic, followed by Hispanic (39.5%) and some who did not disclose their ethnicity (10%). Patient-reported ethnicity (i.e., Hispanic) differed significantly across 3 of the sites: (C1: 20.2%, I1: 6.3%, and C2: 95.9%; P < 0.05; Table 1).
TABLE 1.
Demographics by Site: Patient Participants
| Site I1 n = 63 n (%) | Site I2 n = 42 n (%) | Site I3 n = 16 n (%) | Site C1 n = 248 n (%) | Site C2 n = 148 n (%) | Total n = 517 n (%) | |
|---|---|---|---|---|---|---|
| Gender | ||||||
| Male | 24 (38.1) | 19 (45.2) | 6 (37.5) | 94 (37.9) | 39 (26.4)a | 182 (35.2) |
| Female | 39 (61.9) | 23 (54.8) | 10 (62.5) | 154 (62.1) | 109 (73.6) | 335 (64.8) |
| Ethnicity | ||||||
| Hispanic | 4 (6.3) | 7 (16.7) | 1 (6.3) | 50 (20.2)b | 142 (95.9)b | 204 (39.5) |
| Non-Hispanic | 50 (79.4) | 27 (64.3) | 3 (18.8) | 181 (73.0) | 0 (0.0) | 261 (50.5) |
| Did not disclose | 9 (14.3) | 8 (19.0) | 12 (75.0) | 17 (6.9) | 6 (4.1) | 52 (10.0) |
| Race | ||||||
| White | 43 (68.3) | 33 (78.6) | 11 (68.8) | 165 (66.5) | 111 (75.0)c | 363 (70.2) |
| African American | 0 (0.0) | 0 (0.0) | 0 (0.0) | 4 (1.6) | 0 (0.0) | 4 (0.8) |
| American Indian/Alaska Native | 0 (0.0) | 0 (0.0) | 0 (0.0) | 3 (1.2) | 0 (0.0) | 3 (0.6) |
| Asian | 0 (0.0) | 0 (0.0) | 0 (0.0) | 0 (0.0) | 0 (0.0) | 0 (0.0) |
| Pacific Islander | 0 (0.0) | 0 (0.0) | 0 (0.0) | 0 (0.0) | 0 (0.0) | 0 (0.0) |
| Other | 1 (1.6) | 2 (4.8) | 0 (0.0) | 41 (16.5) | 0 (0.0) | 44 (8.5) |
| Did not disclose | 19 (30.2) | 7 (16.7) | 5 (31.3) | 35 (14.1) | 37 (25.0) | 103 (19.9) |
| Age range in years | ||||||
| 18-29 | 0 (0.0) | 0 (0.0) | 0 (0.0) | 0 (0.0) | 1 (0.7) | 1 (0.2) |
| 30-39 | 3 (4.8) | 1 (2.4) | 0 (0.0) | 4 (1.6) | 3 (2.0) | 11 (2.1) |
| 40-49 | 3 (4.8) | 6 (14.3) | 0 (0.0) | 20 (8.1) | 17 (11.5) | 46 (8.9) |
| 50-59 | 12 (19.0) | 6 (14.3) | 1 (6.3) | 56 (22.6) | 44 (29.7) | 119 (23.0) |
| 60-64 | 10 (15.9) | 7 (16.7) | 2 (12.5) | 56 (22.6) | 23 (15.5) | 98 (19.0) |
| 65-74 | 20 (31.7) | 16 (38.1) | 7 (43.8) | 73 (29.4) | 43 (29.1) | 159 (30.8) |
| ≥75 | 15 (23.8) | 6 (14.3) | 6 (37.5)d | 39 (15.7) | 17 (11.5) | 83 (16.1) |
| Median age group | 65-74 | 65-74 | 65-74 | 65-74 | 65-74 | 65-74 |
Notes: Sites I1, I2, and I3 = independent community pharmacies; sites C1 and C2 = community health center pharmacies. Percentages may not equal 100% due to rounding.
aC2 had a different gender distribution than C1 and I2 (P = 0.003).
bI1 had a different ethnicity composition than C1. C2 had a difference in ethnicity than the other sites (P < 0.05).
cC1 had a different race distribution than C2 and I1 (P = 0.003).
dI3 had an older patient sample than C1 (P = 0.003).
Medical Conditions
Participants (n = 517) had an average of 2.3 chronic conditions; the 2 most common conditions were type 2 diabetes (74.3%) and hypertension (93.8%). Overall, about half of the participants met the high-risk criteria; however, 1 site (Site C2) had fewer high-risk patients (23.8%, P < 0.05).
Laboratory Results and Self-Monitoring
Overall, positive trends were observed for laboratory results and self-monitoring. Statistically significant results were observed from preprogram to follow-up for sites C1 and C2 for decreases in the following: FBG from 131 to 125 (P = 0.044); PPG from 174 to 160 (P = 0.024); and DBP from 77 to 73 (P < 0.001). Patients at Site C2 also showed a decrease in FBG from 136 to 116 (P = 0.002) and SBP from 155 to 147 (P = 0.001).
Gaps in Care Based on National Consensus Guidelines
Overall, average adherence to national guidelines before intervention was 75% or higher. As a group, the highest observed compliance rate was for rescue inhaler use, with 92.6% of participants with asthma having an active prescription. In addition, 81.7% of patients requiring a beta blocker were appropriately prescribed the medication. The largest gap in care was for patients with respiratory conditions (e.g., asthma), indicated for an inhaled corticosteroid; only 78.1% of patients had an active prescription.
Dependent on the site of care, 7.0%-22.6% of participants needed an intervention to address gaps in care. Prescriber acceptance of MTM pharmacist recommendations to initiate therapy for identified gaps in care was as follows: a beta blocker (60%), a rescue inhaler (38%), an inhaled corticosteroid (6%), and a statin (27%). There was some site-to-site variation surrounding gaps in care. At baseline, 2 sites (I2 and I3) had 100% compliance with beta blocker therapy, while others (I1, C2, and C3) had lower compliance, with 17%-29% of patients requiring an intervention. At each site, about one fifth of patients required an MTM pharmacist intervention for statin therapy; however, the acceptance rates by prescriber varied widely across sites (0%-43%; Table 2).
TABLE 2.
Gaps in Care Based on National Consensus Guidelines by Site
| When appropriate… | Site I1 n (%) | Site I2 n (%) | Site I3 n (%) | Site C1 n (%) | Site C2 n (%) | Total n (%) |
|---|---|---|---|---|---|---|
| Statin | ||||||
| Present | 30 (81.0) | 12 (80.0) | 9 (81.8) | 162 (78.6)a | 57 (71.2) | 270 (77.4) |
| Not present – contacted prescriber | 7 (19.0) | 3 (20.0) | 2 (18.2) | 44 (21.4) | 23 (28.8) | 79 (22.6) |
| Present after recommendation | 3 (42.9) | 0 (0.0) | 0 (0.0) | 10 (22.8)b | 8 (34.8) | 21 (26.6) |
| Beta blocker | ||||||
| Present | 11 (73.3) | 2 (100.0) | 4 (100.0) | 45 (83.3) | 5 (71.4) | 67 (81.7) |
| Not present –contacted prescriber | 4 (26.7) | 0 (0.0) | 0 (0.0) | 9 (16.7) | 2 (28.6) | 15 (18.3) |
| Present after recommendation | 3 (75.0) | – | – | 4 (44.4) | 2 (100.0) | 9 (60.0) |
| Rescue inhaler | ||||||
| Present | 20 (100.0) | 3 (75.0) | 3 (75.0) | 69 (93.2) | 6 (85.7)c | 101 (92.6) |
| Not present– contacted prescriber | – | 1 (25.0) | 1 (25.0) | 5 (6.8) | 1 (14.3) | 8 (7.3) |
| Present after recommendation | – | 1 (100.0) | 0 (0.0) | 1 (20.0) | 1 (100.0) | 3 (37.5) |
| Inhaled corticosteroid | ||||||
| Present | 13 (86.7) | 4 (100.0) | 2 (100.0) | 35 (72.9) | 3 (75.0) | 57 (78.1) |
| Not present | 2 (13.3) | – | – | 13 (27.1) | 1 (25.0) | 16 (21.9) |
| Present after recommendation | 1 (50.0) | – | – | 0 (0.0) | 0 (0.0) | 1 (6.3) |
Notes: Sites I1, I2, and I3 = independent community pharmacies; sites C1 and C2 = community health center pharmacies. Percentages may not equal 100% due to rounding.
aStatin pre-intervention showed a higher proportion of compliance with current guidelines for C1 versus C2 (P = 0.001).
bC1 had a positive increase in statin use from pre-intervention to first follow-up (P =0.002).
cC2 (P = 0.002) had a higher proportion of patients with a rescue inhaler prescribed before intervention then C1.
Beers List
Approximately 46.8% (n = 242) of participants were aged 65 years or older. Of these, 22.7% (n = 55) had active prescriptions for high-risk medications per the Beers criteria. A total of 67 high-risk medications were identified, and 50 recommendations were made for alternative therapies to address these issues. The 2 most common high-risk medications identified were first-generation antihistamines (n = 15 users) and benzodiazepines (n = 13 users).
Medication-Related Problems
There were 237 medication-related interventions, averaging 0.46 interventions per patient. No statistical differences between sites were observed for therapy duplications or drug-disease interactions identified. In contrast, Site C1 had a significantly larger proportion of patients with drug-drug interactions compared with Site C2 (11.7% vs. 4.1%, P = 0.016; Table 3).
TABLE 3.
Medication-Related Problems Identified by Site
| Site I1 n (%) | Site I2 n (%) | Site I3 n (%) | Site C1 n (%) | Site C2 n (%) | Total n (%) | |
|---|---|---|---|---|---|---|
| Therapy duplications | ||||||
| Identified | 3 (4.8) | 4 (9.5) | 2 (12.5) | 16 (6.5) | 5 (2.7) | 30 (5.8) |
| Resolved | 3 (100.0) | 3 (75.0) | 2 (100.0) | 12 (75.0) | 3 (60.0) | 23 (76.6) |
| New duplications at follow-up | 0 (0.0) | 0 (0.0) | 0 (0.0) | 2 (0.8) | 0 (0.0) | 2 (0.4) |
| Drug-disease interactions | ||||||
| Identified | 1 (1.6) | 1 (2.4) | 0 (0.0) | 11 (4.4) | 2 (1.4) | 15 (2.9) |
| Referred | 0 (0.0) | 0 (0.0) | 0 (0.0) | 5 (31.3) | 1 (50.0) | 6 (40.0) |
| Resolved | 0 (0.0) | 0 (0.0) | 0 (0.0) | 4 (80.0) | 0 (0.0) | 4 (66.7) |
| New interaction at follow-up | 0 (0.0) | 1 (2.4) | 0 (0.0) | 0 (0.0) | 0 (0.0) | 1 (0.2) |
| Drug-drug interactions | ||||||
| Identified | 5 (7.9) | 2 (4.8) | 0 (0.0) | 29 (11.7)a | 6 (4.1) | 42 (8.1) |
| Referred | 3 (60.0) | 0 (0.0) | 0 (0.0) | 10 (34.5) | 2 (33.3) | 15 (35.7) |
| Resolved | 1 (33.3) | 0 (0.0) | 0 (0.0) | 4 (40.0) | 2 (100.0) | 7 (46.6) |
| Safety concerns | ||||||
| Identified | 7 (11.1) | 5 (11.9) | 0 (0.0) | 35 (14.1) | 8 (5.4) | 55 (10.6) |
| Referred | 4 (57.1) | 3 (60.0) | 0 (0.0) | 29 (82.9) | 7 (87.5) | 43 (78.2) |
| Resolved | 4 (100.0) | 0 (0.0) | 0 (0.0) | 4 (13.8) | 1 (14.3) | 9 (20.9) |
| Dose-related concerns identified | ||||||
| Too high | 3 (42.9) | 2 (40.0) | 0 (0.0) | 13 (44.8) | 4 (50.0)b | 22 (40.0) |
| Too low | 2 (28.6) | 3 (60.0) | 0 (0.0) | 22 (62.9) | 4 (50.0) | 31 (56.4) |
| Other | 2 (28.6) | 0 (0.0) | 0 (0.0) | 0 (0.0) | 0 (0.0) | 2 (3.6) |
| Adverse drug reactions identified | 14 (22.2) | 7 (16.7) | 3 (18.8) | 46 (18.5) | 18 (12.2) | 88 (17.0) |
| Medication interventions | 237 | |||||
| Interventions per patient | 0.46 | |||||
Notes: Sites I1, I2, and I3 = independent community pharmacies; sites C1 and C2 = community health center pharmacies. Percentages may not equal 100% due to rounding.
aC1 had a higher proportion of drug-drug interactions identified than C2 (P = 0.016).
bC1 had a higher number of dose-related concerns than C2 (P = 0.011).
Health Promotion
There were 1,102 health promotion interventions completed, or approximately 2 interventions per patient. Overall, 43.5% (n = 225) of participants were missing necessary preventative screenings (e.g., daily foot exams and eye exams), and some were lacking current vaccinations (pneumococcal 49.3%, herpes zoster 45.7%, and influenza 28.7%). Regarding community resources, about 8% of patients were referred to community health center programs (e.g., diabetes and healthy lifestyle education). Furthermore, 11.4% of patients used promotoras at the site (C2) with the integrated program. On average, 88.7% of patients were adherent to their medication regimens, and while not statistically significant, there was a decrease in nonadherent patients at site C2 (13.8%-6.1%; Table 4).
TABLE 4.
Health Promotion Compliance by Site
| Site I1 n (%) | Site I2 n (%) | Site I3 n (%) | Site C1 n (%) | Site C2 n (%) | Total n (%) | |
|---|---|---|---|---|---|---|
| Hypoglycemic event education provided | ||||||
| Yes | 8 (13.7) | 1 (2.4) | 1 (6.7) | 65 (26.8) | 30 (21.7) | 105 (21.3) |
| No – not needed | 29 (50.0) | 11 (26.8) | 7 (46.7) | 162 (66.9) | 56 (40.6) | 265 (53.6) |
| NA – patient does not have DM | 21 (36.2) | 29 (70.7) | 7 (46.7) | 15 (6.2) | 52 (37.7) | 124 (25.1) |
| Missing preventative screeningsa | 15 (23.8) | 9 (21.4) | 2 (12.5) | 150 (60.5) | 49 (33.1) | 225 (43.5) |
| Administration errors identified/corrected | 1 (1.6) | 0 (0.0) | 1 (6.3) | 1 (0.4) | 0 (0.0) | 3 (0.6) |
| Referral to a… | ||||||
| Community health center | 2 (3.2) | 0 (0.0) | 3 (18.8) | 26 (10.5) | 11 (7.4) | 42 (8.1) |
| Promotora | 0 (0.0) | 0 (0.0) | 0 (0.0) | 0 (0.0) | 7 (4.7) | 7 (1.4) |
| Prescriber (high-risk medications) | 8 (12.7) | 2 (4.8) | 1 (6.3) | 31 (20.7) | 8 (16.3) | 50 (9.7) |
| Vaccine recommendations | ||||||
| Pneumococcal | 26 (45.6) | 17 (42.5) | 7 (50.0) | 122 (49.6) | 75 (52.1) | 247 (49.3) |
| Herpes zoster | 21 (33.3) | 17 (42.5) | 8 (61.5) | 112 (39.0) | 73 (50.3) | 231 (45.5) |
| Influenza | 16 (26.2) | 18 (42.9) | 6 (42.9) | 51 (20.6) | 55 (38.2) | 146 (28.7) |
| Medication adherence | ||||||
| Predose missed > 6 times in 30 days | ||||||
| Yes | 3 (9.1) | 0 (0.0) | 0 (0.0) | 25 (11.2) | 18 (13.8) | 46 (11.6) |
| No | 30 (90.9) | 21 (100.0) | 11 (100.0) | 197 (88.8) | 112 (86.2) | 371 (88.7) |
| Postdose missed > 6 times in 30 days | ||||||
| Yes | 0 (0.0) | 0 (0.0) | 0 (0.0) | 0 (0.0) | 3 (6.1) | 3 (2.1) |
| No | 10 (100.0) | 2 (100.0) | 2 (100.0) | 79 (100.0) | 46 (93.9) | 139 (97.9) |
| Interventionsb | 1,102 | |||||
| Interventions per patient | 2.1 | |||||
Notes: Sites I1, I2, and I3 = independent community pharmacies; sites C1 and C2 = community health center pharmacies. Percentages may not equal 100% due to rounding.
aThere were more patients at C1 with missing preventative screenings than at I1 (P < 0.001), I2 (P < 0.001), I3 (P = 0.001), and C2 (P < 0.0001).
bSum of the following numbers: patients provided education on management of hypoglycemia (105); preventative screenings recommended (225); administration errors corrected (3); referrals to community health programs (42) or promotoras (7); medications on Beers List referred to prescriber (50); vaccine recommendations made (pneumonia: 247, shingles: 231, flu: 146); and adherence consults conducted with those who missed a dose more than 6 times per 30 days (46).
DM = diabetes mellitus; NA = not applicable.
Discussion
Patient acceptance of MTM services was very high (93.6%), especially when compared with previously published approaches.8 Recruitment and enrollment of program participants were conducted by the community partner sites, and as a result, patients may have responded more favorably to the invitation to participate. Patients were recruited to the program on a rolling basis over a 12-month period to ensure recruitment of an adequate sample of participants to enable thorough statistical outcome analysis.
General differences were observed across the rural communities, potentially attributable to variations in demographics and dispersed locations throughout the state. These variations helped strengthen the results, since they reflect the ability to successfully implement this program across geographically, racially, and ethnically diverse Arizona rural communities.
Moreover, there were significant differences in the patients recruited from each site. These differences are based on variations in geography and demographics of the respective rural communities. For example, site C2 is located in a small community near the U.S.-Mexico border, with a much larger percentage of individuals self-identifying as Hispanic/Latino. Site C2 also used promotoras as a key component of its outreach and patient care. Integration of these lay health workers in the CMR and MTM processes may help explain why this site had some of the highest resolution rates of medication-related problems and improvements trending towards significance in patient medication adherence. Conversely, the independent pharmacy sites (I1, I2, and I3), located in the eastern part of the state, had much smaller populations, which were mainly composed of older adults.
While this MTM program was generally effective in improving all patient clinical laboratory values and blood pressure readings, patients at the 2 community health center sites (C1 and C2) experienced statistically significant improvement at follow-up. In addition, the program identified and addressed 240 medication-related problems, resulting in approximately 0.46 medication-related interventions per patient. Medication-related problems were addressed via patient counseling and education, faxing the provider, contacting the pharmacy, or any other relevant intervention. Furthermore, the collaborative health care team approach resulted in identification of missing recommended preventative screenings (e.g., foot exams) and an absence of recommended vaccinations (e.g., flu and pneumonia) for almost half of the participants. Many patients were receiving care at partnering community health centers operating under the medical home model, yet a number of patients had missed recommended preventive health services.
Prescriber acceptance of pharmacist-recommended therapy varied widely for statins (27%) and beta blockers (60%). However, these rates parallel previously published prescriber acceptance rates (20%-60%) for MTM pharmacist recommendations.13,14
These program evaluation results are encouraging, since patients who received telephonic medication reviews experienced, on average, an improvement in biomarkers (e.g., FBG, PPG, and SBP/DBP), with statistically significant improvements observed at some sites. Also, the MTM pharmacists brought many recommendations regarding safety concerns and gaps in care based on national consensus guidelines to the attention of prescribers, which potentially prevented serious complications and adverse drug events.
The success of this pilot program hinged on the collaborative efforts of multiple partners (i.e., site staff members, community health workers [C2], prescribers, and centralized and community pharmacists) in fostering patient trust and acting on recommendations and concerns raised during the CMRs. This hybrid program between academia and the community demonstrated positive health outcome results, while simultaneously promoting an interprofessional and patient-centered care model. This model served as an effective method to empower and engage patients in managing their chronic conditions, as well as to increase professional trust and, thus, acceptance rates of pharmacist-recommended therapies.
Limitations
This program evaluation project has several limitations. Differences in population demographics and the number of participants recruited from each site presented challenges to collecting a sufficiently large enough sample to effectively compare data across sites. In addition, high participation rates may have been a result of respondent bias, since community sites carried out much of the patient recruitment. Furthermore, participating patients may have exhibited self-selection bias, with the potential to positively skew the results. For example, more highly motivated patients (e.g., desiring to improve their clinical and laboratory values) may have volunteered to participate. This might account for the improvement in clinical laboratory results. However, self-selection would not have unduly influenced the positive safety and preventative health results observed, since these outcomes were independent from patient motivation and relied on interventions from the prescribers.
The diversity across sites also presented challenges with regard to recruitment and retention of patients in the program’s first year to ensure thorough statistical outcome analyses. The 12-month recruitment period to achieve an adequate sample of patients may have contributed to the higher observed attrition rates. A total of 131 cases (25%) were lost to follow-up and excluded from the pilot results.
Conclusions
MTM has demonstrably improved therapeutic, safety, economic, and humanistic health outcomes,4-7 yet barriers remain that affect optimal participation. The novel pilot program described here addressed some of the existing barriers by implementing an interprofessional, collaborative partnership between an academic institution and community-based pharmacies (independent retail pharmacies and community health center pharmacies) serving rural residents. Research has consistently demonstrated that individuals in rural settings suffer worse health outcomes than their urban dwelling peers.19,20 A multitude of factors contribute to this problem, including smaller and less comprehensive health care facilities and shortages of primary and specialist care providers. Moreover, rural populations tend to have older residents, are more socioeconomically disadvantaged, and are becoming more racially and ethnically diverse.31 Policies and programs aimed at addressing the disparities between rural and urban dwellers have encouraged partnerships between academic health centers and rural communities.
This pilot program exemplified the benefits of such collaborative efforts, not only with the improvement of patient health indicators, but also in above average patient participation rates in MTM services. However, future research is warranted to study clinical outcomes, as well as prescriber and patient acceptance rates, that result from this type of collaborative MTM intervention model compared with usual care. Larger scale studies, using an integrated approach to MTM services for rural patients, have the potential to positively affect and improve current public health models as a result of reducing medication-related problems and increasing use of preventive services, which ultimately improves patient safety and outcomes and reduces health care costs. This combined approach of integrating a large-scale, interprofessional telephonic- and community-based pharmacist approach in provision of MTM services for underserved populations in rural Arizona may conceivably represent a novel opportunity to vastly improve patient and prescriber participation in the delivery of this vital health care service.
ACKNOWLEDGMENTS
The authors acknowledge and thank Ana K. Ramirez, PharmD candidate; Allison Buhl, PharmD; and Miranda Fair, MBA, for their contributions.
REFERENCES
- 1.American Pharmacists Association, National Association of Chain Drug Stores Foundation . Medication therapy management in pharmacy practice: core elements of an MTM service model (version 2.0). J Am Pharm Assoc (2003). 2008;48(3):341-53. [DOI] [PubMed] [Google Scholar]
- 2.Medicare Prescription Drug, Improvement, and Modernization Act of 2003 . 1st ed. 108th Cong. 2004. Available at: https://www.congress.gov/bill/108th-congress/house-bill/1. Accessed January 8, 2018.
- 3.Centers for Medicare & Medicaid Services . 2016 Medicare Part D medication therapy management (MTM) programs. Fact sheet. Summary of 2016 programs. Available at: https://www.cms.gov/Medicare/Prescription-Drug-Coverage/PrescriptionDrugCovContra/Downloads/CY2016-MTM-Fact-Sheet.pdf. Accessed January 8, 2018.
- 4.Crano CW, Buntin BA, Christensen DB. The Asheville project: long-term clinical and economic outcomes of a community pharmacy diabetes care program. J Am Pharm Assoc (Wash). 2003;43(2):173-84. [DOI] [PubMed] [Google Scholar]
- 5.Isetts BJ, Schondelmeyer SW, Artz MB, et al. . Clinical and economic outcomes of medication therapy management services: the Minnesota experience. J Am Pharm Assoc (2003). 2008;48(2):203-14. [DOI] [PubMed] [Google Scholar]
- 6.Ward MA, Xu Y. Pharmacist-provided telephonic medication therapy management in an MAPD plan. Am J Manag Care. 2011;17(10):399-409. [PubMed] [Google Scholar]
- 7.Ramalho de Oliveira D, Brummel AR, Miller DB. Medication therapy management: 10 years of experience in a large integrated health care system. J Manag Care Pharm. 2010;16(3):185-95. Available at: http://www.jmcp.org/doi/10.18553/jmcp.2010.16.3.185. [DOI] [PMC free article] [PubMed] [Google Scholar]
- 8.Miller DE, Roane TE, Salo JA, Hardin HC. Evaluation of comprehensive medication review completion rates using 3 patient outreach models. J Manag Care Spec Pharm. 2016;22(7):796-800. Available at: http://www.jmcp.org/doi/10.18553/jmcp.2016.22.7.796. [DOI] [PMC free article] [PubMed] [Google Scholar]
- 9.Oladapo AO, Rascati KL. Review of survey articles regarding medicationtherapy management (MTM) services/programs in the United States. J Pharm Prac. 2012; 25(4):457-70. [DOI] [PubMed] [Google Scholar]
- 10.Smith M, Cannon-Breland ML, Spiggle S. Consumer, physician, and payer perspectives on primary care medication management services with a shared resource pharmacists network. Res Social Adm Pharm. 2014;10(3):539-53. [DOI] [PubMed] [Google Scholar]
- 11.Duocette WR, Zhang Y, Chrischilles EA, et al. . Factors affecting Medicare Part D beneficiaries’ decision to receive comprehensive medication reviews. J Am Pharm Assoc (2003). 2013;53(5):482-87. [DOI] [PubMed] [Google Scholar]
- 12.Hurwitz JT, Grizzle AJ, Augustine J, Rehfeld R, Wild A, Abraham I. Accepting medication therapy management recommendations to add ACEIs or ARBs in diabetes care. J Manag Care Spec Pharm. 2016;22(1):40-48. Available at: http://www.jmcp.org/doi/10.18553/jmcp.2016.22.1.40. [DOI] [PMC free article] [PubMed] [Google Scholar]
- 13.Perera PN, Guy MC, Sweaney AM, Boesen KP. Evaluation of prescriber responses to pharmacist recommendations communicated by fax in a medication therapy management program (MTMP). J Manag Care Pharm. 2011;17(5):345-54. Available at: http://www.jmcp.org/doi/10.18553/jmcp.2011.17.5.345. [DOI] [PMC free article] [PubMed] [Google Scholar]
- 14.Michaels NM, Jenkins GF, Pruss DL, Heidrick JE, Ferreri SP. Retrospective analysis of community pharmacists’ recommendations in the North Carolina Medicaid medication therapy management program. J Am Pharm Assoc (2003). 2010;50(3):347-53. [DOI] [PubMed] [Google Scholar]
- 15.McGrath SH, Snyder M, Duenas GG, Pringle JL, Smith RB, McGivney MS. Physician perceptions of pharmacist-provided medication therapy management: qualitative analysis. J Am Pharm Assoc (2003). 2010;50(1):67-71. [DOI] [PubMed] [Google Scholar]
- 16.Huet AL, Frail CK, Lake LM, Snyder ME. Impact of passive and active promotional strategies on patient acceptance of medication therapy management services. J Am Pharm Assoc (2003). 2015;55(2):178-81. [DOI] [PubMed] [Google Scholar]
- 17.Christensen DB. Evaluation of a pilot medication therapy management project within the North Carolina state health plan. J Am Pharm Assoc (2003). 2007;47(4):471-83. [DOI] [PubMed] [Google Scholar]
- 18.Rosenthal M, Holmes E, Banahan B. Making MTM implementable and sustainable in community pharmacy: is it time for a different game plan? Res Social Adm Pharm. 2016;12(3):523-28. [DOI] [PubMed] [Google Scholar]
- 19.Bauerlein V. Rural hospitals feel the pinch: financially strapped facilities squeezed further by Medicare changes, dwindling government subsidies. The Wall Street Journal. May 11, 2014. Available at: https://www.wsj.com/articles/rural-hospitals-feel-pinch-1399852667. Accessed January 8, 2018.
- 20.Singh GK, Siahpush M. Widening rural-urban disparities in life expectancy, U.S., 1969-2009. Am J Prevent Med. 2014;46(2):19-29. [DOI] [PubMed] [Google Scholar]
- 21.Arizona State Legislature . Rural health professions program; definition. Arizona Revised Statute §15-1754. Available at: http://www.azleg.gov/viewdocument/?docName=http://www.azleg.gov/ars/15/01754.htm. Accessed January 8, 2018.
- 22.U.S. Department of Health and Human Services . The Secretary’s Advisory Committee on National Health Promotion and Disease Prevention Objectives for 2020. Phase I report: recommendations for the framework and format of Healthy People 2020. October 28, 2008. Available at: https://www.healthypeople.gov/sites/default/files/PhaseI_0.pdf. Accessed January 8, 2018.
- 23.American Diabetes Association . Standards of medical care in diabetes-2014. Diabetes Care. 2014;37(Suppl 1):S14-S80. [DOI] [PubMed] [Google Scholar]
- 24.Stone NJ, Robinson JG, Lichtenstein AH, et al. . 2013 ACC/AHA guideline on the treatment of blood cholesterol to reduce atherosclerotic cardiovascular risk in adults: a report of the American College of Cardiology/American Heart Association Task Force on Practice Guidelines. J Am Coll Cardiol. 2014;63(25 Pt B):2889-934. [DOI] [PubMed] [Google Scholar]
- 25.Yancy CW, Jessup M, Bozkurt B, et al. . 2013 ACCF/AHA guideline for the management of heart failure: a report of the American College of Cardiology Foundation/American Heart Association Task Force on Practice Guidelines. J Am Coll Cardiol. 2013;62(16):e147-239. [DOI] [PubMed] [Google Scholar]
- 26.O’Gara PT, Kushner FG, Ascheim DD, et al. . 2013 ACCF/AHA guideline for the management of ST-elevation myocardial infarction: executive summary: a report of the American College of Cardiology Foundation/American Heart Association Task Force on Practice Guidelines. J Am Coll Cardiol. 2013;61(4):485-510. [DOI] [PubMed] [Google Scholar]
- 27.Amsterdam EA, Wenger NK, Brindis RG, et al. . 2014 AHA/ACC guideline for the management of patients with non–ST-elevation acute coronary syndromes: a report of the American College of Cardiology/American Heart Association Task Force on Practice Guidelines. J Am Coll Cardiol. 2014;64(24):e139-e228. [DOI] [PubMed] [Google Scholar]
- 28.Global Initiative for Chronic Obstructive Lung Disease. GOLD 2017 global strategy for the diagnosis, management, and prevention of COPD. Available at: http://goldcopd.org/gold-2017-global-strategy-diagnosis-management-prevention-copd/. Accessed January 8, 2018.
- 29.Global Initiative for Asthma. 2017 GINA report. Global strategy for asthma management and prevention. Available at: http://ginasthma.org/2017-gina-report-global-strategy-for-asthma-management-and-prevention/. Accessed January 8, 2018.
- 30.The American Geriatrics Society 2015 Beers Criteria Update Expert Panel. American Geriatrics Society 2015 Updated Beers Criteria for Potentially Inappropriate Medication Use in Older Adults. J Am Geriatr Soc. 2015;63(11):2227-46. [DOI] [PubMed] [Google Scholar]
- 31.Gazewood JD, Rollins LK, Falazka, SS. Beyond the horizon: the role of academic health centers in improving the health of rural communities. Acad Med. 2006;81(9):793-97. [DOI] [PubMed] [Google Scholar]