

Abstract
BACKGROUND:
Opioid pain relievers can be highly effective in providing relief for patients suffering from pain. At the same time, prescription opioid abuse, dependence, overdose, and poisoning (hereinafter “abuse”) have become a national public health concern. Opioid abuse is also costly: previous estimates of the annual excess costs of opioid abuse to payers range from approximately $10,000 to $20,000 per patient.
OBJECTIVES:
To (a) provide a comprehensive, current estimate of the economic burden of opioid abuse to commercial payers and (b) explore the drivers of these excess costs of abuse.
METHODS:
Administrative claims from beneficiaries covered by large self-insured companies throughout the United States were used to identify patients diagnosed with opioid abuse, dependence, and overdose/poisoning (“abuse”) between 2012 and 2015. Sample selection criteria identified patients most likely to be misusing opioids. Abusers and nonabuser controls were matched using propensity scores. Excess health care costs were assessed over the 18-month study period. Drivers of excess costs were then evaluated by place of service and medical condition (identified as 3-digit ICD-9-CM groupings).
RESULTS:
9,342 matched abuser/nonabuser pairs were analyzed. Relative to nonabusers, abusers had significantly higher annual health care resource utilization, leading to $14,810 in per-patient incremental annual health care costs. Excess costs began accumulating 5 months before the formal, incident diagnosis of abuse, driven by alcohol and nonopioid substance abuse. Major drivers of excess costs of abuse included opioid and other substance abuse disorders, mental health conditions, and painful conditions. Many patients had diagnoses for other substance abuse that predated their opioid abuse diagnoses.
CONCLUSIONS:
Opioid abuse imposes a substantial economic burden on payers and often occurs in the context of other substance abuse. Poly-substance abuse often precedes the diagnosis of opioid abuse.
What is already known about this subject
Opioid pain relievers can provide relief for patients with chronic pain.
The health care burden of opioid abuse, dependence, or overdose/poisoning is substantial, adding an additional $10,000 to $20,000 in annual medical costs.
What this study adds
This retrospective claims database study of commercially insured patients showed that those diagnosed with abuse incur annual excess health care costs of over $14,000 relative to matched nonabuser controls, resulting in a substantial burden to commercial payers.
Excess costs begin accumulating before the formal, incident diagnosis of abuse, peak during the month of the diagnosis, then begin to decline shortly thereafter.
Analysis of the primary cost drivers suggests that many abuse patients are polysubstance abusers and incur substantial excess costs due to other substance abuse before their first diagnosis of opioid abuse.
The Institute of Medicine reports that nearly 100 million Americans live with chronic pain.1 The estimated annual cost of chronic pain is $560 to $635 billion per year, including $261 to $300 billion in direct medical costs—more than the yearly costs of cancer ($243 billion per year) and heart disease ($309 billion per year).2 Medical costs are diverse, including procedures and surgeries, pharmaceutical interventions ranging from analgesics to antidepressants, and many adjunctive treatments such as chiropracty and psychotherapy.3,4
For moderate to severe pain, opioids can provide significant symptom relief. They are widely utilized: 207 million prescriptions were dispensed in the United States in 2013.5 However, the prescription of opioid medications must be done with a close eye on the potential for misuse, abuse, and diversion. The 2015 National Survey on Drug Use and Health found that, in the past year, approximately 12.5 million people, or 4.7% of the population 12 and older, misused prescription pain relievers.6 Indeed, the direct medical costs of opioid abuse have been estimated at $25 billion per year in 20077 and thus constitute approximately 6% of all substance abuse treatment costs.8 Previous studies have demonstrated that a diagnosis of opioid abuse, dependence, overdose, and poisoning (hereinafter, “abuse”) adds an additional $10,000 to $20,000 in annual medical costs.9-11 While these seminal studies advanced the understanding of the costs of opioid abuse, they had acknowledged limitations. Cost was broadly defined by point of service, patients were excluded who lacked sufficient baseline and follow-up coverage, and cost data were allocated by 6-month observation periods. To further elucidate the economic burden of opioid abuse for commercial payers, we increased the depth of analysis to include International Classification of Diseases, Ninth Revision, Clinical Modification (ICD-9-CM) codes within place of service; we conducted analyses removing continuous eligibility requirements; and we defined costs monthly over an 18-month period anchored around incident abuse diagnosis.
Methods
Data
We used deidentified administrative claims data from OptumHealth Care Solutions, containing over 18 million commercially insured beneficiaries (employees, spouses, children, and retirees) of 84 large self-insured companies representing a variety of industries and job types, with locations across the United States. The data include medical claims (date of service, diagnoses received, procedures performed, place of service, and payment amounts), pharmacy claims (fill dates, National Drug Code numbers, and payment amounts), and eligibility information (patient demographics and enrollment history).
Sample Selection
Two mutually exclusive cohorts of incident opioid abusers and nonabusers were defined. All patients, both abusers and nonabusers, were required to be ages 18-64 and continuously eligible in non-health maintenance organization (HMO) plans throughout the study period. The data do not contain full visibility of patient costs for those in HMO or capitated plans. Similarly, patients over age 65 may also be covered under Medicare plans and it is not possible to know if they may have Medicare plans to which their claims are billed; given that this may systematically affect patients 65 and older, we chose to exclude them.
For the period January 2012 to March 2015, opioid abuse was identified in the medical claims using ICD-9-CM codes for opioid abuse, dependence, or overdose/poisoning (patients with any of these diagnoses and meeting other selection criteria are hereafter referred to as abusers): 304.0x (opioid type dependence), 304.7x (combinations of opioid type drug with any other drug dependence), 305.5x (nondependent opioid abuse), 965.00 (poisoning by opium [alkaloids], unspecified), 965.02 (poisoning by methadone), and 965.09 (poisoning by other opiates and related narcotics).10 We excluded patients with incident codes 304.03 (opioid type dependence, in remission), 304.73 (combinations of opioid type drug with any other drug dependence, in remission), and 305.53 (opioid abuse, in remission), which indicated patients were in remission. The study inclusion criteria were modeled after the Diagnostic and Statistical Manual of Mental Disorders, Fifth Edition (DSM-V) update,12 which combined substance abuse and substance dependence into a single category, “substance use disorder.” Important for this study, tolerance and withdrawal criteria are excluded “for those taking opioids solely under appropriate medical supervision.” 13 In the spirit of these changes, we excluded patients who had only a single outpatient diagnosis claim of substance dependence and who received a prescription opioid from a health care provider in the previous 6 months. To further ensure that the diagnosis of opioid use disorder was an incident diagnosis, we excluded patients prescribed medications whose primary purpose is the treatment of opioid dependence: methadone or buprenorphine (excluding transdermal patches) during the baseline period.
Nonabusers are defined as patients with no history of abuse diagnoses. The OptumHealth Care Solutions data range from 1999 to 2015; as such, we were able to look back as far as 1999 to assess whether patients had histories of abuse. A random 25% sample of nonabusers was selected because the population of potential controls for matching was so much larger than that of abusers. Given the concern that undiagnosed abusers may be included, we excluded any nonabusers if they used methadone or buprenorphine (excluding transdermal patches) during the 6-month baseline period.
The incident abuser cohort was defined by the first code for opioid abuse11 during the period January 2012 to March 2015, using available claims as far back as January 1999 to exclude prevalent patients. The incident date for nonabuser controls was a randomly selected claim occurring during the same period. Figure 1 shows the period of observation and sample selection.
FIGURE 1.
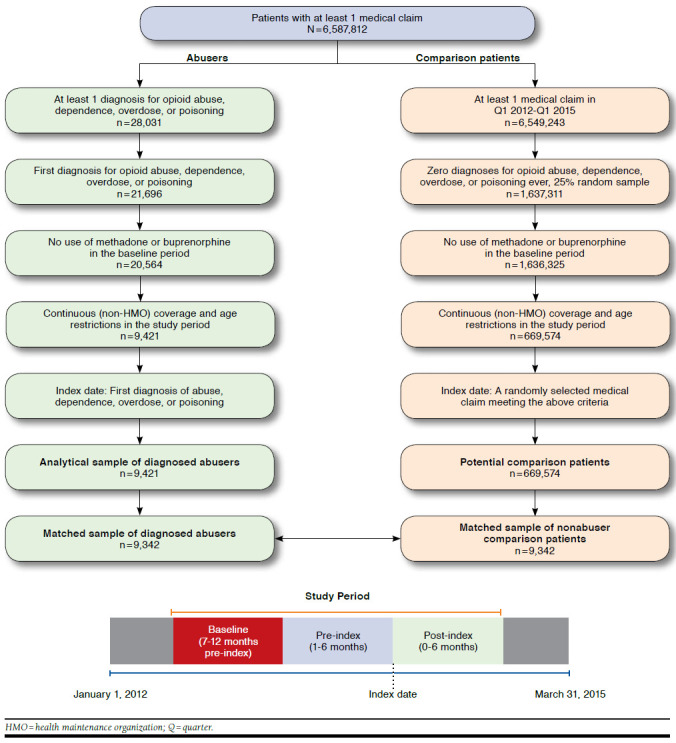
Study Period and Sample Selection
In the primary analysis, each individual was observed over a 12- to 18-month period. The period 7 to 12 months before incident abuse diagnosis defined the baseline, and those data were used for propensity score matching. The period 1 to 6 months before incident abuse was used to determine if incremental costs were incurred before the incident event. Months 0 to 6 after incident diagnosis were used to define costs associated with the abuse episode itself.
Baseline Characteristics and Propensity Score Matching
Propensity score matching was used to match the abusers and nonabusers to account for confounding factors associated with health care costs. We used an extensive list of baseline variables in the propensity score model, including the following:
Demographic: Age, gender, U.S. census division, employment status of the primary beneficiary, patient’s relationship to the primary beneficiary, the year of a patient’s index date, and the duration of continuous insurance coverage following the index date;
Clinical: Components of the Charlson Comorbidity Index (e.g., congestive heart failure, dementia, and cancer), baseline comorbidities known to be associated with opioid abuse (e.g., nonopioid substance abuse, painful conditions, and mental health disorders), musculoskeletal surgeries; and
Health care resource utilization: Days hospitalized; days with an emergency department (ED) visit; days spent in a rehabilitation facility; prescription drug use, in particular extended-release and immediate-release opioids; nonsteroidal anti-inflammatory drugs; and muscle relaxants.
Clinical and health care resource use variables were assessed in the 7-12 months before the incident abuse diagnosis. A complete list of baseline characteristics can be found in Appendix A (available in online article).
Propensity scores were estimated using logistic regression. Following propensity score estimation, abusers were matched 1-to-1 to nonabuser controls based on propensity scores ±¼ standard deviation using greedy matching.14 Baseline characteristics for the postmatched samples were computed to verify the quality of the match. Full details of the propensity score matching (including covariates used in constructing propensity scores) are provided in Appendix B (available in online article).
Outcomes
We compared abusers and nonabusers in terms of health care costs at baseline (7-12 months before the incident index diagnosis), pre-index (months 1-6 before the index event), and post-index (0-6 months following the index event). Herein, costs refer to the insurer-paid amounts reflected on the claims. Medical costs were categorized by place of service: inpatient, ED, outpatient/other (e.g., skilled nursing facilities), and rehabilitation facilities (costs attributed to rehabilitation facilities include those for care received in inpatient and outpatient substance abuse facilities and treatment received for other, non-substance abuse-related conditions). All costs were adjusted to 2015 U.S. dollars. Top diagnoses contributing to the excess medical costs were reported by 3-digit ICD-9-CM groupings and place of service.
Sensitivity Analyses
Patients in the primary analyses were required to have 12 months of pre-index event coverage. In order to determine whether this requirement biased the analysis, we ran sensitivity analyses on 2 additional samples: (1) patients with 6-12 months of pre-index coverage and (2) patients with < 6 months of pre-index coverage.
For the 6- to 12-month group, a propensity score match was performed including the same set of covariates as the main analyses. For the group with < 6 months of coverage, only demographic variables were included. Detailed information on these analyses is available upon request.
Results
Cohort Characteristics
The analytic sample contained 9,421 abusers and 669,574 nonabuser controls (25% random sample of nonabusers). The propensity score procedure successfully matched 9,342 abusers for a 99% match. Table 1 compares baseline characteristics between the unmatched and matched samples. Postmatching, there were only 2 variables that differed in any meaningful way. Nonabusers were more likely than abusers to be the child of primary beneficiary (37.9% vs. 34.9%), and abusers had 5% higher baseline health care costs than nonabusers ($7,969 vs. $7,562; $407 over 6 months).
TABLE 1.
| Unmatched Sample | Matched Sample | |||||
|---|---|---|---|---|---|---|
| Abusers | Controls | P Value | Abusers | Controls | P Value | |
| Total patients, n (%) | 9,421 (100.0) | 669,574 (100.0) | – | 9,342 (100.0) | 9,342 (100.0) | – |
| Patient characteristicsc | ||||||
| Age, mean (SD) | 37.1 (14.4) | 43.6 (13.2) | < 0.001 | 37.1 (14.4) | 36.5 (14.5) | 0.001 |
| Male, n (%) | 5,437 (57.7) | 317,589 (47.4) | < 0.001 | 5,389 (57.7) | 5,507 (58.9) | 0.063 |
| Employee status of primary beneficiary, n (%) | ||||||
| Active | 6,356 (67.5) | 464,708 (69.4) | < 0.001 | 6,306 (67.5) | 6,316 (67.6) | 0.867 |
| Retirement/early retirement | 1,188 (12.6) | 72,225 (10.8) | < 0.001 | 1,175 (12.6) | 1,175 (12.6) | 1.000 |
| Short-term disability/long-term disability | 397 (4.2) | 25,507 (3.8) | 0.042 | 390 (4.2) | 352 (3.8) | 0.135 |
| Leave of absence | 360 (3.8) | 10,382 (1.6) | < 0.001 | 356 (3.8) | 366 (3.9) | 0.703 |
| Otherd | 166 (1.8) | 7,724 (1.2) | < 0.001 | 162 (1.7) | 177 (1.9) | 0.404 |
| Unknown | 954 (10.1) | 89,028 (13.3) | < 0.001 | 953 (10.2) | 956 (10.2) | 0.938 |
| Relationship to primary beneficiary, n (%) | ||||||
| Self | 3,739 (39.7) | 397,763 (59.4) | < 0.001 | 3,710 (39.7) | 3,578 (38.3) | 0.014 |
| Child | 3,285 (34.9) | 82,073 (12.3) | < 0.001 | 3,262 (34.9) | 3,545 (37.9) | < 0.001 |
| Spouse | 2,355 (25.0) | 188,627 (28.2) | < 0.001 | 2,329 (24.9) | 2,176 (23.3) | 0.005 |
| Othere | 35 (0.4) | 929 (0.1) | < 0.001 | 35 (0.4) | 36 (0.4) | 0.906 |
| Unknown | 7 (0.1) | 182 (0.0) | 0.017 | 6 (0.1) | 7 (0.1) | 0.782 |
| Selected comorbidities, n (%) | ||||||
| Nonopioid substance abuse | 1,094 (11.6) | 7,798 (1.2) | < 0.001 | 1,049 (11.2) | 972 (10.4) | 0.048 |
| Major depressive disorder | 843 (8.9) | 13,503 (2.0) | < 0.001 | 824 (8.8) | 771 (8.3) | 0.152 |
| Other psychosis | 767 (8.1) | 7,713 (1.2) | < 0.001 | 736 (7.9) | 716 (7.7) | 0.569 |
| Other mental disorder | 2,751 (29.2) | 55,841 (8.3) | < 0.001 | 2,700 (28.9) | 2,728 (29.2) | 0.623 |
| Headache | 798 (8.5) | 22,490 (3.4) | < 0.001 | 779 (8.3) | 733 (7.8) | 0.212 |
| Neuropathic pain | 743 (7.9) | 18,627 (2.8) | < 0.001 | 725 (7.8) | 714 (7.6) | 0.758 |
| Arthropathies and related disorders (excluding osteoarthritis and rheumatoid arthritis) | 1,691 (17.9) | 54,721 (8.2) | < 0.001 | 1,663 (17.8) | 1,630 (17.4) | 0.511 |
| Rheumatoid arthritis | 37 (0.4) | 867 (0.1) | < 0.001 | 35 (0.4) | 32 (0.3) | 0.714 |
| Osteoarthritis | 588 (6.2) | 19,286 (2.9) | < 0.001 | 579 (6.2) | 548 (5.9) | 0.338 |
| Back/neck pain | 3,109 (33.0) | 80,215 (12.0) | < 0.001 | 3,050 (32.6) | 3,007 (32.2) | 0.456 |
| Rheumatism, excluding the back (excludes fibromyalgia, neuralgia) | 1,571 (16.7) | 58,299 (8.7) | < 0.001 | 1,546 (16.5) | 1,514 (16.2) | 0.511 |
| Abdominal pain | 1,163 (12.3) | 31,485 (4.7) | < 0.001 | 1,137 (12.2) | 1,088 (11.6) | 0.257 |
| Chronic pain | 424 (4.5) | 1,598 (0.2) | < 0.001 | 392 (4.2) | 327 (3.5) | 0.010 |
| Other pain | 445 (4.7) | 1,929 (0.3) | < 0.001 | 417 (4.5) | 370 (4.0) | 0.073 |
| Baseline health care resource use, mean (SD) | ||||||
| Inpatient days | 0.7 (4.3) | 0.1 (1.7) | < 0.001 | 0.7 (4.3) | 0.7 (5.1) | 0.004 |
| Emergency department visits | 0.7 (1.6) | 0.2 (0.6) | < 0.001 | 0.7 (1.6) | 0.6 (1.6) | < 0.001 |
| Rehabilitation facility days | 0.3 (3.6) | 0.0 (1.1) | < 0.001 | 0.3 (3.5) | 0.3 (4.2) | 0.001 |
| Outpatient/other visits | 8.2 (11.0) | 4.1 (6.5) | < 0.001 | 8.1 (10.9) | 7.9 (10.2) | 0.360 |
| Selected musculoskeletal surgeries, n (%) | ||||||
| Hip | 19 (0.2) | 339 (0.1) | < 0.001 | 18 (0.2) | 19 (0.2) | 0.869 |
| Knee | 35 (0.4) | 618 (0.1) | < 0.001 | 32 (0.3) | 29 (0.3) | 0.701 |
| Shoulder | 14 (0.1) | 208 (0.0) | < 0.001 | 14 (0.1) | 13 (0.1) | 0.847 |
| Spine | 85 (0.9) | 898 (0.1) | < 0.001 | 82 (0.9) | 93 (1.0) | 0.406 |
| Number of prescriptions filled, mean (SD) | 14.8 (17.3) | 5.7 (8.4) | < 0.001 | 14.6 (17.1) | 14.0 (17.7) | < 0.001 |
| Number of unique NDCs filled,f mean (SD) | 7.0 (7.4) | 3.1 (3.9) | < 0.001 | 6.9 (7.3) | 6.7 (7.1) | 0.095 |
| Any use of selected classes of pain relievers, n (%) | ||||||
| Opioid analgesics | ||||||
| Immediate release | 4,352 (46.2) | 78,917 (11.8) | < 0.001 | 4,279 (45.8) | 4,272 (45.7) | 0.897 |
| Extended release | 1,083 (11.5) | 3,373 (0.5) | < 0.001 | 1,036 (11.1) | 927 (9.9) | 0.003 |
| Antianxiety medications | 2,910 (30.9) | 49,454 (7.4) | < 0.001 | 2,843 (30.4) | 2,791 (29.9) | 0.339 |
| Any use of selected classes of pain relievers, n (%) | ||||||
| Antidepressants | 3,383 (35.9) | 87,739 (13.1) | < 0.001 | 3,320 (35.5) | 3,308 (35.4) | 0.837 |
| Antiepileptics | 1,590 (16.9) | 23,648 (3.5) | < 0.001 | 1,544 (16.5) | 1,490 (15.9) | 0.249 |
| Muscle relaxants | 1,761 (18.7) | 29,773 (4.4) | < 0.001 | 1,716 (18.4) | 1,699 (18.2) | 0.730 |
| Other pain relieversg | 904 (9.6) | 15,178 (2.3) | < 0.001 | 876 (9.4) | 859 (9.2) | 0.661 |
| Baseline health care costs,h mean (SD) $ | 8,182 (27,539) | 2,502 (11,926) | < 0.001 | 7,969 (26,714) | 7,562 (24,087) | 0.036 |
aThe index date for abusers was defined as the date of first diagnosis of abuse, dependence, or poisoning/overdose in Q1 2012-Q1 2015. The index date for controls was defined as a random medical claim in Q1 2012-Q1 2015.
bP values were calculated using Wilcoxon rank sum tests for continuous variables and chi-squared tests for categorical variables.
cPatient characteristics were evaluated on the index date.
dOther statuses include terminated, COBRA, surviving dependent, deceased, summarized, mixed status, coverage cancelled, and temporary employee.
eOther relationships include sponsored, class II dependent, and handicapped.
fIdentified using 9-digit NDC numbers.
gOther pain relievers include tramadol, butorphanol, pentazocine, nalbuphine, and dihydrocodeine.
hHealth care costs were inflated to 2015 values using the medical care component of the Consumer Price Index.
NDC = National Drug Code; SD = standard deviation.
Costs of Abuse
Figure 2 shows mean excess costs by month before and after patients’ first abuse diagnoses. During the baseline period (7-12 months before the incident diagnosis), monthly excess costs ranged from -$2 to $199 per month. Incremental costs in the abuser cohort rose during the 5 months before the incident event, from $254 five months before to $1,119 one month before abuse diagnosis. Excess costs peaked in the month of the incident diagnosis at $6,010, and while they decreased in subsequent months, they continued to be elevated between $954 and $931 in months 5 and 6 post-diagnosis.
FIGURE 2.
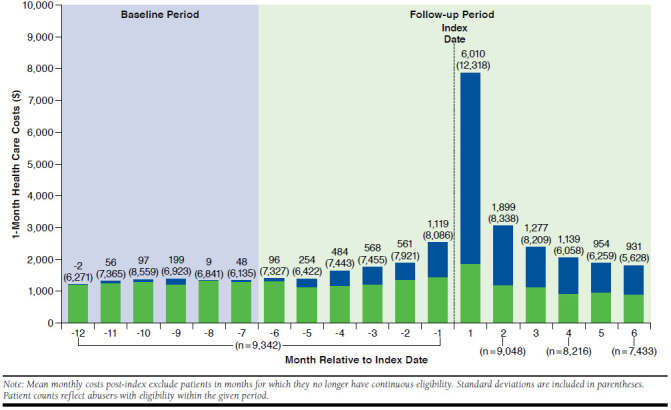
Mean Excess Health Care Costs by Month During the 18-Month Study Period
Table 2 shows the costs of abusers versus controls in the 6-month baseline, pre-index, and post-index time periods, segmented by point of service and showing leading ICD-9-CM codes contributing to incremental costs. As previously mentioned, there were $407 in incremental costs in abusers in the 6-month baseline period. Inpatient (-$26) and outpatient (-$99) costs were lower among abusers. Costs incurred at rehabilitation facilities, including but not limited to substance-use related conditions, were higher (+ $191), largely driven by arthropathy (+ $116). ED costs (+ $326) were higher among abusers, but there were no clear drivers. Thus, though overall baseline costs were higher, this appears to be random variance.
TABLE 2.
| Baseline (-12 to -6 Months Relative to Index Date) | ||||
|---|---|---|---|---|
| Baseline Costse | Abusers | Controls | Excessf | |
| (N = 9,342) | ||||
| [A] mean (SD), $ | [B] mean (SD), $ | [A] - [B] mean, $ | ||
| Total health care costs | 7,969 (26,714) | 7,562 (24,087) | 407 | |
| Inpatient costs (total) | 1,882 (14,059) | 1,908 (15,287) | -26 | |
| 722.xx | Intervertebral disc disorders | 152 (3,094) | 95 (1,845) | 56 |
| 996.xx | Complications peculiar to certain specified procedures | 85 (1,929) | 45 (1,245) | 40 |
| 721.xx | Spondylosis and allied disorders | 67 (1,823) | 28 (1,237) | 39 |
| 038.xx | Septicemia | 62 (2,336) | 23 (771) | 39 |
| 737.xx | Curvature of spine | 48 (4,439) | 14 (801) | 34 |
| 304.xxg | Drug dependence (excluding opioids) | 29 (777) | 3 (134) | 26 |
| 250.xx | Diabetes mellitus | 31 (970) | 7 (274) | 25 |
| 560.xx | Intestinal obstruction without mention of hernia | 28 (1,507) | 6 (245) | 22 |
| 577.xx | Diseases of pancreas | 27 (1,168) | 7 (266) | 20 |
| 276.xx | Disorders of fluid electrolyte and acid-base balance | 38 (848) | 18 (981) | 20 |
| ED costs (total) | 1,455 (9,048) | 1,129 (7,064) | 326 | |
| 038.xx | Septicemia | 37 (1,267) | 11 (369) | 26 |
| 276.xx | Disorders of fluid electrolyte and acid-base balance | 39 (631) | 16 (270) | 23 |
| 250.xx | Diabetes mellitus | 27 (735) | 5 (118) | 22 |
| 789.xx | Other symptoms involving abdomen and pelvis | 89 (997) | 68 (709) | 21 |
| 518.xx | Other diseases of lung | 47 (1,078) | 28 (1,370) | 19 |
| 997.xx | Complications affecting specified body system not elsewhere classified | 22 (1,680) | 3 (227) | 19 |
| 780.xx | General symptoms | 58 (957) | 40 (381) | 19 |
| 567.xx | Peritonitis and retroperitoneal infections | 19 (1,678) | 0 (15) | 18 |
| 574.xx | Cholelithiasis | 22 (990) | 6 (199) | 16 |
| 787.xx | Symptoms involving digestive system | 32 (395) | 21 (240) | 11 |
| Rehabilitation facility costs (total) | 276 (11,553) | 85 (1,648) | 191 | |
| 711.xx | Arthropathy associated with infections | 117 (11,290) | 1 (59) | 116 |
| 304.xxg | Drug dependence (excluding opioids) | 64 (1,356) | 8 (447) | 56 |
| 303.xx | Alcohol dependence syndrome | 43 (1,114) | 23 (716) | 20 |
| 722.xx | Intervertebral disc disorders | 5 (464) | 0 (8) | 5 |
| 291.xx | Alcohol-induced mental disorders | 4 (245) | 1 (43) | 3 |
| 296.xx | Episodic mood disorders | 7 (287) | 4 (285) | 3 |
| 277.xx | Other and unspecified disorders of metabolism | 3 (158) | 0 (18) | 3 |
| V71.xx | Observation and evaluation for suspected conditions not found | 3 (107) | 1 (52) | 3 |
| 300.xx | Anxiety, dissociative and somatoform disorders | 3 (171) | 1 (60) | 2 |
| 311.xx | Depressive disorder, not elsewhere classified | 2 (176) | 1 (53) | 1 |
| Outpatient/other costs (total) | 2,980 (8,805) | 3,079 (9,295) | -99 | |
| 304.xxg | Drug dependence (excluding opioids) | 76 (1,937) | 5 (112) | 72 |
| 303.xx | Alcohol dependence syndrome | 69 (1,217) | 16 (367) | 53 |
| 724.xx | Other and unspecified disorders of back | 198 (1,966) | 148 (1,232) | 50 |
| 722.xx | Intervertebral disc disorders | 158 (2,481) | 113 (1,152) | 46 |
| 721.xx | Spondylosis and allied disorders | 90 (1,019) | 54 (869) | 36 |
| V58.xx | Encounter for other and unspecified procedures and aftercare | 101 (1,717) | 72 (1,129) | 29 |
| 389.xx | Hearing loss | 17 (1,151) | 4 (105) | 13 |
| 738.xx | Other acquired musculoskeletal deformity | 15 (1,036) | 3 (127) | 12 |
| 146.xx | Malignant neoplasm of oropharynx | 13 (1,018) | 3 (271) | 10 |
| 401.xx | Essential hypertension | 33 (305) | 23 (166) | 10 |
| Prescription drug costs | 1,376 (5,567) | 1,361 (4,164) | 15 | |
| Pre-index (-6 to 0 Months Relative to Index Date) | ||||
| Pre-index Costse | Abusers | Controls | Excessf | |
| (N = 9,342) | ||||
| [A] mean (SD), $ | [B] mean (SD), $ | [A] - [B] mean, $ | ||
| Total health care costs | 10,632 (30,743) | 7,548 (25,798) | 3,084 | |
| Inpatient costs (total) | 2,647 (18,339) | 1,918 (17,375) | 729 | |
| 303.xx | Alcohol dependence syndrome | 96 (1,287) | 7 (282) | 89 |
| 518.xx | Other diseases of lung | 115 (3,772) | 33 (1,067) | 82 |
| 304.xxg | Drug dependence (excluding opioids) | 72 (1,189) | 4 (204) | 67 |
| 998.xx | Other complications of procedures not elsewhere classified | 57 (1,691) | 16 (595) | 41 |
| 296.xx | Episodic mood disorders | 75 (803) | 37 (879) | 39 |
| 996.xx | Complications peculiar to certain specified procedures | 106 (2,501) | 71 (1,761) | 35 |
| 038.xx | Septicemia | 53 (1,668) | 18 (829) | 35 |
| 557.xx | Vascular insufficiency of intestine | 28 (2,653) | 3 (240) | 26 |
| 737.xx | Curvature of spine | 36 (1,622) | 11 (636) | 25 |
| 682.xx | Other cellulitis and abscess | 39 (1,607) | 15 (489) | 24 |
| ED costs (total) | 2,401 (12,895) | 969 (6,085) | 1,431 | |
| 789.xx | Other symptoms involving abdomen and pelvis | 115 (1,186) | 46 (512) | 69 |
| 780.xx | General symptoms | 81 (619) | 29 (284) | 52 |
| 577.xx | Diseases of pancreas | 56 (2,102) | 10 (355) | 46 |
| 305.xxg | Nondependent abuse of drugs (excluding opioids) | 56 (421) | 12 (183) | 44 |
| 518.xx | Other diseases of lung | 61 (1,601) | 17 (627) | 44 |
| 250.xx | Diabetes mellitus | 49 (1,089) | 11 (266) | 38 |
| 486.xx | Pneumonia, organism unspecified | 50 (1,579) | 17 (472) | 33 |
| 038.xx | Septicemia | 55 (1,509) | 22 (691) | 33 |
| 682.xx | Other cellulitis and abscess | 41 (709) | 10 (227) | 32 |
| 786.xx | Symptoms involving respiratory system and other chest symptoms | 69 (584) | 38 (386) | 31 |
| Rehabilitation facility costs (total) | 345 (3,380) | 71 (1,350) | 274 | |
| 304.xxg | Drug dependence (excluding opioids) | 154 (2,298) | 2 (70) | 152 |
| 303.xx | Alcohol dependence syndrome | 112 (1,465) | 10 (306) | 102 |
| 296.xx | Episodic mood disorders | 15 (572) | 4 (193) | 11 |
| V71.xx | Observation and evaluation for suspected conditions not found | 7 (222) | 0 (16) | 7 |
| 305.xxg | Nondependent abuse of drugs (excluding opioids) | 8 (429) | 2 (118) | 6 |
| 291.xx | Alcohol-induced mental disorders | 4 (149) | 0 (0) | 4 |
| 300.xx | Anxiety, dissociative and somatoform disorders | 4 (240) | 1 (61) | 3 |
| 995.xx | Certain adverse effects not elsewhere classified | 3 (177) | 0 (0) | 3 |
| 309.xx | Adjustment reaction | 2 (141) | 0 (14) | 2 |
| 790.xx | Nonspecific findings on examination of blood | 3 (177) | 1 (49) | 2 |
| Outpatient/other costs (total) | 3,728 (10,267) | 3,144 (10,393) | 584 | |
| 304.xxg | Drug dependence (excluding opioids) | 190 (2,023) | 8 (226) | 183 |
| 303.xx | Alcohol dependence syndrome | 135 (1,551) | 13 (237) | 123 |
| 724.xx | Other and unspecified disorders of back | 208 (1,540) | 133 (1,004) | 75 |
| V58.xx | Encounter for other and unspecified procedures and aftercare | 168 (2,043) | 110 (1,865) | 58 |
| 296.xx | Episodic mood disorders | 126 (865) | 82 (954) | 44 |
| 721.xx | Spondylosis and allied disorders | 89 (945) | 46 (813) | 44 |
| 338.xx | Pain, not elsewhere classified | 68 (995) | 29 (462) | 39 |
| 789.xx | Other symptoms involving abdomen and pelvis | 75 (614) | 38 (276) | 37 |
| 203.xx | Multiple myeloma and immunoproliferative neoplasms | 38 (1,466) | 9 (515) | 28 |
| 305.xxg | Nondependent abuse of drugs (excluding opioids) | 39 (497) | 12 (214) | 27 |
| Prescription drug costs | 1,511 (6,234) | 1,445 (4,934) | 66 | |
| Post-index (0 to 6 Months Relative to Index Date) | ||||
| Post-index Costse | Abusers | Controls | Excessf | |
| (N = 9,342) | ||||
| [A] mean (SD), $ | [B] mean (SD), $ | [A] - [B] mean, $ | ||
| Total health care costs | 18,086 (34,131) | 6,359 (21,848) | 11,726 | |
| Inpatient costs (total) | 4,235 (18,278) | 1,355 (12,439) | 2,880 | |
| 304.xxh | Drug dependence (opioids) | 700 (3,558) | 0 (0) | 700 |
| 304.xxg | Drug dependence (excluding opioids) | 248 (2,256) | 6 (411) | 242 |
| 303.xx | Alcohol dependence syndrome | 187 (1,714) | 15 (594) | 173 |
| 296.xx | Episodic mood disorders | 172 (1,275) | 18 (677) | 153 |
| 518.xx | Other diseases of lung | 181 (4,122) | 30 (1,336) | 151 |
| 965.xxg | Poisoning by analgesics, antipyretics, and antirheumatics (opioids) | 87 (2,045) | 0 (0) | 87 |
| 292.xx | Drug-induced mental disorders | 82 (581) | 3 (185) | 79 |
| 996.xx | Complications peculiar to certain specified procedures | 96 (2,202) | 27 (728) | 69 |
| 722.xx | Intervertebral disc disorders | 135 (2,470) | 67 (2,228) | 68 |
| 721.xx | Spondylosis and allied disorders | 76 (1,874) | 16 (626) | 60 |
| ED costs (total) | 3,141 (12,962) | 835 (5,610) | 2,306 | |
| 965.xxh | Poisoning by analgesics, antipyretics, and antirheumatics (opioids) | 189 (1,592) | 0 (0) | 189 |
| 304.xxh | Drug dependence (opioids) | 135 (1,394) | 0 (0) | 135 |
| 518.xx | Other diseases of lung | 155 (2,192) | 30 (1,237) | 125 |
| 780.xx | General symptoms | 148 (844) | 29 (310) | 119 |
| 305.xxg | Nondependent abuse of drugs (excluding opioids) | 72 (444) | 14 (274) | 59 |
| 296.xx | Episodic mood disorders | 66 (719) | 11 (457) | 54 |
| 292.xx | Drug-induced mental disorders | 51 (404) | 1 (24) | 50 |
| 789.xx | Other symptoms involving abdomen and pelvis | 98 (1,009) | 49 (625) | 50 |
| 977.xx | Poisoning by other and unspecified drugs and medicinal substances | 46 (435) | 2 (39) | 45 |
| 965.xxg | Poisoning by analgesics, antipyretics, and antirheumatics (excluding opioids) | 42 (555) | 0 (7) | 42 |
| Rehabilitation facility costs (total) | 2,369 (9,871) | 45 (966) | 2,324 | |
| 304.xxh | Drug dependence (opioids) | 1,077 (4,912) | 0 (0) | 1,077 |
| 304.xxg | Drug dependence (excluding opioids) | 614 (5,018) | 7 (344) | 607 |
| 303.xx | Alcohol dependence syndrome | 344 (2,870) | 5 (193) | 339 |
| 296.xx | Episodic mood disorders | 51 (1,008) | 1 (53) | 50 |
| 305.xxg | Nondependent abuse of drugs (excluding opioids) | 46 (1,002) | 0 (2) | 46 |
| V71.xx | Observation and evaluation for suspected conditions not found | 42 (644) | 0 (13) | 42 |
| 292.xx | Drug-induced mental disorders | 31 (605) | 0 (0) | 31 |
| 300.xx | Anxiety, dissociative and somatoform disorders | 20 (542) | 1 (52) | 19 |
| 311.xx | Depressive disorder, not elsewhere classified | 14 (289) | 0 (39) | 14 |
| 799.xx | Other ill-defined and unknown causes of morbidity and mortality | 13 (395) | 0 (0) | 13 |
| Outpatient/other costs (total) | 6,692 (15,261) | 2,786 (11,512) | 3,906 | |
| 304.xxh | Drug dependence (opioids) | 1,487 (5,140) | 0 (0) | 1,487 |
| 304.xxg | Drug dependence (excluding opioids) | 1,029 (6,884) | 4 (113) | 1,026 |
| 303.xx | Alcohol dependence syndrome | 409 (3,190) | 11 (237) | 398 |
| V71.xx | Observation and evaluation for suspected conditions not found | 168 (1,670) | 2 (45) | 166 |
| 296.xx | Episodic mood disorders | 194 (1,099) | 54 (474) | 140 |
| V58.xx | Encounter for other and unspecified procedures and aftercare | 245 (2,253) | 121 (3,407) | 124 |
| 724.xx | Other and unspecified disorders of back | 221 (2,032) | 104 (745) | 117 |
| 305.xxg | Nondependent abuse of drugs (excluding opioids) | 97 (800) | 11 (211) | 86 |
| 721.xx | Spondylosis and allied disorders | 112 (1,450) | 37 (555) | 75 |
| 292.xx | Drug-induced mental disorders | 68 (631) | 1 (47) | 67 |
| Prescription drug costs | 1,649 (5,510) | 1,339 (4,820) | 310 | |
aThe study period is defined as the baseline period (12-6 months before the index date) and the follow-up period (6 months before and 6 months following the index date).
bThe index date for abusers was defined as the date of first diagnosis of abuse, dependence, or poisoning/overdose in Q1 2012-Q1 2015. The index date for controls was defined as a random medical claim in Q1 2012-Q1 2015.
cAbusers were matched to potential controls based on propensity score (within a quarter of a standard deviation).
dThe following ICD-9-CM diagnosis codes indicating opioid abuse, dependence, or poisoning/overdose were used to identify opioid abuse: 305.5x, 304.0x, 304.7x, 965.00, 965.02, and 965.09. Opioid abuse diagnoses and all other diagnoses were separately categorized by the first 3 digits of their ICD-9-CM codes.
eHealth care costs were inflated to 2015 values using the medical care component of the Consumer Price Index.
fPercentages of total excess costs by ICD-9-CM codes might not add to 100% within each place of service because excess costs for each ICD-9-CM code are either negative or positive depending on whether the cost for controls or abusers is larger.
gExcluding codes used to identify opioid abuse.
hLimited to codes used to identify opioid abuse.
ED = emergency department; ICD-9-CM = International Classification of Diseases, Ninth Revision, Clinical Modification; Q = quarter.
During the 6-month pre-index period, more systematic patterns emerge, with abusers accumulating $3,084 in incremental costs versus nonabusers. Inpatient (+ $729), outpatient (+ $584), and rehabilitation (+ $274) costs were all higher in abusers. In all 3 categories, the leading driver of incremental cost was treatment for alcohol and nonopioid drug dependence (+ $156, + $306, + $254, respectively), with nondependent abuse of drugs excluding opioids (+ $33) and alcohol-induced mental disorders ($4) also contributing incremental costs. Across these 3 categories, alcohol and nonopioid drug dependence/abuse accounted for 47% of the incremental costs. While the biggest difference in pre-index costs was ED visits (+ $1,431), there were no clear drivers in this category. The leading ICD-9-CM codes were general symptoms (other symptoms involving the abdomen and pelvis; general symptoms) and together accounted for only 8% of ED costs.
During the 6-month period starting at the first opioid abuse episode, abusers accumulated $11,726 in incremental costs. Inpatient (+ $2,880), outpatient (+ $3,906), and rehabilitation (+ $2,324) costs were all higher in abusers. In these 3 categories, costs associated with opioid abuse (opioid drug dependence, poisoning, and drug-induced mental disorders) were the leading drivers (+ $866, + $1,554, + $1,108, respectively), accounting for 39% of incremental costs. The second-leading drivers in these categories were alcohol and nonopioid drug dependence and abuse, accounting for + $415, + $1,510, and + $992 respectively, or 32% of incremental costs. ED costs were also higher among abusers (+ $2,306), but here opioid drug dependence, poisoning, and drug-induced mental disorders only accounted for + $374, or 16% of incremental costs. Nonopioid drug dependence accounted for $59 (3% of incremental costs) and other poisonings accounted for $87 (4%) of incremental costs. Once again, ED costs were more diffuse and nonspecific.
In summary, the incremental costs of an incident abuse event were $14,810: $3,084 in the 6 months pre-index plus $11,726 post-index.
Sensitivity Analyses
The excess costs of abuse among the 2 cohorts with more limited pre-index eligibility were very similar to the group with a full year of pre-index coverage. As shown in Table 3, excess costs in the patients with 6-12 months of pre-index coverage (N = 1,434) were $3,741 pre-index and $11,457 post-index. The excess costs in patients with < 6 months pre-index coverage (N = 2,941) were $2,138 pre-index and $10,633 post-index. This compares to $3,084 pre-index and $11,726 post-index for patients with ≥ 12 months of pre-index coverage (Table 2).
TABLE 3.
| Abusers [A] Mean (SD), $ | Controls [B] Mean (SD), $ | Excess [A] - [B] Mean, $ | P Value | |
|---|---|---|---|---|
| Baseline (-12 to -6 Months Relative to Index Date) | ||||
| Patients with 6-12 months of continuous insurance coverage before the index date (N = 1,434 matched pairs) | ||||
| Total health care costse | 3,129 (11,454) | 2,825 (9,758) | 305 | 0.173 |
| Inpatient | 672 (5,899) | 584 (4,846) | 89 | 0.661 |
| ED | 854 (6,161) | 599 (3,740) | 255 | 0.125 |
| Rehabilitation facility | 71 (1,021) | 61 (1,238) | 9 | 0.288 |
| Outpatient/other | 1,140 (4,172) | 1,211 (4,830) | -70 | 0.530 |
| Prescription drug costs | 392 (1,725) | 370 (1,610) | 22 | 0.354 |
| Patients with < 6 months of continuous insurance coverage before the index date (N = 2,941 matched pairs) | ||||
| Total health care costse | 1,054 (8,398) | 411 (4,149) | 643 | < 0.001 |
| Inpatient | 245 (4,550) | 123 (3,018) | 122 | 0.013 |
| ED | 243 (4,920) | 70 (1,828) | 173 | < 0.001 |
| Rehabilitation facility | 10 (290) | 1 (57) | 9 | 0.131 |
| Outpatient/other | 407 (2,892) | 160 (1,577) | 247 | < 0.001 |
| Prescription drug costs | 148 (1,138) | 56 (672) | 92 | < 0.001 |
| Pre-index (-6 to 0 Months Relative to Index Date) | ||||
| Patients with 6-12 months of continuous insurance coverage before the index date (N = 1,434 matched pairs) | ||||
| Total health care costse | 8,419 (26,678) | 4,678 (17,616) | 3,741 | < 0.001 |
| Inpatient | 1,882 (15,314) | 1,199 (11,242) | 683 | < 0.001 |
| ED | 2,016 (11,699) | 700 (4,706) | 1,316 | < 0.001 |
| Rehabilitation facility | 526 (5,134) | 42 (790) | 484 | < 0.001 |
| Outpatient/other | 3,066 (8,829) | 2,064 (7,794) | 1,001 | < 0.001 |
| Prescription drug costs | 929 (3,046) | 672 (3,186) | 257 | < 0.001 |
| Patients with < 6 months of continuous insurance coverage before the index date (N = 2,941 matched pairs) | ||||
| Total health care costse | 3,365 (12,921) | 1,227 (7,794) | 2,138 | < 0.001 |
| Inpatient | 737 (7,040) | 251 (4,260) | 486 | < 0.001 |
| ED | 881 (5,554) | 301 (3,831) | 580 | < 0.001 |
| Rehabilitation facility | 139 (2,061) | 4 (112) | 135 | < 0.001 |
| Outpatient/other | 1,226 (5,549) | 534 (2,977) | 692 | < 0.001 |
| Prescription drug costs | 381 (1,451) | 136 (901) | 245 | < 0.001 |
| Post-index (0 to 6 Months Relative to Index Date) | ||||
| Patients with 6-12 months of continuous insurance coverage before the index date (N = 1,434 matched pairs) | ||||
| Total health care costse | 15,487 (33,766) | 4,029 (16,981) | 11,457 | < 0.001 |
| Inpatient | 3,581 (14,273) | 755 (7,465) | 2,826 | < 0.001 |
| ED | 2,782 (14,465) | 652 (4,406) | 2,130 | < 0.001 |
| Rehabilitation facility | 2,366 (10,433) | 44 (970) | 2,321 | < 0.001 |
| Outpatient/other | 5,576 (14,264) | 2,000 (11,612) | 3,576 | < 0.001 |
| Prescription drug costs | 1,182 (3,040) | 577 (2,360) | 604 | < 0.001 |
| Patients with < 6 months of continuous insurance coverage before the index date (N = 2,941 matched pairs) | ||||
| Total health care costse | 12,975 (29,665) | 2,342 (8,240) | 10,633 | < 0.001 |
| Inpatient | 3,036 (16,597) | 614 (5,045) | 2,421 | < 0.001 |
| ED | 1,934 (8,325) | 252 (2,647) | 1,682 | < 0.001 |
| Rehabilitation facility | 1,891 (9,284) | 50 (1,707) | 1,840 | < 0.001 |
| Outpatient/other | 4,830 (12,778) | 1,124 (3,987) | 3,705 | < 0.001 |
| Prescription drug costs | 1,286 (2,894) | 301 (1,318) | 984 | < 0.001 |
aThe 12-month follow-up period is defined as the 6 months before and 6 months following the index date.
bThe index date for abusers was defined as the date of first diagnosis of abuse, dependence, or poisoning/overdose in Q1 2012-Q1 2015. The index date for controls was defined as a random medical claim in Q1 2012-Q1 2015.
cAbusers were matched to potential controls based on propensity score (within a quarter of a standard deviation).
dP values were calculated using Wilcoxon rank sum tests for continuous variables and chi-squared tests for categorical variables.
eHealth care costs were inflated to 2015 values using the medical care component of the Consumer Price Index.
ED = emergency department; SD = standard deviation; Q = quarter.
Discussion
The incremental health care spending associated with a first episode of opioid abuse, dependence, or overdose/poisoning was $14,810, replicating previous research.9-11 This study added to our understanding of the costs of opioid abuse in several important ways. First, we found that monthly health care costs began increasing 5 months before the incident opioid abuse episode. Similar patterns have been seen for cancer and other serious medical conditions.15,16 These findings show that opioid abuse, like most serious medical conditions, does not generally appear “out of thin air” but that health care costs build in the preceding months. An important observation concerns the source of these incremental costs. Of the $1,587 dollars in excess costs across the 3 above places of service (inpatient, outpatient, and rehabilitation facility) during the 6-month pre-index, 47% were due to the treatment of nonopioid drug and alcohol dependence and abuse. While, as expected, treatment specifically for opioid abuse was the leading driver of incremental costs after the index event (39%), a similar percentage of excess costs (32%) was driven by treatment for alcohol and nonopioid drug abuse. Indeed, while 26% of the total incremental costs of an opioid abuse episode was attributed to opioid-specific treatments, another 26% of costs were attributed to alcohol and nonopioid drug abuse and dependence treatment.
While nonopioid substance abuse was similarly prevalent among abusers (11%) and non-abuser controls (10%) during the baseline period, the rates of nonopioid substance abuse diverged during the follow-up period. In the 6 months before the index date, 22% of abusers were diagnosed with nonopioid substance abuse compared with 6% of controls. This gap widened during the post-index period, with 43% of abusers and 6% of controls receiving such diagnoses. We believe this confirms that many abusers are indeed polysubstance abusers.
The exception to the pattern observed in inpatient, outpatient, and rehabilitation costs was ED costs. While these were generally higher at all periods including baseline, no clear abuse-driven patterns were observed. Indeed, preabuse, the leading diagnoses were general or unspecified abdominal symptoms. ED visits may be a route to obtain short-term supplies of drugs for patients experiencing withdrawal,17 but these data neither confirm nor refute that interpretation. More curious is that abuse costs do not dominate costs after initial diagnosis (i.e., opioid abuse-related ED costs post-index comprise a much smaller proportion of excess costs than for other places of service post-index). Future analyses focusing on course of a care episode may further elucidate this unexpected observation. Finally, prescription drug costs did increase over the 3 periods, but their contribution was minor compared to direct medical costs (+ $15 baseline, + $66 pre-index, + $310 post-index).
There are important implications of these findings, both for payers and for the management of substance abuse more broadly. Opioid abuse and related costs commonly occurred in the broader context of polysubstance abuse, including alcohol and nonopioid drugs. Indeed, in this analysis, diagnosis and treatment for other substance abuse temporally preceded the initial opioid abuse diagnosis. While popular media depicts opioid abuse arising from a single de novo prescription,18 these data suggest that opioid abuse may often occur after or in conjunction with other substance abuse and that poly-substance abuse is an equal driver of cost. Investing in the effective treatment of other substance abuse may be the most cost-effective way of preventing a significant proportion of the costs of opioid abuse. However, further research is necessary, as the sequence of substances abused and any causality therein remains unclear. Caution must be exercised when prescribing opioids to patients with any substance abuse history, and those patients may benefit from a more guarded approach to pain management (e.g., closer monitoring of opioid use, abuse-deterrent formulations, or limiting the number of different Schedule II medications prescribed).
From a more technical perspective, this study demonstrated that excluding patients with less pre-index eligibility did not significantly affect estimates of the costs of opioid abuse. Patients who are diagnosed and treated shortly after joining a health plan do not differ significantly in abuse cost. It has been hypothesized that some patients wait until they are close to a catastrophic event to seek insurance coverage, generating treatment costs above and beyond the norm for an event, for example due to not receiving appropriate preventive care or treatment in a timely manner.19 However, opioid abuse issues are not generally events that patients anticipate and then seek coverage. Instead, index events in this area are likely to have been acute. Thus, these data do not support that adverse selection hypothesis. Additionally, removing the requirement that patients have continuous coverage after an event did not substantially affect estimates of the cost of opioid abuse. The costs here reflect costs to an insurer, including the costs of patients who left the plan less than 6 months after the abuse event. Thus, shorter eligibility requirements in the study yielded robust estimates of the excess costs of abuse.
Finally, these data suggest that the incremental costs associated with an abuse episode may continue well beyond 6 months. Though excess monthly costs peaked during that first month of abuse at $6,010 and quickly decreased in the next few months, there remained nearly $1,000 in excess costs in months 5 and 6. As such, the dollars shown here likely represent an underestimate of total abuse costs. Future research should continue to extend the postevent observation period to determine if there is a point at which costs return to baseline levels.
Limitations
There are some limitations to this study that need to be considered. First, the analysis relies on the accuracy of claims data to distinguish abusers from nonabusers, evaluate their comorbidity profiles at baseline, and evaluate resource use and cost information during the follow-up period. Any miscoding in the underlying data could affect our results, although we have no reason to believe that any inaccuracies in the data affected the abusers or nonabuser control patients differently.
Similarly, because undiagnosed opioid abusers do not receive any of the ICD-9-CM diagnosis codes for abuse by definition, it is possible that some of these patients may be included in our nonabuser cohort. While the extent to which this is the case is unknown, if undiagnosed abusers are more costly than a true nonabuser population, this would imply that the estimated excess costs of diagnosed abuse understate the actual excess cost differential between abusers and a control population of patients without diagnosed or undiagnosed opioid abuse.
Propensity score matching was used to adjust for observable differences between abusers and nonabusers. The matched samples were well balanced overall, with minimal substantive differences remaining across abusers and nonabusers. While there was slight residual confounding at the baseline—baseline costs between abusers and nonabusers persisted postmatching, for a difference of $407 (5%)—the results do not appear to have been materially affected.
Finally, our study focused on the commercially insured population, and the results herein may not generalize to other populations, though it should be noted that existing studies assessing the excess costs of opioid abuse on other populations have arrived at similar estimates. For example, annual excess costs for the Veterans Affairs population between 2006 and 2010 ranged from $15,277 to $18,847.9 A literature review of studies published from 2002 to 2012 found that annual excess costs for abusers in Medicaid were $5,874 to $15,183.10
Conclusions
Opioid abusers generate an average of $14,810 in excess costs to payers in the 6 months before and after the initial abuse episode. Excess costs begin increasing 5 months before the initial diagnosis, driven by nonopioid drug and alcohol abuse treatment. Overall, excess costs were almost equally driven by the costs of treating opioid abuse (26%) and the costs of treating nonopioid drug and alcohol abuse (26%). This pattern was true of inpatient, outpatient, and rehabilitation costs, but ED costs were diffuse, with no clear diagnostic or treatment drivers. The results demonstrate the substantial costs of prescription opioid abuse borne by payers and demonstrate that a sizable proportion of costs may be incurred in the context of other substance abuse.
Acknowledgments
The authors thank Peter Neumann and the Tufts Medical Center for Evaluation of Value and Risk in Health (CEVR) for providing helpful feedback.
APPENDIX A. Full Table of Baseline Characteristicsa,b
| Patient Characteristicsc | Unmatched | Matched | ||||||
|---|---|---|---|---|---|---|---|---|
| Abusers | Controls | Abusers | Controls | |||||
| N = 9,421 | N = 669,574 | N = 9,342 | N = 9,342 | |||||
| Age, mean (SD) | 37.1d | (14.4) | 43.6 | (13.2) | 37.1d | (14.4) | 36.5 | (14.5) |
| Male, n (%) | 5,437d | (57.7) | 317,589 | (47.4) | 5,389 | (57.7) | 5,507 | (58.9) |
| U.S. census division,e n (%) | ||||||||
| Northeast | 3,028d | (32.1) | 158,332 | (23.6) | 2,999 | (32.1) | 3,074 | (32.9) |
| Midwest | 1,740d | (18.5) | 176,098 | (26.3) | 1,729 | (18.5) | 1,681 | (18.0) |
| South | 2,830d | (30.0) | 216,174 | (32.3) | 2,811 | (30.1) | 2,808 | (30.1) |
| West | 1,383 | (14.7) | 96,999 | (14.5) | 1,365 | (14.6) | 1,321 | (14.1) |
| Unknown | 440d | (4.7) | 21,971 | (3.3) | 438 | (4.7) | 458 | (4.9) |
| Employee status of primary beneficiary, n (%) | ||||||||
| Active | 6,356d | (67.5) | 464,708 | (69.4) | 6,306 | (67.5) | 6,316 | (67.6) |
| Retirement/early retirement | 1,188d | (12.6) | 72,225 | (10.8) | 1,175 | (12.6) | 1,175 | (12.6) |
| Short-term disability/long-term disability | 397f | (4.2) | 25,507 | (3.8) | 390 | (4.2) | 352 | (3.8) |
| Leave of absence | 360d | (3.8) | 10,382 | (1.6) | 356 | (3.8) | 366 | (3.9) |
| Otherg | 166d | (1.8) | 7,724 | (1.2) | 162 | (1.7) | 177 | (1.9) |
| Unknown | 954d | (10.1) | 89,028 | (13.3) | 953 | (10.2) | 956 | (10.2) |
| Relationship to primary beneficiary, n (%) | ||||||||
| Self | 3,739d | (39.7) | 397,763 | (59.4) | 3,710f | (39.7) | 3,578 | (38.3) |
| Child | 3,285d | (34.9) | 82,073 | (12.3) | 3,262d | (34.9) | 3,545 | (37.9) |
| Spouse | 2,355d | (25.0) | 188,627 | (28.2) | 2,329d | (24.9) | 2,176 | (23.3) |
| Otherh | 35d | (0.4) | 929 | (0.1) | 35 | (0.4) | 36 | (0.4) |
| Unknown | 7f | (0.1) | 182 | (0.0) | 6 | (0.1) | 7 | (0.1) |
| Year of index date, n (%) | ||||||||
| 2012 | 3,092d | (32.8) | 267,392 | (39.9) | 3,074 | (32.9) | 3,113 | (33.3) |
| 2013 | 3,186d | (33.8) | 199,518 | (29.8) | 3,152 | (33.7) | 3,181 | (34.1) |
| 2014 | 2,765d | (29.3) | 166,317 | (24.8) | 2,741 | (29.3) | 2,674 | (28.6) |
| 2015 | 378d | (4.0) | 36,347 | (5.4) | 375 | (4.0) | 374 | (4.0) |
| Duration of continuous insurance coverage following the index date, n (%) | ||||||||
| 0-1 months | 295d | (3.1) | 32,664 | (4.9) | 294 | (3.1) | 293 | (3.1) |
| 1-2 months | 388d | (4.1) | 35,913 | (5.4) | 385 | (4.1) | 402 | (4.3) |
| 2-3 months | 450d | (4.8) | 37,327 | (5.6) | 447 | (4.8) | 469 | (5.0) |
| 3-4 months | 400 | (4.2) | 29,783 | (4.4) | 396 | (4.2) | 393 | (4.2) |
| 4-5 months | 393 | (4.2) | 28,782 | (4.3) | 387 | (4.1) | 400 | (4.3) |
| 5-6 months | 395 | (4.2) | 28,443 | (4.2) | 392 | (4.2) | 403 | (4.3) |
| ≥ 6 months | 7,100d | (75.4) | 476,662 | (71.2) | 7,041 | (75.4) | 6,982 | (74.7) |
| Baseline comorbiditiesi | ||||||||
| CCI components, n (%) | ||||||||
| Myocardial infarction | 29d | (0.3) | 1,167 | (0.2) | 29 | (0.3) | 27 | (0.3) |
| Congestive heart failure | 96d | (1.0) | 3,045 | (0.5) | 93 | (1.0) | 85 | (0.9) |
| Peripheral vascular disease | 77d | (0.8) | 3,270 | (0.5) | 75 | (0.8) | 88 | (0.9) |
| Cerebrovascular disease | 115d | (1.2) | 4,426 | (0.7) | 113 | (1.2) | 113 | (1.2) |
| Dementia | 4 | (0.0) | 140 | (0.0) | 4 | (0.0) | 3 | (0.0) |
| Chronic pulmonary disease | 666d | (7.1) | 23,471 | (3.5) | 652 | (7.0) | 672 | (7.2) |
| Rheumatologic disease | 147d | (1.6) | 5,085 | (0.8) | 142 | (1.5) | 129 | (1.4) |
| Peptic ulcer disease | 46d | (0.5) | 797 | (0.1) | 45 | (0.5) | 53 | (0.6) |
| Mild liver disease | 218d | (2.3) | 5,601 | (0.8) | 212 | (2.3) | 205 | (2.2) |
| Mild to moderate diabetes | 435 | (4.6) | 30,706 | (4.6) | 430 | (4.6) | 416 | (4.5) |
| Diabetes with chronic complications | 100d | (1.1) | 4,766 | (0.7) | 99 | (1.1) | 95 | (1.0) |
| Hemiplegia or paraplegia | 24d | (0.3) | 737 | (0.1) | 24 | (0.3) | 26 | (0.3) |
| Renal disease | 82d | (0.9) | 3,659 | (0.5) | 79 | (0.8) | 75 | (0.8) |
| Any malignancy including lymphoma and leukemia | 167 | (1.8) | 11,690 | (1.7) | 164 | (1.8) | 165 | (1.8) |
| Moderate or severe liver disease | 16d | (0.2) | 246 | (0.0) | 15 | (0.2) | 14 | (0.1) |
| Metastatic solid tumor | 32f | (0.3) | 1,478 | (0.2) | 32 | (0.3) | 38 | (0.4) |
| HIV/AIDS | 28f | (0.3) | 1,347 | (0.2) | 27 | (0.3) | 34 | (0.4) |
| Other selected comorbidities, n (%) | Unmatched | Matched | ||||||
| Abusers | Controls | Abusers | Controls | |||||
| N = 9,421 | N = 669,574 | N = 9,342 | N = 9,342 | |||||
| Nonopioid substance abuse | 1,094d | (11.6) | 7,798 | (1.2) | 1,049f | (11.2) | 972 | (10.4) |
| Major depressive disorder | 843d | (8.9) | 13,503 | (2.0) | 824 | (8.8) | 771 | (8.3) |
| Other psychosis | 767d | (8.1) | 7,713 | (1.2) | 736 | (7.9) | 716 | (7.7) |
| Other mental disorder | 2,751d | (29.2) | 55,841 | (8.3) | 2,700 | (28.9) | 2,728 | (29.2) |
| Headache | 798d | (8.5) | 22,490 | (3.4) | 779 | (8.3) | 733 | (7.8) |
| Neuropathic pain | 743d | (7.9) | 18,627 | (2.8) | 725 | (7.8) | 714 | (7.6) |
| Hernia | 119d | (1.3) | 4,397 | (0.7) | 115 | (1.2) | 113 | (1.2) |
| Arthropathies and related disorders (excluding osteoarthritis and rheumatoid arthritis) | 1,691d | (17.9) | 54,721 | (8.2) | 1,663 | (17.8) | 1,630 | (17.4) |
| Rheumatoid arthritis | 37d | (0.4) | 867 | (0.1) | 35 | (0.4) | 32 | (0.3) |
| Osteoarthritis | 588d | (6.2) | 19,286 | (2.9) | 579 | (6.2) | 548 | (5.9) |
| Back/neck pain | 3,109d | (33.0) | 80,215 | (12.0) | 3,050 | (32.6) | 3,007 | (32.2) |
| Rheumatism, excluding the back (excludes fibromyalgia, neuralgia) | 1,571d | (16.7) | 58,299 | (8.7) | 1,546 | (16.5) | 1,514 | (16.2) |
| Fibromyalgia | 520d | (5.5) | 9,625 | (1.4) | 503 | (5.4) | 493 | (5.3) |
| Osteopathies, chondropathies, and acquired musculoskeletal deformities | 408d | (4.3) | 21,368 | (3.2) | 402 | (4.3) | 389 | (4.2) |
| Abdominal pain | 1,163d | (12.3) | 31,485 | (4.7) | 1,137 | (12.2) | 1,088 | (11.6) |
| Fractures, dislocations, and sprains/strains | 1,273d | (13.5) | 40,327 | (6.0) | 1,249 | (13.4) | 1,249 | (13.4) |
| Other injuries | 1,190d | (12.6) | 27,698 | (4.1) | 1,153 | (12.3) | 1,073 | (11.5) |
| Hereditary hemolytic anemias | 9f | (0.1) | 312 | (0.0) | 8 | (0.1) | 10 | (0.1) |
| Pain and other symptoms associated with female genital organs | 289d | (3.1) | 10,800 | (1.6) | 287d | (3.1) | 226 | (2.4) |
| Acute pain | 237d | (2.5) | 3,356 | (0.5) | 224 | (2.4) | 203 | (2.2) |
| Chronic pain | 424d | (4.5) | 1,598 | (0.2) | 392d | (4.2) | 327 | (3.5) |
| Dental pain | 239d | (2.5) | 5,757 | (0.9) | 234 | (2.5) | 204 | (2.2) |
| Other pain | 445d | (4.7) | 1,929 | (0.3) | 417 | (4.5) | 370 | (4.0) |
| Baseline health care resource use and costs | ||||||||
| Baseline health care resource use, mean (SD) | ||||||||
| Inpatient days | 0.7d | (4.3) | 0.1 | (1.7) | 0.7d | (4.3) | 0.7 | (5.1) |
| ED visits | 0.7d | (1.6) | 0.2 | (0.6) | 0.7d | (1.6) | 0.6 | (1.6) |
| Rehabilitation facility days | 0.3d | (3.6) | 0.0 | (1.1) | 0.3d | (3.5) | 0.3 | (4.2) |
| Outpatient/other visits | 8.2d | (11.0) | 4.1 | (6.5) | 8.1 | (10.9) | 7.9 | (10.2) |
| Selected musculoskeletal surgeries, n (%) | ||||||||
| Hip | 19d | (0.2) | 339 | (0.1) | 18 | (0.2) | 19 | (0.2) |
| Knee | 35d | (0.4) | 618 | (0.1) | 32 | (0.3) | 29 | (0.3) |
| Shoulder | 14d | (0.1) | 208 | (0.0) | 14 | (0.1) | 13 | (0.1) |
| Spine | 85d | (0.9) | 898 | (0.1) | 82 | (0.9) | 93 | (1.0) |
| Number of prescriptions filled, mean (SD) | 14.8d | (17.3) | 5.7 | (8.4) | 14.6d | (17.1) | 14.0 | (17.7) |
| Number of unique NDCs filled,j mean (SD) | 7.0d | (7.4) | 3.1 | (3.9) | 6.9 | (7.3) | 6.7 | (7.1) |
| Any use of selected classes of pain relievers, n (%) | ||||||||
| Opioid analgesics | ||||||||
| Immediate release | 4,352d | (46.2) | 78,917 | (11.8) | 4,279 | (45.8) | 4,272 | (45.7) |
| Extended release | 1,083d | (11.5) | 3,373 | (0.5) | 1,036d | (11.1) | 927 | (9.9) |
| NSAIDs | 1,805d | (19.2) | 63,734 | (9.5) | 1,778 | (19.0) | 1,720 | (18.4) |
| Non-narcotic analgesics | 182d | (1.9) | 4,769 | (0.7) | 180 | (1.9) | 176 | (1.9) |
| Antianxiety medications | 2,910d | (30.9) | 49,454 | (7.4) | 2,843 | (30.4) | 2,791 | (29.9) |
| Baseline health care resource use and costs | Unmatched | Matched | ||||||
| Abusers | Controls | Abusers | Controls | |||||
| N = 9,421 | N = 669,574 | N = 9,342 | N = 9,342 | |||||
| Any use of selected classes of pain relievers, n (%) | ||||||||
| Antidepressants | 3,383d | (35.9) | 87,739 | (13.1) | 3,320 | (35.5) | 3,308 | (35.4) |
| Antiepileptics | 1,590d | (16.9) | 23,648 | (3.5) | 1,544 | (16.5) | 1,490 | (15.9) |
| Muscle relaxants | 1,761d | (18.7) | 29,773 | (4.4) | 1,716 | (18.4) | 1,699 | (18.2) |
| Other pain relieversk | 904d | (9.6) | 15,178 | (2.3) | 876 | (9.4) | 859 | (9.2) |
| Baseline health care costs,l mean (SD), $ | 8,182d | (27,539) | 2,502 | (11,926) | 7,969f | (26,714) | 7,562 | (24,087) |
aThe index date for abusers was defined as the date of first diagnosis of abuse, dependence, or poisoning/overdose in Q1 2012-Q1 2015. The index date for controls was defined as a random medical claim in Q1 2012-Q1 2015. This analysis was performed on the cohort of patients with ≥ 12 months of continuous coverage before the index date.
bP values were calculated using Wilcoxon rank sum tests for continuous variables and chi-squared tests for categorical variables.
cPatient characteristics were evaluated on the index date.
dP value < 0.01.
eNortheast: CT, MA, ME, NH, NJ, NY, PA, RI, VT; Midwest: IA, IL, IN, KS, MI, MN, MO, ND, NE, OH, SD, WI; South: AL, AR, DC, DE, FL, GA, KY, LA, MD, MS, NC, OK, SC, TN, TX, VA, WV; West: AK, AZ, CA, CO, HI, ID, MT, NM, NV, OR, UT, WA, WY.
fP value < 0.05.
gOther statuses include terminated, COBRA, surviving dependent, deceased, summarized, mixed status, coverage cancelled, and temporary employee.
hOther relationships include sponsored, class II dependent, and handicapped.
iThe baseline period was defined as the period between 12 months and 6 months before the index date.
jIdentified using 9-digit NDC numbers.
kOther pain relievers include tramadol, butorphanol, pentazocine, nalbuphine, and dihydrocodeine.
lHealth care costs were inflated to 2015 values using the medical care component of the Consumer Price Index.
AIDS = acquired immune deficiency syndrome; CCI = Charlson Comorbidity Index; ED = emergency department; HIV = human immunodeficiency virus; NDC = National Drug Code; NSAID = nonsteroidal anti-inflammatory drug; Q = quarter; SD = standard deviation.
APPENDIX B. Propensity Score Matching Logistic Model Resultsa,b
| Parameterc | Coefficient | (SE) | OR | 95% CI | P Value |
|---|---|---|---|---|---|
| Intercept | -5.21 | (0.1) | – | < 0.001 | |
| Age | -0.03 | (0.0) | 0.97 | 0.96-0.97 | < 0.001 |
| Male | 0.80 | (0.0) | 2.22 | 2.12-2.33 | < 0.001 |
| U.S. census divisiond | |||||
| Northeast | [reference value] | ||||
| Midwest | -0.74 | (0.0) | 0.48 | 0.45-0.51 | < 0.001 |
| South | -0.43 | (0.0) | 0.65 | 0.61-0.69 | < 0.001 |
| West | -0.35 | (0.0) | 0.70 | 0.65-0.75 | < 0.001 |
| Unknown | 0.08 | (0.1) | 1.08 | 0.97-1.21 | 0.155 |
| Employment status of primary beneficiary | |||||
| Active | [reference value] | ||||
| Retirement/early retirement | 0.22 | (0.0) | 1.24 | 1.15-1.33 | < 0.001 |
| Short-term disability/long-term disability | 0.05 | (0.1) | 1.06 | 0.94-1.18 | 0.343 |
| Leave of absence | 0.72 | (0.1) | 2.06 | 1.82-2.32 | < 0.001 |
| Othere | 0.36 | (0.1) | 1.44 | 1.21-1.72 | < 0.001 |
| Unknown | -0.23 | (0.0) | 0.79 | 0.74-0.85 | < 0.001 |
| Relationship to primary beneficiary | |||||
| Self | [reference value] | ||||
| Child | 1.15 | (0.0) | 3.14 | 2.91-3.40 | < 0.001 |
| Spouse | 0.26 | (0.0) | 1.30 | 1.23-1.38 | < 0.001 |
| Otherf | 0.69 | (0.2) | 1.98 | 1.36-2.90 | < 0.001 |
| Unknown | 0.92 | (0.5) | 2.50 | 1.00-6.24 | 0.050 |
| Year of index date | |||||
| 2012 | [reference value] | ||||
| 2013 | 0.36 | (0.0) | 1.43 | 1.36-1.51 | < 0.001 |
| 2014 | 0.45 | (0.0) | 1.57 | 1.48-1.66 | < 0.001 |
| 2015 | 0.37 | (0.1) | 1.44 | 1.26-1.65 | < 0.001 |
| Duration of continuous insurance coverage following the index date | |||||
| 0-1 months | [reference value] | ||||
| 1-2 months | 0.23 | (0.1) | 1.25 | 1.07-1.47 | 0.006 |
| 2-3 months | 0.33 | (0.1) | 1.40 | 1.19-1.63 | < 0.001 |
| 3-4 months | 0.40 | (0.1) | 1.50 | 1.27-1.77 | < 0.001 |
| 4-5 months | 0.45 | (0.1) | 1.57 | 1.32-1.85 | < 0.001 |
| 5-6 months | 0.46 | (0.1) | 1.59 | 1.34-1.88 | < 0.001 |
| ≥ 6 months | 0.64 | (0.1) | 1.90 | 1.67-2.17 | < 0.001 |
| CCI componentsg | |||||
| Myocardial infarction | -0.15 | (0.2) | 0.86 | 0.56-1.32 | 0.493 |
| Congestive heart failure | -0.12 | (0.1) | 0.89 | 0.69-1.15 | 0.369 |
| Peripheral vascular disease | -0.10 | (0.1) | 0.90 | 0.69-1.17 | 0.436 |
| Cerebrovascular disease | -0.27 | (0.1) | 0.77 | 0.61-0.96 | 0.020 |
| Dementia | -0.77 | (0.6) | 0.46 | 0.14-1.49 | 0.196 |
| Chronic pulmonary disease | 0.05 | (0.0) | 1.05 | 0.96-1.16 | 0.275 |
| Rheumatologic disease | -0.04 | (0.1) | 0.96 | 0.79-1.18 | 0.705 |
| Peptic ulcer disease | 0.35 | (0.2) | 1.41 | 0.99-2.02 | 0.059 |
| Mild liver disease | 0.39 | (0.1) | 1.48 | 1.26-1.75 | < 0.001 |
| Mild to moderate diabetes | -0.16 | (0.1) | 0.85 | 0.76-0.96 | 0.006 |
| Diabetes with chronic complications | -0.18 | (0.1) | 0.84 | 0.66-1.06 | 0.141 |
| Hemiplegia or paraplegia | -0.80 | (0.2) | 0.45 | 0.28-0.72 | 0.001 |
| Renal disease | -0.09 | (0.1) | 0.91 | 0.70-1.18 | 0.489 |
| Any malignancy including lymphoma and leukemia | -0.07 | (0.1) | 0.93 | 0.78-1.11 | 0.430 |
| Moderate or severe liver disease | 0.49 | (0.3) | 1.63 | 0.87-3.06 | 0.129 |
| Metastatic solid tumor | -0.64 | (0.2) | 0.53 | 0.35-0.79 | 0.002 |
| HIV/AIDS | -0.18 | (0.2) | 0.83 | 0.55-1.27 | 0.396 |
| Other selected comorbiditiesg | |||||
| Nonopioid substance abuse | 1.35 | (0.0) | 3.87 | 3.56-4.20 | < 0.001 |
| Major depressive disorder | 0.19 | (0.0) | 1.21 | 1.10-1.32 | < 0.001 |
| Other psychosis | 0.40 | (0.1) | 1.50 | 1.35-1.65 | < 0.001 |
| Other mental disorder | 0.51 | (0.0) | 1.66 | 1.57-1.77 | < 0.001 |
| Headache | -0.08 | (0.0) | 0.92 | 0.84-1.01 | 0.080 |
| Neuropathic pain | 0.14 | (0.0) | 1.15 | 1.05-1.27 | 0.003 |
| Hernia | -0.10 | (0.1) | 0.90 | 0.73-1.12 | 0.343 |
| Arthropathies and related disorders (excluding osteoarthritis and rheumatoid arthritis) | 0.08 | (0.0) | 1.08 | 1.01-1.16 | 0.035 |
| Rheumatoid arthritis | 0.28 | (0.2) | 1.33 | 0.89-1.98 | 0.162 |
| Osteoarthritis | 0.21 | (0.1) | 1.24 | 1.11-1.38 | < 0.001 |
| Back/neck pain | 0.54 | (0.0) | 1.71 | 1.62-1.82 | < 0.001 |
| Rheumatism, excluding the back (excludes fibromyalgia, neuralgia) | -0.03 | (0.0) | 0.98 | 0.91-1.05 | 0.489 |
| Fibromyalgia | 0.08 | (0.1) | 1.09 | 0.97-1.22 | 0.148 |
| Osteopathies, chondropathies, and acquired musculoskeletal deformities | -0.20 | (0.1) | 0.82 | 0.73-0.92 | 0.001 |
| Abdominal pain | 0.16 | (0.0) | 1.17 | 1.08-1.27 | < 0.001 |
| Fractures, dislocations, and sprains/strains | -0.06 | (0.0) | 0.94 | 0.87-1.01 | 0.097 |
| Other injuries | 0.18 | (0.0) | 1.20 | 1.11-1.29 | < 0.001 |
| Hereditary hemolytic anemias | -0.28 | (0.4) | 0.76 | 0.34-1.66 | 0.485 |
| Pain and other symptoms associated with female genital organs | 0.02 | (0.1) | 1.02 | 0.89-1.17 | 0.789 |
| Acute pain | -0.01 | (0.1) | 0.99 | 0.83-1.17 | 0.887 |
| Chronic pain | 0.80 | (0.1) | 2.22 | 1.92-2.57 | < 0.001 |
| Dental pain | 0.07 | (0.1) | 1.08 | 0.92-1.25 | 0.349 |
| Other pain | 0.78 | (0.1) | 2.19 | 1.91-2.52 | < 0.001 |
| Baseline health care resource useh | |||||
| Inpatient days | 0.00 | (0.0) | 1.00 | 1.00-1.01 | 0.163 |
| ED visits | 0.09 | (0.0) | 1.10 | 1.08-1.12 | < 0.001 |
| Rehabilitation facility days | 0.02 | (0.0) | 1.02 | 1.01-1.02 | < 0.001 |
| Outpatient/other visits | -0.01 | (0.0) | 0.99 | 0.99-1.00 | 0.003 |
| Selected musculoskeletal surgeries | |||||
| Hip | 0.02 | (0.3) | 1.02 | 0.60-1.73 | 0.950 |
| Knee | -0.22 | (0.2) | 0.80 | 0.52-1.22 | 0.296 |
| Shoulder | 0.11 | (0.3) | 1.12 | 0.59-2.14 | 0.728 |
| Spine | -0.15 | (0.1) | 0.86 | 0.66-1.13 | 0.274 |
| Number of prescriptions filled | 0.03 | (0.0) | 1.03 | 1.03-1.03 | < 0.001 |
| Number of unique NDC numbers filledi | -0.04 | (0.0) | 0.96 | 0.95-0.97 | < 0.001 |
| Any use of selected classes of pain relievers | |||||
| Opioid analgesics | |||||
| Immediate release | 1.21 | (0.0) | 3.37 | 3.18-3.57 | < 0.001 |
| Extended release | 1.40 | (0.1) | 4.06 | 3.67-4.48 | < 0.001 |
| NSAIDs | -0.08 | (0.0) | 0.92 | 0.86-0.98 | 0.011 |
| Non-narcotic analgesics | -0.11 | (0.1) | 0.90 | 0.75-1.08 | 0.245 |
| Antianxiety medications | 0.62 | (0.0) | 1.86 | 1.74-1.98 | < 0.001 |
| Antidepressants | 0.44 | (0.0) | 1.55 | 1.46-1.65 | < 0.001 |
| Antiepileptics | 0.25 | (0.0) | 1.28 | 1.19-1.39 | < 0.001 |
| Muscle relaxants | 0.25 | (0.0) | 1.28 | 1.19-1.38 | < 0.001 |
| Other pain relieversj | 0.52 | (0.0) | 1.68 | 1.54-1.83 | < 0.001 |
| Baseline health care costs (thousands)k | 0.00 | (0.0) | 1.00 | 1.00-1.00 | 0.012 |
aA logistic regression model was estimated, with the dependent variable being an indicator of whether a patient was diagnosed with opioid abuse, dependence, or poisoning/overdose.
bThe index date for abusers was defined as the date of first diagnosis of abuse, dependence, or poisoning/overdose in Q1 2012-Q1 2015. The index date for controls was defined as a random medical claim in Q1 2012-Q1 2015. This analysis was performed on the cohort of patients with ≥ 12 months of continuous coverage before the index date.
cPatient characteristics were evaluated on the index date.
dNortheast: CT, MA, ME, NH, NJ, NY, PA, RI, VT; Midwest: IA, IL, IN, KS, MI, MN, MO, ND, NE, OH, SD, WI; South: AL, AR, DC, DE, FL, GA, KY, LA, MD, MS, NC, OK, SC, TN, TX, VA, WV; West: AK, AZ, CA, CO, HI, ID, MT, NM, NV, OR, UT, WA, WY.
eOther statuses include terminated, COBRA, surviving dependent, deceased, summarized, mixed status, coverage cancelled, and temporary employee.
fOther relationships include sponsored, class II dependent, and handicapped.
gComorbidities were evaluated during the baseline period. The baseline period was defined as the period between 12 months and 6 months before the index date.
hHealth care resource use measures were evaluated during the baseline period. The baseline period was defined as the period between 12 months and 6 months before the index date.
iIdentified using 9-digit NDC numbers.
jOther pain relievers include tramadol, butorphanol, pentazocine, nalbuphine, and dihydrocodeine.
kHealth care costs were inflated to 2015 values using the medical care component of the Consumer Price Index.
AIDS = acquired immune deficiency syndrome; CCI = Charlson Comorbidity Index; CI = confidence interval; ED = emergency department; HIV = human immunodeficiency virus; NDC = National Drug Code; NSAID = nonsteroidal anti-inflammatory drug; OR = odds ratio; Q = quarter; SE = standard error; U.S. = United States.
References
- 1.Simon LS. Relieving pain in America: a blueprint for transforming prevention, care, education, and research. J Pain Palliat Care Pharmacother. 2012;26(2):197-98. [Google Scholar]
- 2.Gaskin DJ, Richard P.. The economic costs of pain in the United States. J Pain. 2012;13(8):715-24. [DOI] [PubMed] [Google Scholar]
- 3.Carey TS, Garrett J, Jackman A, McLaughlin C, Fryer J, Smucker DR.. The outcomes and costs of care for acute low back pain among patients seen by primary care practitioners, chiropractors, and orthopedic surgeons. New Engl J Med. 1995;333(14):913-17. [DOI] [PubMed] [Google Scholar]
- 4.Morley S, Eccleston C, Williams A.. Systematic review and meta-analysis of randomized controlled trials of cognitive behaviour therapy and behaviour therapy for chronic pain in adults, excluding headache. Pain. 1999;80(1):1-13. [DOI] [PubMed] [Google Scholar]
- 5.Volkow ND. America’s addiction to opioids: heroin and prescription drug abuse. May 14, 2014. Available at: https://www.drugabuse.gov/about-nida/legislative-activities/testimony-to-congress/2016/americas-addiction-to-opioids-heroin-prescription-drug-abuse. Accessed December 15, 2016.
- 6.Hughes A, Williams MR, Lipari RN, Bose J, Copello EAP, Kroutil LA.. Prescription drug use and misuse in the United States: results from the 2015 National Survey on Drug Use and Health. NSDUH Data Review. September 2016. Available at: https://www.samhsa.gov/data/sites/default/files/NSDUH-FFR2-2015/NSDUH-FFR2-2015.htm. Accessed December 23, 2016.
- 7.Birnbaum HG, White AG, Schiller M, Waldman T, Cleveland JM, Roland CL.. Societal costs of prescription opioid abuse, dependence, and misuse in the United States. Pain Med. 2011;12(4):657-67. [DOI] [PubMed] [Google Scholar]
- 8.National Institute on Drug Abuse. Frequently asked questions. What are the costs of drug abuse to society? Available at: https://www.drugabuse.gov/frequently-asked-questions#society. Accessed December 15, 2016.
- 9.Baser O, Xie L, Mardekian J, Schaaf D, Wang L, Joshi AV.. Prevalence of diagnosed opioid abuse and its economic burden in the Veterans Health Administration. Pain Pract. 2014;14(5):437-45. [DOI] [PubMed] [Google Scholar]
- 10.Meyer R, Patel AM, Rattana SK, Quock TP, Mody SH.. Prescription opioid abuse: a literature review of the clinical and economic burden in the United States. Popul Health Manag. 2014;17(6):372-87. [DOI] [PMC free article] [PubMed] [Google Scholar]
- 11.Rice JB, Kirson NY, Shei A, et al. Estimating the costs of opioid abuse and dependence from an employer perspective: a retrospective analysis using administrative claims data. Appl Health Econ Health Policy. 2014;12(4):435-46. [DOI] [PMC free article] [PubMed] [Google Scholar]
- 12.American Psychiatric Association. Substance-related and addictive disorders. In: Diagnostic and Statistical Manual of Mental Disorders. 5th ed. Arlington, VA: American Psychiatric Publishing; 2013. Available at: https://psychiatry.org/File%20Library/Psychiatrists/Practice/DSM/APA_DSM-5-Substance-Use-Disorder.pdf. Accessed December 23, 2016. [Google Scholar]
- 13.American Psychiatric Association. Opioid use disorder diagnostic criteria. In: Diagnostic and Statistical Manual of Mental Disorders. 5th ed. Arlington, VA: American Psychiatric Publishing; 2013. Available at: http://pcssmat.org/wp-content/uploads/2014/02/5B-DSM-5-Opioid-Use-Disorder-Diagnostic-Criteria.pdf. Accessed December 15, 2016. [Google Scholar]
- 14.Austin PC. An introduction to propensity score methods for reducing the effects of confounding in observational studies. Multivariate Behav Res. 2011;46(3):399-424. [DOI] [PMC free article] [PubMed] [Google Scholar]
- 15.Hornbrook MC, Fishman PA, Ritzwoller DP, Lafata JE, O’Keeffe-Rosetti MC, Salloum RG.. When does an episode of care for cancer begin? Medical Care. 2013;51(4):324. [DOI] [PMC free article] [PubMed] [Google Scholar]
- 16.Taipale H, Purhonen M, Tolppanen AM, Tanskanen A, Tiihonen J, Hartikainen S.. Hospital care and drug costs from five years before until two years after the diagnosis of Alzheimer’s disease in a Finnish nationwide cohort. Scandinavian J Public Health. 2016;44(2):150-58. [DOI] [PubMed] [Google Scholar]
- 17.Hansen GR. The drug-seeking patient in the emergency room. Emerg Med Clin North Am. 2005;23(2):349-65. [DOI] [PubMed] [Google Scholar]
- 18.Esposito L. Prescription opioids: pain relief comes with risks. U.S. News & World Report Health Care. January 9, 2015. Available at: http://health.usnews.com/health-news/patient-advice/articles/2015/01/09/prescription-opioids-pain-relief-comes-with-risks. Accessed December 15, 2016.
- 19.Kaiser Family Foundation. Key facts about the uninsured population. September 29, 2016. Available at: http://kff.org/uninsured/fact-sheet/key-facts-about-the-uninsured-population/. Accessed December 15, 2016.