

Abstract
BACKGROUND:
Cost-effectiveness analyses tend not to take into account the availability of lower-priced generics following loss of exclusivity (LOE) of branded products. By not considering these generics, which are typically adopted quickly, total costs are likely to be overestimated and may be unreflective of real-world payer conditions in the United States.
OBJECTIVE:
To assess the impact of including future price reductions following LOE on the cost-effectiveness of fingolimod versus intramuscularly administered interferon beta-1a (IM IFNβ-1a) as treatments for multiple sclerosis.
METHODS:
This model was adopted from a previously published Markov model and was conducted from a U.S. payer perspective over a 10-year time horizon. Patients with relapsing-remitting multiple sclerosis entered the model and received either fingolimod (an oral therapy) or IM IFNβ-1a (an injectable). These treatments reflect the interventions studied in the TRANSFORMS randomized clinical trial. Clinical, cost, and utility inputs were based on a recent cost-effectiveness review of therapies for multiple sclerosis. To model LOE, price reductions and the proportion of patients switching to generic versions following LOE were based on published estimates. Price reductions varied to reflect the difference in product types (oral vs. large molecule injectable). Assumptions were also made around the proportion of patients switching to generic versions over time following LOE and the projected date of LOE. Outcomes included per-patient total direct costs (medication, administration and monitoring, and disease-related costs including relapses), quality-adjusted life-years, and the incremental cost per quality-adjusted life-year.
RESULTS:
Assuming no price reductions following LOE, fingolimod was considered cost-effective versus IM IFNβ-1a ($118,434 per quality-adjusted life-year), despite having higher total direct costs over 10 years ($475,740 vs. $446,792). When including future price reductions following LOE, total direct costs were reduced with fingolimod and were lower than those accrued with IM IFNβ-1a over the model time horizon ($308,570 vs. $442,653). Cost-effectiveness results were sensitive to changes in both clinical parameters and medication costs. Scenario analyses demonstrated that an earlier date of LOE was associated with lower total costs.
CONCLUSIONS:
Health economic models may predict higher total costs when the price reductions following LOE are not considered. Here, oral fingolimod was seen to be cost-saving versus IM IFNβ-1a over the model time horizon when such price reductions were included. The cost implications of not accounting for future price changes may determine whether an intervention is considered cost-effective and as such may influence reimbursement decisions based on cost-effectiveness thresholds. Multiple product types (e.g., oral, injectable, and infused agents) have been approved for use as treatments for multiple sclerosis in the United States, and LOE is likely to have a different effect on each of these therapies.
What is already known about this subject
Cost-effectiveness analyses tend not to take into account price changes occurring during the product life-cycle, such as those associated with a switch to lower-priced generic versions of branded medicines following patent expiration.
Good practice research guidelines from the International Society for Pharmacoeconomics and Outcomes Research recommend that health economic models should reflect the impact of generic entry on price.
Studies that have previously investigated the impact of not including price reductions following loss of exclusivity (LOE) have shown that total costs tend to be overestimated if these price changes are not considered.
What this study adds
A cost-effectiveness analysis in multiple sclerosis was conducted in which 2 disease-modifying therapies for the treatment of multiple sclerosis were modeled to lose exclusivity during the time horizon to demonstrate the necessary parameters and assumptions required to model LOE and also the impact of including LOE versus noninclusion.
This study shows that the oral therapy fingolimod is a cost-effective treatment option for patients with relapsing-remitting multiple sclerosis when compared with intramuscular interferon beta-1a (IM IFNβ-1a), with or without inclusion of price reductions following LOE.
Fingolimod is also seen to be cost saving compared with IM IFNβ-1a when future price reductions following LOE are included in the health economic model.
Multiple sclerosis (MS) is a chronic, neurodegenerative autoimmune disease that affects around 2.3 million people worldwide and has an estimated prevalence of 140 per 100,000 persons in North America.1 Relapsing-remitting multiple sclerosis (RRMS) is the most commonly diagnosed form of MS and is characterized by sudden relapses followed by periods of relatively stable disease.2 The overall trend for patients with RRMS, however, is toward increasing levels of disability.2
Patients with relapsing forms of MS, such as RRMS, are treated with disease-modifying therapies (DMTs) to prevent the occurrence of relapses and delay disability progression.3,4 There are multiple DMTs licensed for the treatment of patients with relapsing forms of MS, including injectable therapies, such as intramuscular interferon beta-1a (IM IFNβ-1a, Avonex; 30 mcg once a week), and oral therapies, such as fingolimod (Gilenya; 0.5 mg once every day).5,6 The clinical effectiveness and cost-effectiveness of DMTs for the treatment of MS has recently received attention in the United States as part of a review by the Institute for Clinical and Economic Review (ICER).7,8 As part of the ICER review framework, the cost-effectiveness of medicines versus the relevant comparator therapy is assessed using health economic models, with cost-effectiveness defined using cost per quality-adjusted life-year (QALY) gain thresholds of $100,000 and $150,000.9
By using the cost per QALY measure of cost-effectiveness, both the relative costs and health benefits (i.e., QALYs) associated with an intervention compared with the standard of care therapy are considered over the duration of the model time horizon. However, conventional cost-effectiveness analyses tend not to take into account price changes occurring during the product life-cycle, such as those associated with a switch to lower-priced generic versions of branded medicines following patent expiration.10 As a consequence of not incorporating price reductions associated with generic entry into cost-effectiveness analyses, the total cost to the health care system for medicines that will lose exclusivity soon may be overestimated and may not fully reflect real-world payer conditions.11 A number of studies have been conducted to assess the impact of incorporating the entry of lower-priced generic products into health economic models. These have shown that taking into account the future price of medicines following loss of exclusivity (LOE) often leads to meaningful changes in cost-effectiveness results.10-14
Given the increasing use of cost-effectiveness thresholds to help inform reimbursement decisions, the option to include or exclude future price reductions following LOE may have implications for the pricing and availability of medicines.9,15 Notably, health technology assessment agencies in New Zealand, Norway, and France already require drug manufacturers to consider the impact of generic entry on future prices when submitting cost-effectiveness analyses.16-18 Also, good research practice guidelines from the International Society for Pharmacoeconomics and Outcomes Research (ISPOR) recommend considering future price changes when calculating medication costs for health economic models.19
The extent of price reductions following the entry of multiple generic products varies between products, with multi-source generic oral medicines in particular being associated with sharper reductions in price compared with large molecule or biological therapies.20 The impact of price reductions following LOE on the results of cost-effectiveness analyses is dependent, among other factors, on the types of products included as the intervention and comparator in the analysis. Here, the inclusion of price reductions after LOE has been assessed in a cost-effectiveness analysis of fingolimod (oral) versus IM IFNβ-1a (injectable) as treatments for RRMS to evaluate the impact of modeling LOE when comparing different types of MS therapy. The cost-effectiveness analysis has been conducted from the U.S. health care system payer perspective using a previously published Markov model that has been adapted to the relevant setting and to allow modeling of price reductions following LOE.21
Methods
Model Overview and Structure
The cost-effectiveness analysis was conducted over a 10-year time horizon using a previously published model that has been adapted to the U.S. health care system payer perspective.21 A 10-year time horizon was chosen in order to capture the impact to payers of price reductions following LOE in the near-term future.
Full details of the model structure have been described previously, but in brief, the model follows a Markov structure and consists of health states based on the 10 Expanded Disability Status Scale (EDSS) scores used to assess disability progression in MS.21,22 Patients entering the model were diagnosed with RRMS and were modeled to receive either fingolimod 0.5 mg once every day or IM IFNβ-1a 30 mcg once every week, as the initial therapy. These interventions were chosen for inclusion in the model as they have been compared head-to-head within the TRANSFORMS randomized clinical trial, and this also allows a comparison of 2 therapies for RRMS that have different routes of administration (oral vs. injectable).20,23
Throughout the model time horizon, patients may transition between EDSS states, and these transitions may be between EDSS states more than 1 score apart. Patients may also convert from RRMS to secondary progressive multiple sclerosis (SPMS)—a conversion from RRMS to SPMS is associated with a 1-point increase in EDSS score. Including an absorbing death state, which can be reached from any preceding state, there are 21 health states in total (EDSS states 0-9 for RRMS and SPMS, plus death).
During each 1-year cycle of the model, patients may discontinue treatment with the initial therapy. These patients are then modeled to receive best supportive care for the remainder of the time horizon. Discontinuation rates were set to 10% in Years 1 and 2 and were reduced in Year 3 and subsequent years to reflect the likelihood that patients would discontinue at a higher rate in the earlier years of treatment—this approach is consistent with previous health economic models in MS.24 Patients may also die within each cycle, with mortality incorporated in the model by adjusting general mortality by age for the relative risk of death due to MS.25,26
Patients who have not withdrawn from treatment or died within a cycle may then transition between EDSS states within RRMS or SPMS, or remain in the same EDSS state. The probability of transitioning between EDSS states was based on the natural history of MS, with transitions within RRMS adjusted by the relative risk of disease progression for fingolimod and IM IFNβ-1a, respectively, versus placebo (see the Model Inputs section). Patients who reached an EDSS state of 8 or above or who converted from RRMS to SPMS were also withdrawn from initial therapy and were modeled to receive best supportive care. These discontinuation rules were based on the assumption that patients would not receive DMTs for SPMS (nonrelapsing) and would not be used for patients with severe RRMS (EDSS state of 8 or above).
The cost and disutility of relapses that occurred during each cycle were also incorporated into the model and, as with transitions between EDSS states, were based on natural history data adjusted by the relative rate of relapse for fingolimod and IM IFNβ-1a, respectively, versus placebo.
The life table method was used to estimate the average number of patients in each EDSS state during each cycle, from which the per-cycle costs and utilities could be calculated for each treatment cohort.
Model Inputs
Each treatment cohort consisted of 1,000 patients, with patients entering the model with an average age of 29.0 years and a diagnosis of RRMS. All patients were initially distributed to EDSS states between 0 and 6, based on the aggregated data from several clinical trials in MS, as used in an ICER review of DMTs for MS.7
Data on the natural history of disease, in terms of disability progression and the rate of relapse, were based on those used in the ICER review and have been used previously in published cost-effectiveness analyses.27
Relapse rates were dependent on EDSS state and whether a patient had RRMS or SPMS, with relapses modeled to occur at a reduced frequency at higher EDSS states and following conversion to SPMS. A difference in the cost of relapse based on severity was also included in the model (see the Utility Inputs section), with severe relapses and moderate-to-mild relapses assumed to occur with probabilities of 0.187 and 0.813, respectively.28 Treatment efficacy, in terms of the relative risk of disability progression and the relapse rate ratio, relative to placebo, were based on the results of the network meta-analysis (NMA) conducted by ICER to inform its clinical and cost-effectiveness review (Table 1).7 This NMA included relevant trials from a number of approved products for the treatment of MS, in addition to fingolimod and IM IFNβ-1a.7
TABLE 1.
Model Inputs
| Parameter | Value | Source | ||
|---|---|---|---|---|
| Efficacy inputs | ||||
| Fingolimod | IM IFNβ-1a | |||
| Relative risk of disability progression | 0.68 | 0.79 | ICER (2017)7 | |
| Relative rate of relapse | 0.46 | 0.83 | ||
| Utility inputs | ||||
| Health-state utility by EDSS | 0 | 0.8752 | ICER (2017)7 Based on: Mauskopf et al. (2016)27 |
|
| 1 | 0.8342 | |||
| 2 | 0.7802 | |||
| 3 | 0.6946 | |||
| 4 | 0.6253 | |||
| 5 | 0.5442 | |||
| 6 | 0.4555 | |||
| 7 | 0.3437 | |||
| 8 | 0.0023 | |||
| 9 | -0.1701 | |||
| Adjustment to SPMS | -0.0437 | |||
| Relapse (per event) | Mild/moderate | -0.091 | ICER (2017)7 Based on: Oleen-Burkey et al. (2012)36 |
|
| Severe | -0.302 | |||
| Cost inputs, $ | ||||
| Health-state costs by EDSS | 0 | 1,859 | ICER (2017) inflated to 2017 USD using the U.S. Consumer Price Index for medical care7 Based on: Kobelt et al. (2006)37 |
|
| 1 | 3,195 | |||
| 2 | 4,531 | |||
| 3 | 5,866 | |||
| 4 | 7,203 | |||
| 5 | 8,539 | |||
| 6 | 9,875 | |||
| 7 | 11,211 | |||
| 8 | 12,547 | |||
| 9 | 13,883 | |||
| Relapse (per event) | 1,771 | |||
| Fingolimod | IM IFNβ-1a | |||
| Annual medication cost, $ | 87,025 | 82,012 | WAC (2017)30 | |
| Annual administration and monitoring costs | Year 1 | 172 | 58 | ICER (2017) inflated to 2017 USD using the U.S. Consumer Price Index for medical care7 |
| Year 2+ | 76 | 39 | ||
| LOE inputs | ||||
| Fingolimod | IM IFNβ-1a | |||
| Cycle number of LOE | 4 | 10 | FDA Orange Book and Avonex32,33 | |
| Price reduction on LOE, % | Year 1 | 80 | 27 | IMS (2016)20 WAC (2017)30 |
| Year 2 | 85 | |||
| Year 3+ | 90 | |||
| Patients switching to generic versions on LOE, % | 88 | 88 | IMS (2016)20 | |
EDSS = Expanded Disability Status Scale; FDA = U.S. Food and Drug Administration; ICER = Institute for Clinical and Economic Review; IM IFNβ-1a = intramuscular interferon beta-1a; LOE = loss of exclusivity; SPMS = secondary progressive multiple sclerosis; USD = U.S. dollars; WAC = wholesale acquisition cost.
Utility Inputs
The life-years accumulated by patients in each treatment cohort in the model were adjusted by the utility associated with the occupancy of each EDSS health state and also the occurrence and severity of relapses, with higher EDSS states and severe relapses associated with a reduction in utility. The utility values used in the model were based on those used in the ICER review (Table 1).7 The health-state utility values used in the model were originally derived using EuroQol-5 Dimensions (EQ-5D) index scores for each EDSS state (based on responses from RRMS patients as part of clinical trials), with an adjustment made for the corresponding EDSS states in SPMS.27
Only direct medical costs were included in the cost-effectiveness analysis, as these were considered to be most relevant to the payer perspective. These direct costs included health-state costs by EDSS score, the cost per relapse, medication costs, and other drug-related costs (i.e., administration and monitoring; Table 1). Health-state costs, the cost per relapse, and administration and monitoring costs were based on those used in the ICER review and were adjusted for inflation (2017 cost year) using the U.S. Consumer Price Index for medical care.7,29 Medication costs were based on wholesale acquisition costs (WAC) and the dosing schedule outlined in the prescribing information for each initial therapy.5,6,30
In the analysis in which price reductions following LOE was not modeled (referred to as the “without LOE” analysis), the annual medication cost based on WAC price was applied over the entire duration of the time horizon. In the converse analysis, in which the price reductions following LOE were applied (referred to as the “with LOE” analysis), the annual medication cost associated with each initial therapy was reduced at a specified cycle number in the model in order to reflect a switch to lower-priced generic versions of the initial, branded therapy. This reduction in price was applied for a proportion of patients following LOE of the initial, branded therapy, to reflect the likelihood that some patients would continue treatment with the initial, branded therapy following LOE (i.e., would not switch to the generic version).
Assumptions were required to model the following parameters: (a) the cycle number that LOE is modeled to occur (i.e., the date of LOE); (b) the percentage reduction in price of the initial, branded therapy on LOE; and (c) the percentage of patients who are modeled to switch to the lower-priced generic versions of the initial, branded therapy on LOE. All other model parameters were kept the same as the “without LOE” analysis. This included an assumption that treatment efficacy would remain the same between branded and generic versions, based on the need for generic drugs to demonstrate bioequivalence in order to meet regulatory standards.31
In the base case “with LOE” analysis, LOE was modeled to occur at cycle 4 for fingolimod and cycle 10 for IM IFNβ-1a (Table 1), based on current expectations for the date of LOE; and for both treatment cohorts, the proportion of patients switching to lower-priced generic versions on LOE was modeled to be 88%, based on the percentage of prescription drugs dispensed as generic medicines in the United States.20,32,33 As the relative price of generic medicines compared with their reference products varies between products, different percentage price reductions on LOE were used for fingolimod and IM IFNβ-1a in the “with LOE” analysis (Table 1).20 Price reductions following LOE for fingolimod were based on historical estimates of the average percentage reduction from the branded price for oral medicines that lost exclusivity in the United States in 2011-2013;20 whereas for IM IFNβ-1a, the price reduction on LOE was based on the relative difference in WAC price between branded and generic versions of glatiramer acetate, another injectable therapy for the treatment of MS.30
Model Outcomes
Model outcomes included the total per-patient QALYs and costs accrued over the model time horizon for each treatment cohort, with cost-effectiveness assessed using the incremental cost per QALY gained (fingolimod vs. IM IFNβ-1a). Both costs and QALYs were discounted at a rate of 3% per year, which is consistent with previous cost-effectiveness models that have been conducted for the U.S. setting.27
Sensitivity Analyses
Probabilistic sensitivity analyses were conducted to assess the level of uncertainty in the cost-effectiveness results of the “with LOE” and “without LOE” analyses. In these analyses, model parameters were varied simultaneously over 1,000 simulations, with values for each parameter randomly selected from the appropriate probability distribution for each iteration (Appendix A, available in online article).
One-way sensitivity analyses were also conducted to identify the most influential inputs on the cost-effectiveness results in the “with LOE” and “without LOE” analyses. For each parameter included in the deterministic sensitivity analyses, the limits were given by the upper and lower limits of confidence intervals for the relative risk of disability progression and relapse rate ratios, and by ± 20% of the mean value for all other parameters.
A scenario analysis was conducted for the “with LOE” analysis in which the percentage reduction on LOE was modeled to be the same for both fingolimod and IM IFNβ-1a. The price reductions were based on historical estimates for all medicines that lost exclusivity in the United States between 2002 and 2014 (51% in Year 1, 57% in Year 2, and 66% in Years 3+).20 An additional scenario analysis for the “with LOE” analysis was performed to assess the impact of altering the date of LOE on the cost-effectiveness results, with all other model parameters kept the same. In these analyses, the date of LOE was varied across the 10-year time horizon in 1-cycle increments for each DMT in turn, with the date of LOE for the other DMT kept the same as the “with LOE” base case.
Results
Base Case Results and Probabilistic Sensitivity Analysis Results
In the “without LOE” analysis, fingolimod was associated with higher costs and more QALYs gained versus IM IFNβ-1a over the 10-year time horizon (Table 2). The incremental cost per QALY was $118,434 for fingolimod versus IM IFNβ-1a, which is less than the $150,000 per QALY gained cost-effectiveness threshold commonly cited in the United States.9
TABLE 2.
Deterministic and Probabilistic Results
| Treatment | Cost, $ | QALY | Incremental Cost, $ | Incremental QALYs | Cost per QALY, $ |
|---|---|---|---|---|---|
| Base case deterministic | |||||
| Without LOE | |||||
| IM IFNβ-1a | 446,792 | 4.74 | – | – | – |
| Fingolimod | 475,740 | 4.99 | 28,948 | 0.24 | 118,434 |
| With LOE | |||||
| IM IFNβ-1a | 442,653 | 4.74 | – | – | – |
| Fingolimod | 308,570 | 4.99 | -134,084 | 0.24 | Dominant |
| Probabilistic | |||||
| Without LOE | |||||
| IM IFNβ-1a | 447,844 | 4.74 | – | – | – |
| Fingolimod | 476,486 | 4.98 | 28,642 | 0.24 | 117,614 |
| With LOE | |||||
| IM IFNβ-1a | 393,462 | 4.75 | – | – | – |
| Fingolimod | 289,547 | 4.98 | -103,915 | 0.24 | Dominant |
IM IFNβ-1a = intramuscular interferon beta-1a; LOE = loss of exclusivity; QALY = quality-adjusted life-year.
In the “with LOE” analysis, total costs were reduced for both fingolimod and IM IFNβ-1a compared with the “without LOE” analysis (incremental costs for fingolimod vs. IM IFNβ-1a w e r e reduced from $28,948 to -$134,084 on incorporation of future price reductions following LOE; Table 2). Total costs were now lower for fingolimod compared with IM IFNβ-1a, with fingolimod shown to dominate IM IFNβ-1a (i.e., associated with lower costs and more QALYs gained compared with IM IFNβ-1a).
Average probabilistic results were consistent with those from the base case analysis, suggesting that the model results were generally robust to changes in model parameters (Table 2). Whereas the total QALYs were similar between average probabilistic results and the base case analysis in both “with LOE” and “without LOE” analyses, there was a notable difference in total costs between average probabilistic and base case results in the “with LOE” analysis only. This variability in results reflects the greater uncertainty in costs once LOE model parameters are included. However, despite this additional uncertainty, fingolimod was shown to be a cost-effective treatment option versus IM IFNβ-1a in all simulations in the “with LOE” analysis against the threshold of $100,000 per QALY (Appendix B, available in online article).
Deterministic Sensitivity Results
In the “with LOE” and “without LOE” analyses, the relative risk of disability progression for fingolimod and IM IFNβ-1a versus placebo and the medication costs of each initial therapy were identified in one-way sensitivity analyses as the main drivers of the model (Figures 1 and 2).
FIGURE 1.
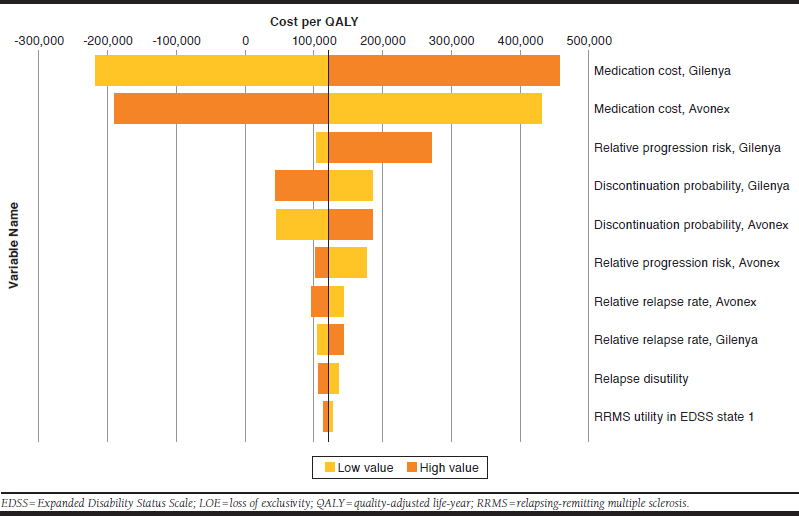
Deterministic Sensitivity Analysis (Without LOE)
FIGURE 2.
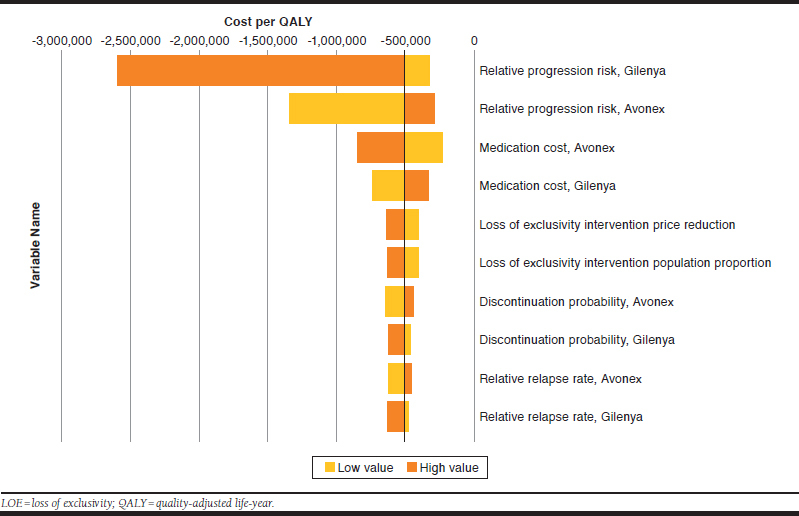
Deterministic Sensitivity Analysis (with LOE)
In the “with LOE” analysis, the price reduction on LOE and the percentage of patients who are modeled to switch to the lower-priced generic versions on LOE were also identified as being key determinants for the cost-effectiveness results. These LOE model parameters directly affect the overall medication cost, hence the apparent reduced impact of varying medication cost shown in Figure 2.
Scenario Analyses
In the “with LOE” analysis in which the same percentage price reductions were applied for both fingolimod and IM IFNβ-1a, the incremental costs for fingolimod versus IM IFNβ-1a were -$80,912, which represents a lower cost saving compared with the base case analysis in which higher price reductions on LOE were assumed for fingolimod, as an oral medicine, compared with IM IFNβ-1a. Results from scenario analyses in which the date of LOE was varied across the time horizon demonstrated the impact of the timing of LOE on the incremental costs associated with each treatment cohort. As expected, scenarios in which the date of LOE was modeled to be nearer to the start of the time horizon resulted in a reduced total cost for that therapy (Figure 3). Compared with the base case assumptions of a LOE date of cycle 4 for fingolimod and cycle 10 for IM IFNβ-1a, the date of LOE for fingolimod would have to be delayed by 5 years in the model for total costs to be greater than IM IFNβ-1a.
FIGURE 3.
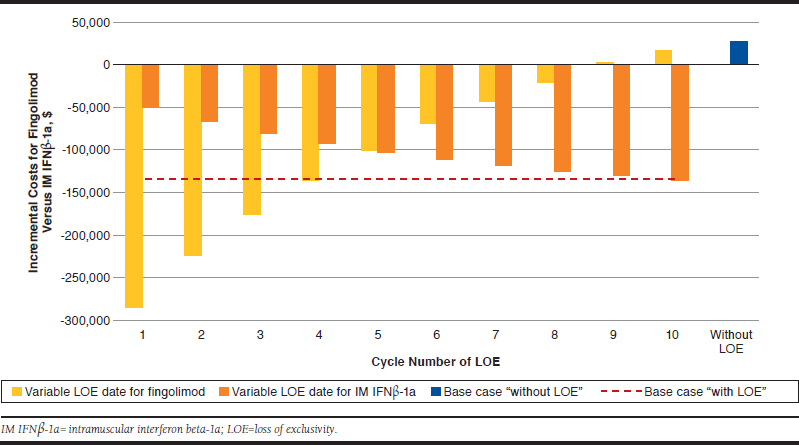
Scenario Analyses in Which the Date of LOE Was Varied
Discussion
Overall, when considering price reductions following LOE, oral fingolimod was not only associated with a greater number of QALYs gained compared with the injectable IM IFNβ-1a (as shown in the “without LOE” analysis), but was also seen to be cost-saving versus IM IFNβ-1a over the model time horizon in the “with LOE” analysis.
Given that both therapies are expected to lose exclusivity within the next 10 years, the total costs estimated in the “without LOE” analysis may not be representative of the future cost for the health care system associated with these therapies. Total costs for both therapies were higher when a constant annual medication cost was assumed in the “without LOE” analysis than compared with the “with LOE” analysis, as seen in other cost-effectiveness analyses that include future price reductions following LOE.14 Furthermore, deterministic sensitivity analyses conducted here showed that the inclusion of price reductions following LOE (and medication cost, in general) has a notable impact on cost-effectiveness results in the modeling of these treatments for MS. Given these cost implications, the inclusion of such price reductions over the model time horizon may determine whether an intervention is considered cost-effective and, as such, may influence reimbursement decisions based on cost-effectiveness thresholds.
Small molecule oral medications have relatively less manufacturing complexity compared with biologics and, consequently, several generics may come to the U.S. market for these medications.34 Analyses have shown that with the availability of an increasing number of generic alternatives, the average price compared with brand medications will tend to decrease.35 Currently, large molecules or biological medications that lose patent exclusivity do not face as many competitors or the downward, market-driven pricing trends.
Limitations
As described in the ISPOR good research practice guidelines, the modeling of price erosion because of the entry of generics following LOE requires the introduction of additional variables to the model, including the percentage of patients who switch to the lower-priced generic versions and the percentage reduction in price of the initial, branded therapy following LOE, as well as the date that LOE is predicted to occur.19
Estimates for the 2 former parameters can be derived from retrospective data for medicines that have recently lost exclusivity, as done here. However, these are based on historical estimates with other (albeit similar) therapies and may, therefore, not fully predict the effect that LOE will have on specific therapies in the future. With regards to the latter parameter, the date of LOE is difficult to accurately forecast because of ongoing challenges with patents, such as extensions, and again requires assumptions to be made based on current expectations. To address the uncertainty in when either therapy will lose exclusivity, scenarios were explored here in which the date of LOE was varied incrementally across the entire duration of the time horizon.
Despite the inherent difficulties of modeling LOE, it is notable that some health technology assessment agencies, such as those in New Zealand, Norway, and France, already require drug manufacturers to consider the impact of generic entry on future prices when submitting cost-effectiveness analyses.16-18
Conclusions
Given the impact demonstrated here of LOE on the total costs associated with both the intervention and comparator, the inclusion of future price reductions in determining the cost-effectiveness of treatments for MS is an important consideration that is highly relevant to U.S. health care payers. Multiple product types (e.g., oral, injectable, and infused agents) have been approved for use as treatments for MS in the United States, and LOE is likely to have a different impact on each of these therapies.
APPENDIX A. Sensitivity Analysis Inputs
| Input | Value | Probabilistic | Deterministic | |||
|---|---|---|---|---|---|---|
| Distribution | Normal/Log-Normal | Beta/Dirichlet | % of Mean Variation (±) | |||
| SE as Proportion of Mean, % | Sample Size | |||||
| Population size in each EDSS state | Varies by EDSS (not shown) | Log-normal | 10 | – | 20 | |
| Discontinuation probabilities | 0.1 | Beta | – | 1,000 | 20 | |
| Natural history EDSS transitions | RRMS-RRMS | Transition matrix (not shown) | Dirichlet | – | 900 | – |
| SPMS-SPMS | Transition matrix (not shown) | Dirichlet | – | 925 | – | |
| Relative mortality due to MS | By EDSS state | Varies by EDSS (not shown) | Normal | 10 | – | 20 |
| Base utility | EDSS 0 | 0.8752 | Gamma | 10 | – | 20 |
| Utility adjustment (RRMS) | By EDSS state | Varies by EDSS (not shown) | 1-Gamma | 10 | – | 20 |
| Utility adjustment (SPMS) | -0.0437 | Gamma | 10 | – | 20 | |
| LOE price reduction | Fingolimod | Varies by year (Table 1) | Beta | – | 1,000 | 20 |
| IM IFNβ-1a | Beta | – | 1,000 | 20 | ||
| LOE proportion of population switching | Fingolimod | Varies by year (Table 1) | Beta | – | 1,000 | 20 |
| IM IFNβ-1a | Beta | – | 1,000 | 20 | ||
| Input | Probabilistic | Deterministic | ||||
| Distribution | LCL | UCL | ||||
| Age of cohort | 29 | Log-normal | 23 | 35 | ||
| Relative risk of disability progression versus placebo | Fingolimod | 0.68 | Log-normal | 0.51 | 0.90 | Lower and upper estimate based on LCL and UCL, respectively |
| IM IFNβ-1a | 0.79 | Log-normal | 0.63 | 1.00 | ||
| Relative rate of relapse versus placebo | Fingolimod | 0.46 | Log-normal | 0.39 | 0.55 | |
| IM IFNβ-1a | 0.83 | Log-normal | 0.74 | 0.94 | ||
| Natural history of relapse | By EDSS state (RRMS) | |||||
| 0 | 0.71 | Normal | 0.57 | 0.85 | ||
| 1 | 0.73 | Normal | 0.58 | 0.88 | ||
| 2 | 0.68 | Normal | 0.54 | 0.82 | ||
| 3 | 0.72 | Normal | 0.58 | 0.86 | ||
| 4 | 0.71 | Normal | 0.57 | 0.85 | ||
| 5 | 0.59 | Normal | 0.47 | 0.71 | ||
| 6 | 0.49 | Normal | 0.39 | 0.59 | ||
| 7 | 0.51 | Normal | 0.41 | 0.61 | ||
| 8 | 0.51 | Normal | 0.41 | 0.61 | ||
| 9 | 0.51 | Normal | 0.41 | 0.61 | ||
| By EDSS state (SPMS) | ||||||
| 1 | 0 | Normal | 0 | 0.1 | ||
| 2 | 0.47 | Normal | 0.38 | 0.56 | ||
| 3 | 0.88 | Normal | 0.7 | 1.06 | ||
| 4 | 0.55 | Normal | 0.44 | 0.66 | ||
| 5 | 0.52 | Normal | 0.42 | 0.62 | ||
| 6 | 0.45 | Normal | 0.36 | 0.54 | ||
| 7 | 0.34 | Normal | 0.27 | 0.41 | ||
| 8 | 0.34 | Normal | 0.27 | 0.41 | ||
| 9 | 0.34 | Normal | 0.27 | 0.41 | ||
| Natural history EDSS transitions (RRMS-SPMS) | 0 | 0 | Beta | 0 | 0.003 | |
| 1 | 0.003 | Beta | 0.002 | 0.004 | ||
| 2 | 0.032 | Beta | 0.026 | 0.038 | ||
| 3 | 0.117 | Beta | 0.094 | 0.14 | ||
| 4 | 0.21 | Beta | 0.168 | 0.252 | ||
| 5 | 0.299 | Beta | 0.239 | 0.359 | ||
| 6 | 0.237 | Beta | 0.19 | 0.284 | ||
| 7 | 0.254 | Beta | 0.203 | 0.305 | ||
| 8 | 0.153 | Beta | 0.122 | 0.184 | ||
| 9 | 1 | Beta | 0.9 | 1 | ||
Source: Institute for Clinical and Economic Review. Confidence limits based on those reported in the ICER disease-modifying therapies for relapsing and primary-progressive multiple sclerosis: effectiveness and value.7
EDSS = Expanded Disability Status Scale; ICER = Institute for Clinical and Economic Review; IM IFNβ-1a = intramuscular interferon beta-1a; LCL = lower confidence limit; LOE = loss of exclusivity; MS = multiple sclerosis; RRMS = relapsing-remitting multiple sclerosis; SE = standard error; SPMS = secondary progressive multiple sclerosis; UCL = upper confidence limit.
APPENDIX B. Probabilistic Sensitivity Analysis (with LOE)

REFERENCES
- 1.Browne P, Chandraratna D, Angood C, et al. Atlas of multiple sclerosis 2013: a growing global problem with widespread inequity. Neurology. 2014;83(11):1022-24. [DOI] [PMC free article] [PubMed] [Google Scholar]
- 2.Weinshenker BG, Bass B, Rice GP, et al. The natural history of multiple sclerosis: a geographically based study. I. Clinical course and disability. Brain. 1989;112(Pt 1):133-46. [DOI] [PubMed] [Google Scholar]
- 3.Trojano M, Paolicelli D, Tortorella C, et al. Natural history of multiple sclerosis: have available therapies impacted long-term prognosis? Neurol Clin. 2011;29(2):309-21. [DOI] [PubMed] [Google Scholar]
- 4.Tramacere I, Del Giovane C, Salanti G, D’Amico R, Pacchetti I, Filippini G. Immunomodulators and immunosuppressants for relapsing-remitting multiple sclerosis: a network meta-analysis. Cochrane Database Syst Rev. 2015;(9):Cd011381. [DOI] [PMC free article] [PubMed] [Google Scholar]
- 5.Avonex (interferon beta-1a) injection, for intramuscular injection. Biogen . March 2016. Available at: https://www.avonex.com/content/dam/commercial/multiple-sclerosis/avonex/pat/en_us/pdf/Avonex_Prescribing_Information.pdf. Accessed February 19, 2019.
- 6.Gilenya (fingolimod) capsules, for oral use. Novartis . January 2019. Available at: https://www.pharma.us.novartis.com/sites/www.pharma.us.novartis.com/files/gilenya.pdf. Accessed February 19, 2019.
- 7.Institute for Clinical and Economic Review. Disease-modifying therapies for relapsing and primary-progressive multiple sclerosis: effectiveness and value. Evidence report . January 26, 2017. Available at: https://icer-review.org/wp-content/uploads/2016/08/CTAF_MS_Evidence_Report_012617.pdf. Accessed February 19, 2019.
- 8.Institute for Clinical and Economic Review; California Technology Assessment Forum. Disease modifying therapies for relapsing-remitting multiple sclerosis: effectiveness and value. Background and scope . July 22, 2016. Available at: https://icer-review.org/wp-content/uploads/2016/07/Final_Scope_RRMS_072216.pdf. Accessed February 19, 2019.
- 9.Institute for Clinical and Economic Review. ICER value assessment framework . Available at: https://icer-review.org/methodology/icers-methods/icer-value-assessment-framework/. Accessed March 11, 2019.
- 10.Hoyle M. Accounting for the drug life cycle and future drug prices in cost-effectiveness analysis. Pharmacoeconomics. 2011;29(1):1-15. [DOI] [PubMed] [Google Scholar]
- 11.Hoyle M. Future drug prices and cost-effectiveness analyses. Pharmacoeconomics. 2008;26(7):589-602. [DOI] [PubMed] [Google Scholar]
- 12.Shih YC, Han S, Cantor SB. Impact of generic drug entry on cost-effectiveness analysis. Med Decis Making. 2005; 25(1):71-80. [DOI] [PubMed] [Google Scholar]
- 13.Gandhi SK, Jensen MM, Fox KM, Smolen L, Olsson AG, Paulsson T. Cost-effectiveness of rosuvastatin in comparison with generic atorvastatin and simvastatin in a Swedish population at high risk of cardiovascular events. Clinicoecon Outcomes Res. 2012;4:1-11. [DOI] [PMC free article] [PubMed] [Google Scholar]
- 14.Guertin JR, Mitchell D, Ali F, LeLorier J. Bias within economic evaluations - the impact of considering the future entry of lower-cost generics on currently estimated incremental cost-effectiveness ratios of a new drug. Clinicoecon Outcomes Res. 2015;7:497-503. [DOI] [PMC free article] [PubMed] [Google Scholar]
- 15.Pizzi LT. The Institute for Clinical and Economic Review and its growing influence on the U.S. healthcare. Am Health Drug Benefits. 2016;9(1):9-10. [PMC free article] [PubMed] [Google Scholar]
- 16.Pharmaceutical Management Agency (PHARMAC). Prescription for pharmacoeconomic analysis - methods for cost-utility analysis . Version 2.2. August 2015. Available at: https://www.pharmac.govt.nz/medicines/how-medicines-are-funded/economic-analysis/. Accessed February 19, 2019.
- 17.Norwegian Medicines Agency (NOMA). Guidelines for the submission of documentation for single technology assessment (STA) of pharmaceuticals . October 15, 2018. Available at: https://legemiddelverket.no/english/public-funding-and-pricing/documentation-for-sta/guidelines-for-the-submission-of-documentation-for-single-technology-assessment-sta-of-pharmaceuticals. Accessed March 5, 2019.
- 18.Haute Autorité de Santé (HAS). Choices in methods for economic evaluation . October 2011. Available at: http://www.has-sante.fr/portail/jcms/r_1499251/en/choices-in-methods-for-economic-evaluation. Accessed February 19, 2019.
- 19.Mycka JM, Dellamano R, Kolassa EM, et al. Good research practices for measuring drug costs in cost effectiveness analyses: an industry perspective: the ISPOR Drug Cost Task Force report—part V. Value Health. 2010;13(1):25-27. [DOI] [PubMed] [Google Scholar]
- 20.IMS Institute for Healthcare Informatics. Price declines after branded medicines lose exclusivity in the U.S . January 2016. Available at: https://www.iqvia.com/-/media/iqvia/pdfs/institute-reports/price-declines-after-branded-medicines-lose-exclusivity-in-the-us.pdf. Accessed February 19, 2019.
- 21.Maruszczak MJ, Montgomery SM, Griffiths MJ, Bergvall N, Adlard N. Cost-utility of fingolimod compared with dimethyl fumarate in highly active relapsing-remitting multiple sclerosis (RRMS) in England. J Med Econ. 2015;18(11):874-85. [DOI] [PubMed] [Google Scholar]
- 22.Kurtzke JF. Rating neurologic impairment in multiple sclerosis: an expanded disability status scale (EDSS). Neurology. 1983;33(11):1444-52. [DOI] [PubMed] [Google Scholar]
- 23.Cohen JA, Barkhof F, Comi G, et al. ; TRANSFORMS study group. Oral fingolimod or intramuscular interferon for relapsing multiple sclerosis. N Engl J Med. 2010;362(5):402-15. [DOI] [PubMed] [Google Scholar]
- 24.Tappenden P, McCabe C, Chilcott J, et al. Cost-effectiveness of disease-modifying therapies in the management of multiple sclerosis for the Medicare population. Value Health. 2009;12(5):657-65. [DOI] [PubMed] [Google Scholar]
- 25.Arias E. United States life tables, 2011. Natl Vital Stat Rep. 2015;64(11):1-63. [PubMed] [Google Scholar]
- 26.Pokorski RJ. Long-term survival experience of patients with multiple sclerosis. J Insur Med. 1997;29(2):101-06. [PubMed] [Google Scholar]
- 27.Mauskopf J, Fay M, Iyer R, Sarda S, Livingston T. Cost-effectiveness of delayed-release dimethyl fumarate for the treatment of relapsing forms of multiple sclerosis in the United States. J Med Econ. 2016;19(4):432-42. [DOI] [PubMed] [Google Scholar]
- 28.Nickerson M, Cofield SS, Tyry T, Salter AR, Cutter GR, Marrie RA. Impact of multiple sclerosis relapse: The NARCOMS participant perspective. Mult Scler Relat Disord. 2015;4(3):234-40. [DOI] [PubMed] [Google Scholar]
- 29.U.S. Bureau of Labor Statistics. Consumer Price Index – all urban consumers: medical care . Retrieved July 27, 2018. Available at: https://data.bls.gov/timeseries/CUUR0000SAM?output_view=pct_12mths. Accessed March 11, 2019.
- 30.AnalySource. Wholesale acquisition price–Avonex and Gilenya . June 12, 2017. Available at: https://www.analysource.com/. Accessed February 19, 2019.
- 31.U.S. Food and Drug Administration. Generic drugs . Available at: https://www.fda.gov/Drugs/ResourcesForYou/Consumers/BuyingUsingMedicineSafely/UnderstandingGenericDrugs/default.htm. Accessed February 19, 2019.
- 32.U.S. Food and Drug Administration. Orange Book: approved drug products with therapeutic equivalence evaluations. Patent and exclusivity for: N022527 . Available at: http://www.accessdata.fda.gov/scripts/cder/ob/patent_info.cfm?Product_No=001&Appl_No=022527&Appl_type=N. Accessed February 19, 2019.
- 33.FiercePharma. Avonex . Available at: http://www.fiercepharma.com/special-report/avonex-1. Accessed February 19, 2019.
- 34.Lee CY, Chen X, Romanelli RJ, Segal JB. Forces influencing generic drug development in the United States: a narrative review. J Pharm Policy Practice. 2016;9:26. [DOI] [PMC free article] [PubMed] [Google Scholar]
- 35.Generic Pharmaceutical Association (GPhA). 2016 generic drug savings and access in the United States report . Available at: https://www.accessiblemeds.org/sites/default/files/2018-04/2016-SavingsRepor%2010.19%20 FINAL.pdf. Accessed February 19, 2019.
- 36.Oleen-Burkey M, Castelli-Haley J, Lage MJ, Johnson KP. Burden of a multiple sclerosis relapse: the patient’s perspective. Patient. 2012;5(1):57-69. [DOI] [PubMed] [Google Scholar]
- 37.Kobelt G, Berg J, Atherly D, Hadjimichael O. Costs and quality of life in multiple sclerosis: a cross-sectional study in the United States. Neurology. 2006;66(11):1696-702. [DOI] [PubMed] [Google Scholar]