

Abstract
BACKGROUND:
Drug-related problems (DRPs) are prevalent among chronic kidney disease (CKD) patients. However, little is known about their severity and management by community pharmacists.
OBJECTIVES:
To (a) describe the prevalence of DRPs by severity level in CKD patients and (b) assess the effect of a training-and-communication network program in nephrology (ProFiL) on these DRPs.
METHODS:
This is a secondary analysis of a cluster randomized controlled trial evaluating the effect of the ProFiL-program. In 6 CKD clinics, patients at CKD stage 3 or 4 and their community pharmacists were recruited and assigned to the ProFiL group or a usual care (UC) group. Using validated criteria, 2 pharmacists identified DRPs and assessed their severity at baseline and after 12 months. The mean annual change in the number of DRPs per patient by severity level was assessed using a 2-level multivariable linear mixed-effects model.
RESULTS:
A total of 494 pharmacists and 442 patients participated. At baseline, the prevalence (mean number of DRPs per patient [SD]) of mild DRPs (e.g., requiring dosage adjustment) and moderate DRPs (e.g., drug adherence requiring a monitoring plan) were 0.55 (0.98) and 1.04 (1.51), respectively. After 12 months, an unadjusted incremental annual reduction of 0.34 moderate DRPs (95% CI = -0.66 to -0.01) was observed in the ProFiL group compared with the UC group. After adjustment, no between-group differences were observed.
CONCLUSIONS:
Among patients followed in CKD clinics, most DRPs have a moderate severity requiring specific monitoring by pharmacists. The benefit of continuing education programs, such as ProFiL, to reduce moderate DRPs remains to be determined.
What is already known about this subject
Chronic kidney disease (CKD) patients are at high risk of suffering drug-related problems (DRPs), not only because of their decreased kidney function but also because they receive multiple medications prescribed simultaneously by different physicians.
Nonadherence, adverse events, drug interactions, and inappropriate doses are DRPs frequently observed in CKD patients.
What this study adds
The most frequently observed DRPs in patients with CKD are nonadherence to drug therapy and the use of drugs not recommended or requiring a dose adjustment in CKD.
Nonadherence is deemed a moderately severe DRP, which requires the community pharmacist to implement a monitoring plan and follow-up.
A training-and-communication network program in nephrology intended for community pharmacists may serve to improve the detection and management of moderately severe DRPs in CKD patients.
Chronic kidney disease (CKD) patients are medically complex cases. They take a mean of 10 to 13 medications and are followed by several physicians.1 These factors increase the patients’ risk of drug-related problems (DRPs).2,3 In CKD patients, the prevalence of DRPs has been estimated at 2.8 (95% confidence interval [CI] = 2.3-3.2) DRPs/patient for creatinine clearance 30-59 mL/min4; and 4-8 DRPs per patient on hemodialysis.4,5
Common DRPs in CKD are adverse events, drug interactions, and inappropriate doses; these DRPs result from decreased kidney function.2,3,6 The mortality rate associated with inappropriate drug use is 40% higher in patients with an estimated glomerular filtration rate (eGFR) < 60 mL/min/1.73m2 compared with patients without CKD.7 CKD patients also demonstrate poor adherence to pharmacotherapy, particularly cardiovascular medications.8 A large variation has been documented in the prevalence of nonadherence in end-stage renal disease (3%-80%), which may be partly explained by different definitions and measurements of nonadherence.9 Nevertheless, the information about the severity of these DRPs is still limited.
In the hospital context, researchers have sought to measure DRP severity in terms of clinical and economic consequences.10,11 So far, no information is available on the severity of DRPs detected among CKD patients followed in an ambulatory setting where community pharmacists play a crucial role in DRP detection and management.12 Moreover, nothing is known about the effect of community pharmacists’ interventions on DRP prevalence by severity level.
The objectives of this study were to (a) describe DRP prevalence according to severity in CKD nonhemodialysis patients followed in 6 ambulatory CKD clinics, and (b) assess the effect of a training-and-communication network program in nephrology for community pharmacists on DRP prevalence, when classified by severity level.
Methods
Design, Setting, and Participants
This project is a secondary analysis of a cluster randomized controlled trial evaluating the effect of a training-and-communication program in nephrology for community pharmacists, the ProFiL program, on the quality of medication use in CKD patients. The ProFiL study has been fully described elsewhere.13 This project was approved by the ethics and research board of the Centre hospitalier de l’Université de Montréal. Participating patients and community pharmacists signed an informed consent form.
In short, potentially eligible patients and their community pharmacists in 6 CKD clinics in Quebec, Canada, were invited to participate in the study. Eligible patients met the following criteria: (a) aged ≥ 18 years; (b) an eGFR of 30-59 mL/min/1.73m2 (stage 3 CKD) or an eGFR of 15-29 mL/min/1.73m2 (stage 4 CKD), as determined by the most recent laboratory result available in the CKD clinic; (c) speaking English or French; (d) followed by an eligible community pharmacy; and (e) agreeing to be followed by the same community pharmacy for the duration of the study. To be eligible, the pharmacy had to meet the following criteria: If the pharmacy was open 7 days per week, participating pharmacists had to cover at least 35 hours per week for a workload of < 250 prescriptions per day or at least 60 hours per week for a workload of > 250 prescriptions per day; if the pharmacy was open fewer than 7 days per week, participating pharmacists had to cover at least 50% of the working hours.
Each cluster, comprising a community pharmacy with pharmacists and patients, was randomly assigned to either the ProFiL group or the control group using a 2:1 ratio (2 ProFiL; 1 usual care [UC]). Pharmacies serving patients from more than 1 clinic were randomized only once. During the 12 months of the study, ProFiL pharmacists had access to the ProFiL program, while UC pharmacists continued to provide their usual pharmaceutical care.
ProFiL Program
ProFiL is a training-and-communication network program in nephrology for community pharmacists that consists of a web-based training program supported by a clinical guide, a discussion forum, the provision of a clinical summary, and a facilitated access to a pharmacist with expertise in nephrology.13 The training program proposed a systematic approach to prevent, detect, and manage clinically significant DRPs featured in the Pharmacotherapy Assessment in Chronic Renal Disease (PAIR) criteria (see the Identification of DRPs section for a complete description).14
The systematic approach was based on the analysis of all relevant information available to ProFiL pharmacists, including the clinical summary. The clinical summary was completed for each patient by staff at the CKD clinic and sent to the community pharmacists to facilitate the detection of DRPs. It included a list of patients’ health problems, their eGFRs according to the Chronic Kidney Disease Epidemiology Collaboration equation,15 and a list of their medications as recorded in the CKD clinic chart. During the study, community pharmacists were encouraged to consult a nephrology pharmacist when needed.
In the UC group, the clinical summary was completed but not sent to the community pharmacists. UC pharmacists did not have access to the ProFiL program, but they could contact the CKD clinic as usual to obtain relevant clinical information or suggest changes to pharmacotherapy.
Identification of DRPs
Study patients were evaluated at baseline (T0) and 12 months later (T12). For each patient, DRPs were identified at T0, using the information collected for the year preceding recruitment; and at T12, with the information collected during the study. Two pharmacists independently identified DRPs in 442 study patients based on information from their community pharmacy medication renewal charts, their clinical summaries, and their use of over-the-counter (OTC) medications and natural health products as documented in a telephone interview.
Pharmacists detected DRPs using a systematic approach based on the PAIR criteria—a list of 50 DRPs deemed clinically significant and requiring a community pharmacist’s intervention.14 The PAIR criteria have shown good interrater reliability, with kappa coefficients varying from 0.80 to 1.00 and high test-retest reliability, with kappa coefficients from 0.74 to 1.00.14 Using these criteria, DRPs were classified into 7 categories: (1) use of drugs not recommended or requiring a dose adjustment in CKD; (2) nonadherence to drug therapy; (3) uncontrolled blood pressure; (4) hypoglycemia secondary to sulfonylureas; (5) drug interactions and/or drug used inappropriately; (6) smoking; and (7) use of OTC medications and natural health products not recommended in CKD. When an evaluation was discordant, the pharmacists were required to discuss it and reach a consensus.16 These evaluations were not transmitted to community pharmacists.
Based on the evaluations conducted at T0 and T12, DRPs were classified into three categories: (1) “maintained” if detected at T0 and T12; (2) “resolved” if detected only at T0; and (3) “new” if detected only at T12.
Assessment of DRP Severity
The severity of the identified DRPs was assessed using the Severity Categorization for Pharmaceutical Evaluation (SCOPE) criteria.17 According to these criteria, severity is determined by the intensity of the pharmaceutical intervention required to appropriately manage DRPs. These criteria propose 3 categories of severity (mild, moderate, and severe) with 2 levels of interventions per category.
Level I interventions (mild severity) consist of preventing a DRP’s occurrence through patient education or the transmission of relevant clinical information to the clinician. At level II (mild severity), a 1-time intervention, such as a pharmaceutical opinion issued to the treating physician, is required to resolve a DRP. The pharmaceutical opinion is a reasoned assessment, given under the pharmacist’s legal authority on the patient’s medication history or on the therapeutic value of a prescribed treatment or combination of treatments.18 At level III (moderate severity), pharmacists need to implement specific monitoring and a follow-up plan to manage a DRP. When a DRP is more severe, patients need to be referred to their physician or CKD clinic as soon as possible (at level IV, moderate); need to be referred immediately to the emergency room or to their physician (at level V, severe); or require immediate assistance, in which case 911 should be called (at level VI, severe). The test-retest reliability and the interrater reliability of the SCOPE criteria varied from 0.79 to 0.90 and 0.72 to 0.82, respectively.17
The SCOPE criteria were applied by 1 of 3 pharmacists to all DRPs identified at T0 and/or T12. Considering the good reliability of the SCOPE criteria, pharmacists did not have to reach a consensus on severity.
Statistical Analysis
Patient characteristics were described using means (standard deviation [SD]) for continuous variables and a number (proportion) for categorical variables. For each patient, the number of DRPs at each level of severity was computed at T0 and T12 as well as the change from baseline to the end of the study (T12-T0).
The mean number of mild, moderate, and severe DRPs per patient and the mean change from baseline to the end of the study were computed for the ProFiL group and the UC group. The between-group difference (ProFiL-UC) in mean change and the 95% CI were estimated using a 2-level (pharmacy and individuals) multivariable linear mixed-effects model19-21 to take into account the clustering of data within the pharmacy and patient-level intracorrelation induced by repeated measures, all modeled as random effects. We also adjusted for covariables showing imbalance between the ProFiL and UC groups at baseline (patient: eGFR and highest level of education). Analyses were performed using SAS version 9.2 (SAS Institute, Cary, NC) and SPSS package 19 (SPSS, Chicago, IL).
Results
Baseline Patient Characteristics
Of the 1,732 patients invited to participate in the study, 442 were eligible and recruited; 304 were assigned to the ProFiL group and 138 to the UC group. Most excluded patients were not eligible because they did not meet the inclusion criteria (n = 684) or their pharmacy declined to participate (n = 408) (Figure 1).
FIGURE 1.
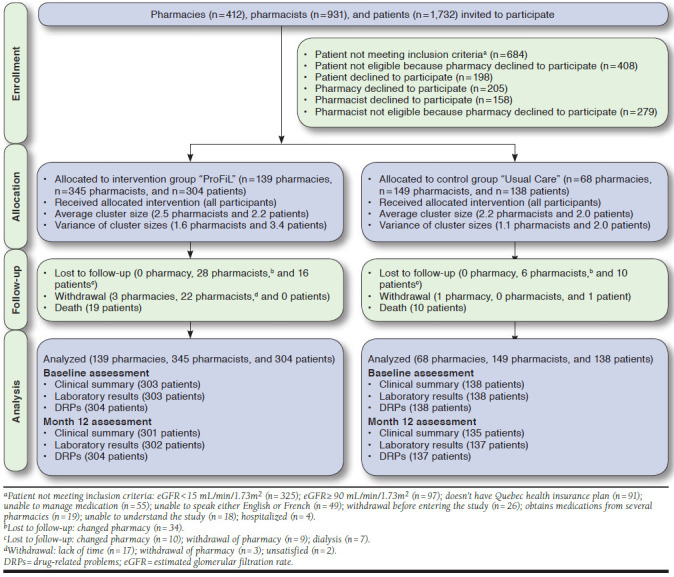
Flowchart of the ProFiL Study
On the basis of their last laboratory test results available on their medical charts in the CKD clinic, all patients were CKD stage 3 or 4 when recruited. However, at T0 participants were reclassified at stage 2 (0.05%; n = 2), stage 3 (30.9%; n = 137), stage 4 (64.9%; n = 287), or stage 5 (2.9%; n = 13; Table 1). All recruited patients were included in the final analyses.
TABLE 1.
Characteristics of Participants
| ProFiL Group | Usual Care Group | |
|---|---|---|
| Patient characteristics | ||
| Number | 304 | 138 |
| Age (years), mean (SD) | 71.9 (12.0) | 71.2 (12.5) |
| Men, n (%) | 179 (58.9) | 83 (60.1) |
| Race, n (%)a | ||
| Caucasians | 280 (92.1) | 118 (85.5) |
| Other | 18 (6.0) | 16 (11.6) |
| Highest level of education attained, n (%)a | ||
| Primary or secondary | 213 (71.5) | 74 (55.2) |
| College or university | 85 (28.5) | 60 (44.8) |
| Occupation, n (%)a | ||
| Employed | 48 (16.6) | 24 (18.6) |
| Retired | 226 (77.9) | 102 (79.1) |
| Other | 16 (5.5) | 3 (2.3) |
| Total family income before taxes, n (%)a | ||
| < $30,000/year | 133 (52.6) | 56 (53.3) |
| ≥ $30,000/year | 120 (47.4) | 49 (46.7) |
| Severity of chronic kidney disease, n (%)a | ||
| Stage 1 (eGFR ≥ 90 mL/min/1.73m2) | 0 (0.0) | 0 (0.0) |
| Stage 2 (eGFR 60-89 mL/min/1.73m2) | 1 (0.3) | 1 (0.7) |
| Stage 3 (eGFR 30-59 mL/min/1.73m2) | 89 (29.5) | 48 (35.0) |
| Stage 4 (eGFR 15-29 mL/min/1.73m2) | 202 (66.5) | 85 (61.6) |
| Stage 5 (eGFR < 15 mL/min/1.73m2) | 10 (3.3) | 3 (2.2) |
| Average renal function, mean (SD)b | ||
| eGFR (mL/min/1.73m2) | 26.8 (9.3) | 28.2 (10.7) |
| Creatinine (umol/L) | 213.3 (73.0) | 210.2 (73.4) |
| Body mass index (kg/m2), mean (SD)c | 30.4 (6.3) | 29.3 (6.7) |
| Comorbidities, n (%)d | ||
| Hypertensione | 283 (95.3) | 130 (94.9) |
| Dyslipidemiaf | 223 (75.1) | 100 (73.5) |
| Type I diabetesg | 11 (3.7) | 4 (3.0) |
| Type II diabetese | 160 (53.5) | 65 (48.1) |
| Coronary artery diseaseh | 130 (45.1) | 55 (41.4) |
| Comorbidities, n (%)d | ||
| Anemiai | 160 (54.8) | 77 (57.5) |
| Phosphocalcic imbalancej | 138 (48.1) | 60 (45.5) |
| Hyperkalemiak | 67 (23.0) | 38 (28.6) |
| Nonsmoker, n (%)l | 262 (89.4) | 120 (92.3) |
| On pill dispenser prepared by community pharmacists, n (%)m | 132 (45.1) | 56 (41.8) |
| Community pharmacy characteristics | ||
| Number | 139 | 68 |
| Pharmacist workload, n (%) | ||
| ≤ 30 prescriptions/hour/pharmacist | 94 (67.6) | 44 (64.7) |
| > 30 prescriptions/hour/pharmacist | 45 (32.4) | 24 (35.3) |
| Number of prescriptions dispensed per day, mean (SD) | 440.1 (235.8) | 457.9 (245.5) |
| Weekly opening hours for customer service, mean (SD)b | 80.2 (14.9) | 81.8 (16.5) |
| Pharmacy floor space (ft2), n (%)a | ||
| < 1,000 | 7 (5.7) | 3 (5.0) |
| 1,000-2,500 | 18 (14.8) | 9 (15.0) |
| 2,501-5,000 | 22 (18.0) | 11 (18.3) |
| > 5,000 | 75 (61.5) | 37 (61.7) |
| Pharmacist characteristics | ||
| Number | 345 | 149 |
| Sex, n (%) | ||
| Women | 236 (68.4) | 100 (67.1) |
| Men | 109 (31.6) | 49 (32.9) |
| Pharmacist status, n (%) | ||
| Owner pharmacist | 95 (27.5) | 39 (26.2) |
| Salaried pharmacist | 250 (72.5) | 110 (73.8) |
| Year of graduation, n (%)a | ||
| 2001 or later | 181 (53.6) | 77 (54.2) |
| 1991-2000 | 83 (24.6) | 36 (25.4) |
| 1981-1990 | 49 (14.5) | 18 (12.7) |
| 1980 or earlier | 25 (7.4) | 11 (7.7) |
Missing data: aNumbers may not add to total number in study group, b3, c37, dseveral categories may be reported, e8, f9, g12, h21, i16, j13, k18, l19, and m15.
eGFR = estimated glomerular filtration rate; SD = standard deviation.
Most patients were elderly (mean age was 71 years old) and predominantly Caucasian. Approximately 60% were men. More ProFiL patients had an eGFR ≥ 29 mL/min/1.73m2 (69.7% vs. 63.0%) and more UC patients reported college or university as their highest level of education (44.8% vs. 28.5%).
As for comorbidities, 95.3% of patients had hypertension, 75.1% had dyslipidemia, 53.5% had type II diabetes, and 54.8% had anemia. Almost 70% (67.6%) of participating pharmacies had a workload of ≤ 30 prescriptions/hour/pharmacist. Participating pharmacists were predominantly women, were salaried, and had graduated after the year 2000 (Table 1). No statistical analyses were performed on baseline characteristics of participants.
Prevalence of DRPs by Severity Level
As reported in Table 2, 897 DRPs were identified at baseline in 442 patients. Regardless of the study group, the mean numbers of DRPs per patient (SD) according to SCOPE severity level were level I: 0.39 (0.69); level II: 0.55 (0.98); and level III: 1.04 (1.51; data not shown).
TABLE 2.
Number of DRPs by Severity Level at Baseline Based on the SCOPE Criteria
| PAIR DRPs Category, n (%) | Category and Level of Severity Based on SCOPE Criteria (%)a | |||||||
|---|---|---|---|---|---|---|---|---|
| Mild | Moderate | |||||||
| Level I | Level II | Level III | Level IV | |||||
| Totalb | 176 | (19.6) | 251 | (28.0) | 469 | (52.3) | 1 | (0.1) |
| Drugs not recommended in CKDc | ||||||||
| Acarbose | 0 | (0.0) | 2 | (0.8) | 0 | (0.0) | 0 | (0.0) |
| NSAIDs | 11 | (6.3) | 18 | (7.2) | 18 | (3.8) | 1 | (100.0) |
| Biphosphonates | 0 | (0.0) | 22 | (8.8) | 1 | (0.2) | 0 | (0.0) |
| Metformin | 0 | (0.0) | 17 | (6.8) | 1 | (0.2) | 0 | (0.0) |
| Nitrofurantoin | 0 | (0.0) | 8 | (3.2) | 0 | (0.0) | 0 | (0.0) |
| Subtotal | 11 | (6.3) | 67 | (26.7) | 20 | (4.3) | 1 | (100.0) |
| Drugs requiring a dose adjustment in CKDc | ||||||||
| Anti-infectives | 2 | (1.1) | 43 | (17.1) | 0 | (0.0) | 0 | (0.0) |
| Allopurinol | 0 | (0.0) | 11 | (4.4) | 0 | (0.0) | 0 | (0.0) |
| Beta blockers | 0 | (0.0) | 7 | (2.8) | 1 | (0.2) | 0 | (0.0) |
| Others | 4 | (2.3) | 26 | (10.4) | 0 | (0.0) | 0 | (0.0) |
| Subtotal | 6 | (3.4) | 87 | (34.7) | 1 | (0.2) | 0 | (0.0) |
| Nonadherence to drug therapyc | ||||||||
| Antihypertensives | 0 | (0.0) | 0 | (0.0) | 75 | (16.0) | 0 | (0.0) |
| Antidiabetics | 0 | (0.0) | 0 | (0.0) | 54 | (11.5) | 0 | (0.0) |
| Hypolipemiants | 0 | (0.0) | 2 | (0.8) | 30 | (6.4) | 0 | (0.0) |
| Anemia | 0 | (0.0) | 1 | (0.4) | 41 | (8.7) | 0 | (0.0) |
| Phosphocalcic imbalance | 0 | (0.0) | 1 | (0.4) | 71 | (15.1) | 0 | (0.0) |
| Subtotal | 0 | (0) | 4 | (1.6) | 271 | (57.8) | 0 | (0.0) |
| Uncontrolled blood pressurec | 2 | (1.1) | 0 | (0.0) | 114 | (24.3) | 0 | (0.0) |
| Hypoglycemia secondary to sulfonylureasc | 0 | (0.0) | 0 | (0.0) | 25 | (5.3) | 0 | (0.0) |
| Drug interactions and/or drug used inappropriatelyc | 20 | (11.4) | 58 | (23.1) | 13 | (2.8) | 0 | (0.0) |
| Smokingc | 38 | (21.6) | 0 | (0.0) | 2 | (0.4) | 0 | (0.0) |
| OTC medications and natural health products not recommended in CKDc | ||||||||
| Antacids | 36 | (20.5) | 10 | (4.0) | 2 | (0.4) | 0 | (0.0) |
| Purgatives | 3 | (1.7) | 3 | (1.2) | 0 | (0) | 0 | (0.0) |
| Vitamin A | 12 | (6.8) | 6 | (2.4) | 0 | (0) | 0 | (0.0) |
| NSAIDs | 19 | (10.8) | 4 | (1.6) | 12 | (2.6) | 0 | (0.0) |
| Pseudoephedrine/phenylephrine | 16 | (9.1) | 2 | (0.8) | 7 | (1.5) | 0 | (0.0) |
| Vitamin C | 8 | (4.5) | 7 | (2.8) | 2 | (0.4) | 0 | (0.0) |
| Other natural health products | 5 | (2.8) | 1 | (0.4) | 0 | (0) | 0 | (0.0) |
| Subtotal | 99 | (56.3) | 33 | (13.1) | 23 | (4.9) | 0 | (0.0) |
aNo DRPs were considered severe (levels V or VI) according to the SCOPE criteria.
bPercentages are calculated on a total number (n) of 897 DRPs identified at baseline in 442 patients.
cPercentages are calculated on the total number (n) of DRPs identified at baseline in each severity level.
CKD = chronic kidney disease; DRPs=drug-related problems; NSAIDs = nonsteroidal anti-inflammatory drugs; OTC = over the counter; PAIR = Pharmacotherapy Assessment in Chronic Renal Disease; SCOPE = Severity Categorization for Pharmaceutical Evaluation.
A total of 176 DRPs were classified as level I. Among these, 99 (56.3%) were associated with OTC medications not recommended for CKD, such as antacids (20.5%). Two hundred fifty-one DRPs were classified as level II. They were mostly associated with the use of drugs not recommended for CKD (67 [26.7%]), like biphosphonates (8.8%), or drugs requiring a dosage adjustment for CKD (87 [34.7%]), mainly anti-infectives (43 [17.1%]).
The majority of all DRPs observed (469) were classified as level III. They were mainly related to nonadherence to drug therapy (271 [57.8%]), particularly antihypertensives (75 [16%]) and uncontrolled blood pressure (114 [24.3%]). Only 1 DRP was deemed level IV, and no DRPs deemed level V or VI were found.
Effect of ProFiL Program on DRP Prevalence by Severity Level
At baseline, the overall mean numbers of DRPs per patient were 2.16 (SD = 2.10) and 1.70 (2.02) in the ProFiL and UC groups, respectively (Table 3). After 12 months (T12), they were 1.60 (1.79) and 1.62 (1.79), respectively. The adjusted incremental change in the ProFiL group was equal to -0.32 DRPs/patient (95% CI = (-0.60 to -0.06), after adjusting for the number of DRPs at baseline, the interaction between the study group, and the number of DRPs at baseline and other potential confounders. When stratified by severity level, the unadjusted between-group difference was statistically significant only for a DRP severity of level III: -0.34 (95% CI = -0.66 to -0.01). After being adjusted for potential confounders, the results were not statistically significant (0.31, 95% CI = -0.63, 0.02). These results seemed mostly driven by a reduction in the number of new DRPs at level III in the ProFiL group after 12 months (Figure 2).
TABLE 3.
Incremental Changes in the Mean Numbers of DRPs in ProFiL Patients by SCOPE Level of Severity
| SCOPE Category and Level | T0 Mean (SD) | T12 Mean (SD) | Incremental Change in ProFiL Group Compared with UC Group Mean (95% CI) | ||||
|---|---|---|---|---|---|---|---|
| ProFiL n = 304 | UC n = 138 | ProFiL n = 304 | UC n = 138 | Unadjusted | Adjusted | ||
| Mild | I | 0.42 (0.73) | 0.31 (0.59) | 0.37 (0.89) | 0.31 (0.76) | -0.05 (-0.21, 0.12) | -0.03 (-0.21, 0.14)a |
| II | 0.58 (0.98) | 0.47 (0.96) | 0.52 (1.23) | 0.51 (1.29) | -0.11 (-0.36, 0.15) | -0.10 (-0.38, 0.17)b | |
| Subtotal | 1.00 (1.19) | 0.78 (1.26) | 0.88 (1.54) | 0.81 (1.54) | -0.16 (-0.44, 0.13) | -0.12 (-0.43, 0.18)c | |
| Moderate | III | 1.09 (1.56) | 0.95 (1.39) | 1.05 (1.84) | 1.24 (2.31) | -0.34 (-0.66, -0.01) | -0.31 (-0.63, 0.02)d |
| IV | 0.00 (0.06) | 0.00 (0.00) | 0.04 (0.34) | 0.04 (0.19) | 0.00 (-0.06, 0.06) | 0.01 (-0.06, 0.07)e | |
| Subtotal | 1.09 (1.56) | 0.95 (1.39) | 1.08 (1.86) | 1.24 (2.32) | -0.33 (-0.65, -0.01) | -0.29 (-0.61, 0.03)f | |
| Total | 2.16 (2.10) | 1.70 (2.02) | 1.60 (1.79) | 1.62 (1.79) | -0.48 (-0.82, -0.14) | -0.32 (-0.60, -0.06)g | |
Note: No DRPs were considered to be level V or VI (severe).
aAdjusted for the interaction between study group and number of DRPs level I at baseline, eGFR, and level of education.
bAdjusted for the interaction between study group and number of DRPs level II at baseline, eGFR, and level of education.
cAdjusted for the interaction between study group and number of DRPs level I and II at baseline, eGFR, and level of education.
dAdjusted for the interaction between study group and number of DRPs level III, eGFR, and level of education.
eAdjusted for the interaction between study group and number of DRPs level IV, eGFR, and level of education.
fAdjusted for the interaction between study group and number of DRPs level III and IV at baseline, eGFR, and level of education.
gAdjusted for the number of DRPs at baseline, the interaction between study group and number of DRPs at baseline, and for patient’s age, sex, highest level of education, and eGFR, as well as for pharmacists’ being an associate clinician and receiving remuneration for pharmaceutical opinions.
CI = confidence interval; DRPs = drug-related problems; eGFR = estimated glomerular filtration rate; SCOPE = Severity Categorization for Pharmaceutical Evaluation; SD = standard deviation; T0 = baseline; T12 = after 12 months; UC = usual care.
FIGURE 2.
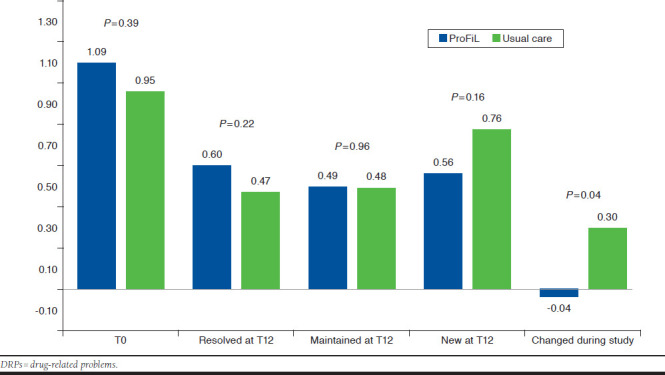
Mean Number of DRPs (Level III) at Baseline (T0) and Mean Number of DRPs Resolved, Maintained, and Newly Identified at 1 Year (T12) in the ProFiL and the Usual Care Groups
Discussion
The prevalence of DRPs in CKD patients followed by a multi-disciplinary team of health care professionals in CKD clinics was high, with an average of approximately 2 DRPs per patient. The results of this study underscore the clinical significance of this finding, showing that approximately half of these problems had a moderate severity and required specific monitoring by community pharmacists. In this subanalysis, within each severity level, the ProFiL program was not associated with a statistically significant reduction in the number of DRPs.
The essential role of pharmacists in managing drug therapy in CKD patients (including adjusting medication dosage, monitoring laboratory test values, and educating patients) has been documented in 2 systematic reviews.22,23 Their interventions reduced the rate of hospitalizations and the relative risk of end-stage renal disease.24 Phosphate and anemia management also improved.25,26 If the same were to apply to community pharmacists, the potential for optimizing medication use would be substantial and, as suggested by our study, potentially achievable. However, the involvement of community pharmacists in managing CKD patients followed-up in predialysis and outpatient dialysis centers is still limited.22
The overall results of the ProFiL study (Lalonde et al., 2017) have shown that with appropriate training and access to essential clinical data, the contribution of community pharmacists is significant and beneficial.13 In this subanalysis, we observed that moderate DRPs (requiring monitoring) were less frequent in the ProFiL group after 12 months. The significant nonadjusted effect of ProFiL over these DRPs was attenuated by 10% when adjusted and lost statistical significance, probably due to an insufficient statistical power. Therefore, the positive effect of ProFiL to reduce moderate DRPs remains unclear.
Based on the SCOPE criteria, nonadherence and uncontrolled blood pressure were deemed moderate DRPs, and their management requires community pharmacists to implement a specific monitoring plan. Similarly, in a study by Manley et al. (2005), 24% of DRPs required laboratory tests for appropriate monitoring.5 It is important to consider that in our study, DRPs were identified based on the information available to community pharmacists, which excluded laboratory test results (except the eGFR).
However, shortly after the end of the study, most community pharmacists obtained access to laboratory tests. In Quebec, community pharmacists have recently been given such access through the Dossier Santé Québec.27 Furthermore, under Bill 41, they can order laboratory tests for monitoring purposes.28 It is therefore expected that, outside this study, community pharmacists will be able to detect and manage more DRPs by implementing vigilant laboratory monitoring.
Nonadherence was the most prevalent moderate DRP. It represents a major problem in health care and a barrier to achieving optimal CKD outcomes.29-33 Nonadherence leads to a worsening condition, death, and increased costs,30,34 particularly for elderly patients.35,36 It is associated with uncontrolled hypertension and higher rates of mortality in hemodialysis patients.37,38
Several studies on nonadherence have highlighted that patients are concerned about polypharmacy and adverse events, and they do not discuss their medication beliefs and treatment priorities with physicians.8,39 Other barriers include forgetfulness, lack of information or involvement in decision making, cost, complex regimens, and poor communication.8 Community pharmacists are well positioned to address these barriers by implementing multifactorial strategies, including patient education and enhanced decision making. Optimal management of adherence requires frequent interactions between pharmacists and patients to reinforce interventions.40 In Quebec, medications are usually dispensed every 30 days,41 and patients tend to go to only 1 pharmacy.4 Again, the potential for community pharmacists to detect and improve adherence to medication is very important.
Evaluating DRP severity was useful to determine which DRPs require a more intense management by community pharmacists. This information might also be eventually helpful to develop remuneration models.42 Pharmacists in some Canadian provinces, the United States, and Australia are now remunerated for medication reviews.8,43,44 A recent systematic review of pharmacist-provided fee-for-service interventions found significant improvements in the achievement of blood pressure and low-density lipoprotein cholesterol goals; moreover, 58% of these studies demonstrated improved medication adherence.45 Many of these studies targeted patients with hypertension, diabetes, or both and included a smoking cessation component. The ProFiL program included some of these elements, and our results suggest it may improve the prevention and management of moderate DRPs. But the efficacy of the ProFiL program in real life still needs to be demonstrated.
Limitations
To our knowledge, this is the first study to evaluate the prevalence of DRPs by severity level in the context of community pharmacies. It was carried out as part of a randomized trial involving CKD patients, and we used 2 validated sets of criteria to identify DRPs and assess their severity, which enhances the study’s internal validity.
However, there are also some limitations to this study. First, the identification and severity assessment of DRPs was performed by trained pharmacists using information collected for a clinical trial, which might differ from a direct evaluation performed by community pharmacists when they meet with patients. Second, our analysis was performed as a secondary objective of the ProFiL study, so its statistical power was insufficient to determine the effect of the ProFiL program on DRPs, when stratified by severity. Finally, even though the observed DRPs are generally present in all CKD patients, these results might be applicable only to those patients regularly seeing a community pharmacist and followed in CKD clinics.
Conclusions
The prevalence of DRPs is high among CKD patients under the care of a multidisciplinary team, particularly for moderate DRPs requiring pharmacist monitoring. Continuing education programs, such as ProFiL, have the potential to improve medication use in this population by reducing the prevalence of DRPs. But a particular effect of ProFiL on DRPs when stratified by severity remains to be determined.
REFERENCES
- 1.Laliberté M-C, Normandeau M, Lord A, et al. Use of over-the-counter medications and natural products in patients with moderate and severe chronic renal insufficiency. Am J Kidney Dis. 2007;49(2):245-56. [DOI] [PubMed] [Google Scholar]
- 2.Johnson CA, Levey AS, Coresh J, Levin A, Lau J, Eknoyan G. Clinical practice guidelines for chronic kidney disease in adults: part I. Definition, disease stages, evaluation, treatment, and risk factors. Am Fam Physician. 2004;70(5):869-76. [PubMed] [Google Scholar]
- 3.Levey AS, Eckardt KU, Tsukamoto Y, et al. Definition and classification of chronic kidney disease: a position statement from Kidney Disease: Improving Global Outcomes (KDIGO). Kidney Int. 2005;67(6):2089-100. [DOI] [PubMed] [Google Scholar]
- 4.Lalonde L, Normandeau M, Lamarre D, et al. Evaluation of a training and communication-network nephrology program for community pharmacists. Pharm World Sci. 2008;30(6):924-33. [DOI] [PubMed] [Google Scholar]
- 5.Manley HJ, Cannella CA, Bailie GR, St Peter WL. Medication-related problems in ambulatory hemodialysis patients: a pooled analysis. Am J Kidney Dis. 2005;46(4):669-80. [DOI] [PubMed] [Google Scholar]
- 6.Sarnak MJ, Levey AS, Schoolwerth AC, et al. Kidney disease as a risk factor for development of cardiovascular disease: a statement from the American Heart Association Councils on Kidney in Cardiovascular Disease, High Blood Pressure Research, Clinical Cardiology, and Epidemiology and Prevention. Hypertension. 2003;42(5):1050-65. [DOI] [PubMed] [Google Scholar]
- 7.Breton G, Froissart M, Janus N, et al. Inappropriate drug use and mortality in community-dwelling elderly with impaired kidney function—the Three-City population-based study. Nephrol Dial Transplant. 2011;26(9):2852-59. [DOI] [PMC free article] [PubMed] [Google Scholar]
- 8.St Peter WL, Wazny LD, Patel UD. New models of chronic kidney disease care including pharmacists: improving medication reconciliation and medication management. Curr Opin Nephrol Hypertens. 2013;22(6):656-62. [DOI] [PMC free article] [PubMed] [Google Scholar]
- 9.Schmid H, Hartmann B, Schiffl H. Adherence to prescribed oral medication in adult patients undergoing chronic hemodialysis: a critical review of the literature. Eur J Med Res. 2009;14(5):185-90. [DOI] [PMC free article] [PubMed] [Google Scholar]
- 10.Kinky DE, Erush SC, Laskin MS, Gibson GA. Economic impact of a drug information service. Ann Pharmacother. 1999;33(1):11-16. [DOI] [PubMed] [Google Scholar]
- 11.Ling JM, Mike LA, Rubin J, et al. Documentation of pharmacist interventions in the emergency department. Am J Health Syst Pharm. 2005;62(17):1793-97. [DOI] [PubMed] [Google Scholar]
- 12.Salgado TM, Correr CJ, Moles R, Benrimoj SI, Fernandez-Llimos F. Assessing the implementability of clinical pharmacist interventions in patients with chronic kidney disease: an analysis of systematic reviews. Ann Pharmacother. 2013;47(11):1498-506. [DOI] [PubMed] [Google Scholar]
- 13.Lalonde L, Quintana-Barcena P, Lord A, et al. Community pharmacist training-and-communication network and drug-related problems in patients with CKD: a multicenter, cluster-randomized, controlled trial. Am J Kidney Dis. 2017;70(3):386-96. [DOI] [PubMed] [Google Scholar]
- 14.Desrochers JF, Lemieux JP, Morin-Bélanger C, et al. Development and validation of the PAIR (Pharmacotherapy Assessment in Chronic Renal Disease) criteria to assess medication safety and use issues in patients with CKD. Am J Kidney Dis. 2011;58(4):527-35. [DOI] [PubMed] [Google Scholar]
- 15.National Kidney Foundation. K/DOQI clinical practice guidelines for bone metabolism and disease in chronic kidney disease . Am J Kidney Dis. 2003;42(4 Suppl 3):S1-201. [PubMed] [Google Scholar]
- 16.Guay M, Ricard S, Letendre S, et al. Connaissances et compétences des pharmaciens communautaires et qualité de la pharmacothérapie des patients atteints d’insuffisance rénale chronique: résultats provisoires du programme ProFiL. Pharmactuel. 2013;46(4):247-57. [Google Scholar]
- 17.Quintana-Barcena P, Lord A, Lizotte A, Berbiche D, Jouini G, Lalonde L. Development and validation of criteria for classifying severity of drug-related problems in chronic kidney disease: a community pharmacy perspective. Am J Health Syst Pharm. 2015;72(21):1876-84. [DOI] [PubMed] [Google Scholar]
- 18.Ordre des pharmaciens du Québec. Entente relative à l'Assurance Maladie entre l'Association Québécoise des Pharmaciens Propriétaires et le Ministre de la Santé et des Services Sociaux . 2016. Available at: http://www.ramq.gouv.qc.ca/SiteCollectionDocuments/professionnels/manuels/260-pharmaciens/008_entente_pharm.pdf. Accessed January 13, 2018.
- 19.McGilchrist CA. Estimation in generalized mixed models. J R Stat Soc Series B Stat Methodol. 1994;56(1):61-69. [Google Scholar]
- 20.Sullivan LM, Dukes KA, Losina E. Tutorial in biostatistics. An introduction to hierarchical linear modelling. Stat Med. 1999;18(7):855-88. [DOI] [PubMed] [Google Scholar]
- 21.Heo M, Xue X, Kim MY. Sample size requirements to detect an intervention by time interaction in longitudinal cluster randomized clinical trials with random slopes. Comput Stat Data Anal. 2013;60:169-78. [DOI] [PMC free article] [PubMed] [Google Scholar]
- 22.Salgado TM, Moles R, Benrimoj SI, Fernandez-Llimos F. Pharmacists' interventions in the management of patients with chronic kidney disease: a systematic review. Nephrol Dial Transplant. 2012;27(1):276-92. [DOI] [PubMed] [Google Scholar]
- 23.Stemer G, Lemmens-Gruber R. Clinical pharmacy activities in chronic kidney disease and end-stage renal disease patients: a systematic literature review. BMC Nephrol. 2011;12:35. [DOI] [PMC free article] [PubMed] [Google Scholar]
- 24.Pai AB, Boyd A, Depczynski J, Chavez IM, Khan N, Manley H. Reduced drug use and hospitalization rates in patients undergoing hemodialysis who received pharmaceutical care: a 2-year, randomized, controlled study. Pharmacotherapy. 2009;29(12):1433-40. [DOI] [PubMed] [Google Scholar]
- 25.Yokum D, Glass G, Cheung CF, Cunningham J, Fan S, Madden AM. Evaluation of a phosphate management protocol to achieve optimum serum phosphate levels in hemodialysis patients. J Ren Nutr. 2008;18(6):521-29. [DOI] [PubMed] [Google Scholar]
- 26.Bucaloiu ID, Akers G, Bermudez MC, et al. Outpatient erythropoietin administered through a protocol-driven, pharmacist-managed program may produce significant patient and economic benefits. Manag Care Interface. 2007;20(6):26-30. [PubMed] [Google Scholar]
- 27.Gouvernement du Québec. Dossier Santé Québec . 2013. Available at: http://www.dossierdesante.gouv.qc.ca/index.php. Accessed January 13, 2018.
- 28.Éditeur officielle du Québec. Loi modifiant la Loi sur la pharmacie. Lois et Reglements . Gazette officielle du Quebec, 23 janvier 2013, 145e annee, no. 4. Quebec, Canada: Gouvernement du Quebec; 2013. [Google Scholar]
- 29.Osterberg L, Blaschke T. Adherence to medication. N Engl J Med. 2005;353(5):487-97. [DOI] [PubMed] [Google Scholar]
- 30.Haynes RB, Ackloo E, Sahota N, McDonald HP, Yao X. Interventions for enhancing medication adherence. Cochrane Database Syst Rev. 2008;(2):CD000011. [DOI] [PubMed] [Google Scholar]
- 31.Chang TI, Desai M, Solomon DH, Winkelmayer WC. Kidney function and long-term medication adherence after myocardial infarction in the elderly. Clin J Am Soc Nephrol. 2011;6(4):864-69. [DOI] [PMC free article] [PubMed] [Google Scholar]
- 32.Raymond CB, Wazny LD, Sood AR. Medication adherence in patients with chronic kidney disease. CANNT J. 2011;21(2):47-50; quiz 51-52. [PubMed] [Google Scholar]
- 33.Chiu YW, Teitelbaum I, Misra M, de Leon EM, Adzize T, Mehrotra R. Pill burden, adherence, hyperphosphatemia, and quality of life in maintenance dialysis patients. Clin J Am Soc Nephrol. 2009;4(6):1089-96. [DOI] [PMC free article] [PubMed] [Google Scholar]
- 34.Lynch T. Medication costs as a primary cause of nonadherence in the elderly. Consult Pharm. 2006;21(2):143-46. [DOI] [PubMed] [Google Scholar]
- 35.Corsonello A, Pedone C, Lattanzio F, et al. Regimen complexity and medication nonadherence in elderly patients. Ther Clin Risk Manag. 2009;5(1):209-16. [DOI] [PMC free article] [PubMed] [Google Scholar]
- 36.Muszbek N, Brixner D, Benedict A, Keskinaslan A, Khan ZM. The economic consequences of noncompliance in cardiovascular disease and related conditions: a literature review. Int J Clin Pract. 2008;62(2):338-51. [DOI] [PMC free article] [PubMed] [Google Scholar]
- 37.Muntner P, Judd SE, Krousel-Wood M, McClellan WM, Safford MM. Low medication adherence and hypertension control among adults with CKD: data from the REGARDS (Reasons for Geographic and Racial Differences in Stroke) study. Am J Kidney Dis. 2010;56(3):447-57. [DOI] [PMC free article] [PubMed] [Google Scholar]
- 38.Rosenthal Asher D, Ver Halen N, Cukor D. Depression and nonadherence predict mortality in hemodialysis treated end-stage renal disease patients. Hemodial Int. 2012;16(3):387-93. [DOI] [PMC free article] [PubMed] [Google Scholar]
- 39.Rifkin DE, Laws MB, Rao M, Balakrishnan VS, Sarnak MJ, Wilson IB. Medication adherence behavior and priorities among older adults with CKD: a semistructured interview study. Am J Kidney Dis. 2010;56(3):439-46. [DOI] [PMC free article] [PubMed] [Google Scholar]
- 40.Rodgers RM, Gammie SM, Loo RL, Corlett SA, Krska J. Comparison of pharmacist and public views and experiences of community pharmacy medicines-related services in England. Patient Prefer Adherence. 2016;10:1749-58. [DOI] [PMC free article] [PubMed] [Google Scholar]
- 41.Ordre des pharmaciens du Québec. Prise de position de l’Ordre des pharmaciens du Québec sur les quantités de médicaments délivrés par les pharmaciens . 2003. Available at: http://www.opq.org/doc/media/756_38_fr-ca_0_enonce_position_rappel_med_delivres.pdf. Accessed January 13, 2018.
- 42.The Pharmacy Guild of Australia. Documenting clinical interventions in community pharmacy: PROMISe III. Final report . 2009. Available at: http://6cpa.com.au/wp-content/uploads/Documenting-Clinical-Interventions-in-Community-Pharmacy-PROMISe-III-Final-Report-.pdf. Accessed January 13, 2018.
- 43.Canadian Foundation for Pharmacy. Fees and claims data for government-sponsored pharmacist services, by province . Updated January 2017. Available at: https://www.cfpnet.ca/bank/document_en/104-2016-provincial-chart.pdf. Accessed January 13, 2018.
- 44.Williams M, Peterson GM, Tenni PC, et al. Drug-related problems detected in Australian community pharmacies: the PROMISe trial. Ann Pharmacother. 2011;45(9):1067-76. [DOI] [PubMed] [Google Scholar]
- 45.Hatah E, Braund R, Tordoff J, Duffull SB. A systematic review and meta-analysis of pharmacist-led fee-for-services medication review. Br J Clin Pharmacol. 2014;77(1):102-15. [DOI] [PMC free article] [PubMed] [Google Scholar]