

Abstract
BACKGROUND:
Medication nonadherence is an imperative public health concern. Among patients with type 2 diabetes mellitus (T2DM), poor adherence to antidiabetic agents is strongly associated with suboptimal glycemic control. Poor adherence and hyperglycemia greatly increase diabetes-related morbidity and mortality. At a national level, diabetes drug adherence using average proportion of days covered (PDC) is estimated to range between 36% and 81%, with an estimated range for diabetes control between 38% and 47%. At a state level no such studies exist.
OBJECTIVE:
To estimate the level of medication adherence to antidiabetic agents and of diabetes control, and their association among patients with T2DM receiving medication treatment at the state and the Metropolitan Statistical Area (MSA) levels among the populations covered by commercial insurance, Medicare, or Medicaid.
METHODS:
The study population included adults with T2DM aged ≥ 18 years who were identified using ICD-9-CM code 250.xx, who received diabetes medication, and who were covered by private insurance, Medicare, or Medicaid in each state, the District of Columbia, and the top 50 MSAs. Medication adherence was measured by average PDC and the percentage of population that had a PDC ≥ 80%. Diabetes control was identified using ICD-9-CM diagnosis codes. Patients who were not diagnosed with uncontrolled diabetes (250.x2 and 250.x3) were identified as being under control. The administrative claims databases used for this study included the 2012 medical and pharmacy claims from a large U.S. health plan, the complete 2011 Medicare Standard Analytical File linked with Part D claims, and the 2008 Mini-Medicaid Analytic eXtract (Mini-Max). Medication adherence and diabetes control were adjusted for age and sex to allow comparison across insurance coverage, states, and MSAs.
RESULTS:
For an insured patient population with T2DM that received diabetic drug treatment, average PDC was 79%. However, 35% of patients did not achieve an adherence of at least 80% of PDC. In addition, at least 40% of patients did not have their diabetes under control. Across insurance types, we found that patients insured with Medicare had relatively high average PDC and adherence levels (83% and 71%) in comparison with the commercially insured population (77% and 60%) and Medicaid patients (75% and 57%). In contrast, commercially insured patients had relatively better diabetes control (69%) than those insured with Medicare and Medicaid (54% and 53%, respectively). At a state level, we found that commercially insured and Medicare populations have relatively smaller geographic variation in drug adherence than the Medicaid population.
CONCLUSIONS:
This study identified gaps in T2DM drug adherence and pinpointed geographic areas that lag in terms of diabetes drug adherence or diabetes control and would benefit from implementing strategies to increase drug adherence.
What is already known about this subject
Diabetes drug adherence is strongly related to diabetes control and health outcomes.
There is a need to improve drug adherence and glycemic control.
What this study adds
This study identifies gaps in drug adherence and diabetes control across insurance types, states, and Metropolitan Statistical Areas (MSAs).
Adherence to oral and injectable antidiabetic medications varied significantly across states and MSAs, as well as insurance types. The Medicare population had the highest adherence, while the commercial population had the highest level of diabetes control, partially because of younger age and shorter disease duration.
States in the Northeast and Midwest regions were identified as doing better than the national averages in drug adherence and diabetes control, while southern states were found to have larger gaps in these care measures.
Medication nonadherence, particularly among patients with type 2 diabetes mellitus (T2DM), is a vital public health concern. Nonadherence is associated with morbidity and mortality and results in higher health care use and expenditures.1 In 2012, 29.1 million adults in the United States had diabetes, 90% of whom suffered from T2DM.2 Among patients with T2DM, poor adherence to antidiabetic agents is strongly associated with suboptimal glycemic control and greatly increases the incidence of diabetes-related morbidity and mortality and costs.3-5 Therefore, while the American Diabetes Association recommends individualized treatment targets, it does advise that for many nonpregnant adults, lowering hemoglobin A1c (A1c) to below 7% is a reasonable goal.6
Existing research has highlighted gaps in medication adherence and diabetes control at the national level. A systematic review found that drug adherence among patients with T2DM in 4 nationally representative studies ranged between 36% and 81%.7,8 Drug adherence, measured as the proportion of days covered (PDC), was 79% and 81% in 2 studies representative of pharmacy benefit organizations (PBO).7 The third study, using a large pharmacy claims database, used medication possession ratio as a proxy for drug adherence. This study excluded patients with T2DM who used insulin and found 69% of patients to be adherent.8 The fourth study, using a Medicaid population, concluded that drug adherence measured using PDC ranged between 36% and 49%.7 Diabetes control, defined by A1c below 7%, has been estimated to be 53% for commercially insured patients and 62% for Medicare patients.5 To our knowledge, diabetes control for Medicaid patients is not currently available.
Other studies have documented the wide geographic variations in general access to care, health care use, and expenditures across the United States.9 For example, per capita diabetes-related medical expenditures in Massachusetts are 1.4 times the expenditures in Utah.10 Regional differences in health care use, expenditures, and drug adherence are partially explained by population demographics, which include age, sex, and socioeconomic characteristics. Other important determinants of population health care use are local, such as supply of care, financial incentives, practice patterns, and behavioral determinants of health. Furthermore, the degree of illness, out-of-pocket drug costs, polypharmacy, complexity in drug regimen, and patients’ perceptions toward their illness and drug effectiveness are also known to affect adherence.11,12
Little is known about the level of adherence to antidiabetic agents and its potential geographic variation at the state or Metropolitan Statistical Area (MSA) level. One previous study has found that adherence to oral antidiabetic medications varied significantly across 9 regions in the United States, after controlling for age, gender, socioeconomic status, and yearly out-of-pocket pharmacy expenses.13 This study concluded that diabetic drug adherence, captured by average PDC, among commercially insured patients was highest in the New England, Mid-Atlantic, East North Central, and West North Central states, which had 40% to 60% higher probability of being adherent to their medications than East South Central states. In this study, East North Central states included Wisconsin, Illinois, Indiana, Ohio, and Michigan. West North Central states included North and South Dakota, Nebraska, Kansas, Minnesota, Iowa, and Minnesota. East South Central states included Kentucky, Tennessee, Alabama, and Mississippi. In contrast, among the Medicare population with Part D benefits, New England and East North Central states were 8% to 19% more adherent than East South Central states.
Our purpose in this claims-based retrospective crosssectional study was to examine the average PDC to antidiabetic agents, the percentage of optimal adherence, and the percentage of patients with controlled diabetes among patients diagnosed with T2DM who received antidiabetic medication. The results are presented at the state and MSA level for commercially insured, Medicare, and Medicaid patients separately.
Methods
Data Sources
Data sources included the 2012 medical and pharmacy claims from UnitedHealth Group and non-UnitedHealth Group health plans (the deidentified Normative Health Information [dNHI] database), the 2011 Medicare Standard Analytical File medical claims linked with Part D claims from the 5% Chronic Conditions Data Warehouse files, and the 2008 Mini-Medicaid Analytic eXtract (Mini-Max), which is a one-time extraction of a 5% stratified random sample of the Medicaid population. These 3 databases were statistically deidentified. This study was reviewed and approved by an institutional review board and the Centers for Medicare & Medicaid Services (CMS) Privacy Review Board.
Study Population
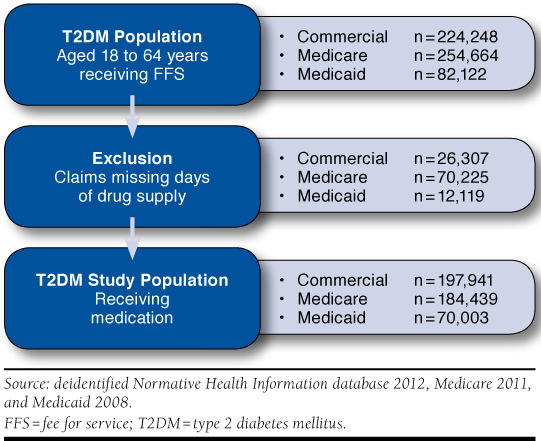
The study population included adults with T2DM who received diabetes medication and were covered by private insurance (aged 18 to 64 years), Medicare (aged 18 years and above), or Medicaid (aged 18 to 64 years) in each state, the District of Columbia, and the top 50 MSAs. For Medicare and Medicaid, only fee-for-service insured were included. The Medicare sample was limited to fee-for-service Part D enrollees and did not include Medicare Advantage Plans with Part D coverage. Adults with T2DM who filled an antidiabetic prescription any time during the year of data availability were included in the study. Patients were also required to be continuously covered during the entire calendar year. Patients with diagnosed diabetes were identified by 1 or more hospital stays or emergency department visits or at least 2 separate physician office or hospital outpatient visits during which diabetes (International Classification of Diseases, Ninth Revision, Clinical Modification [ICD-9-CM] code 250.xx) was recorded. T2DM patients were then identified using an algorithm described in Appendix A (available in online article). Using these criteria, we identified 561,034 individuals with T2DM across the 3 insurance categories (Figure 1). Excluded from this study were claims where number of days supplied were missing or zero or prescription fill dates were missing. The number of T2DM patients identified who received diabetes medication was 197,941 for commercially insured, 184,439 for Medicare, and 70,003 for Medicaid (Figure 1).
Figure 1.
State Average PDC in Comparison to Average PDC Across States by Insurance Type and Overall
Study Measures
Drug adherence was measured using PDC, calculated as the proportion of days with 1 or more drugs available during the study period. This period was defined as the time interval between the index date (the first script fill date during the study year) and the last day of the calendar year. We used an interval-based method to calculate a PDC for each patient using pharmacy claims.14 Upon calculating a PDC for each person, patients with a PDC ≥ 80% were classified as being adherent to their medications.15 We reported average PDC and adherence rates.
Antidiabetic agents covered by the PDC calculations included oral antidiabetic drugs (OAD), including alpha-glucosidase inhibitors, meglitinides, biguanides, sulfonylureas, thiazolidinediones, and dipeptidyl peptidase-4 inhibitors, and anti-diabetic combinations, insulin mixes, long-acting insulins, and noninsulin injectable drugs (GLP-1 receptor agonists). Rapid-acting insulin was excluded because of the uncertainty of the real days of supply. Days of supply for insulin and noninsulin injectable drugs were adjusted because of titration using existing method.16,17 Drug lists were constructed using Healthcare Effectiveness Data and Information Set-approved diabetes drugs by 2011 (the National Drug Code list available upon request).
Since our purpose was to examine general medication adherence to antidiabetic therapy, all drugs within antidiabetic agent drug classes were considered interchangeable. Days during which concurrent drugs were supplied were only counted once. We adjusted fill dates and excluded inpatient days for PDC calculations following CMS Technical Notes.18
The optimal way to measure diabetes control is through A1c values. While laboratory results are available for a subset of the commercially insured T2DM patients, Medicare and Medicaid files do not contain laboratory results. In order to create a consistent definition of diabetes control across insurance types, we identified patients with controlled diabetes as those who were not diagnosed with uncontrolled diabetes (ICD-9-CM code 250.x2 or 250.x3) during the study year. For the subset of commercially insured T2DM patients for which we had both ICD9-CM and A1c information, we performed additional correlation analyses to assert the strength of the association between the 2 measures of diabetes control. We found a strongly significant and positive correlation between ICD-9-CM- and A1cbased case identification measures (Spearman rank correlation coefficients of 0.22 [ P < 0.001] for A1c > 9% as uncontrolled). Chi-square statistics were also significant.
Statistical Analysis
Age group and sex specific average PDC and rates of adherence and control were calculated for each state/MSA and insurance type. State and MSA representative outcomes were generated by applying the T2DM rate and adherence and control measures to a representative T2DM population residing in each state/MSA. This population file was constructed combining demographics, medical insurance, and type of living arrangement information from the 2012 American Community Survey, diabetes prevalence for a community-based population from the 2011 and 2012 Behavioral Risk Factor Surveillance System, and diabetes prevalence for a nursing home population from the 2004 National Nursing Home Survey. (Appendix B describes the construction of the MSA population files, available in online article.)
A Z-score was calculated to evaluate the standard deviation of each state’s/MSA’s adherence from the average PDC across states/MSAs. Spearman’s correlation coefficients were calculated between percentage adherent and percentage controlled. Statistical significance was determined using a P value below 0.050. All analyses were performed using SAS version 9.3 (SAS Institute, Cary, NC).
Results
Across the 3 insurance types, 80% of patients received anti-diabetic medication and constituted our study population. Respectively, 88%, 73%, and 82% of commercially insured patients, Medicare patients receiving Part D benefits, and Medicaid insured patients with T2DM received antidiabetic medication (Table 1). Among the commercially insured, 45% were female, while 61% and 67% were female among the Medicare and Medicaid insured, respectively. The majority used OAD drugs only: 73% for commercially insured, 64% for Medicare, and 68% for Medicaid.
TABLE 1.
Sample Statistics of Patients with T2DM Receiving Antidiabetic Medication by Age and Gender
| Commercial | Medicare | Medicaid | ||||
|---|---|---|---|---|---|---|
| Sample Size | % Medication | Sample Size | % Medication | Sample Size | % Medication | |
| T2DM patients receiving medication | 197,941 | 88 | 184,439 | 73 | 70,003 | 82 |
| Age group | ||||||
| 18-34 | 7,177 | 89 | 4,953 | 74 | ||
| 35-44 | 26,505 | 90 | 9,794 | 82 | ||
| 45-54 | 65,419 | 89 | 23,500 | 84 | ||
| 55-59 | 48,269 | 87 | 16,373 | 86 | ||
| 60-64 | 50,571 | 85 | 15,383 | 79 | ||
| < 65 | 39,238 | 76 | ||||
| 65-69 | 32,100 | 76 | ||||
| ≥ 70 | 113,101 | 70 | ||||
| Gender | ||||||
| Female | 88,770 | 88 | 112,335 | 72 | 46,727 | 83 |
| Male | 109,171 | 89 | 72,104 | 73 | 23,276 | 79 |
T2DM = type 2 diabetes mellitus
At the national level, average PDC was 79% for our study population, and 65% of the population had an average PDC of 80% or above. Average PDC and drug adherence increased by age: among commercially insured adults aged 18-34 years, the average PDC was 63%, while the average PDC for people aged 70 years and above insured by Medicare was 84% (Table 2). On average, men had higher adherence than women using average PDC and level of adherence. While the difference was smallest among Medicare patients, the difference was statistically significant: men had an average PDC of 83.2% (95% confidence interval [CI] =83.0-83.3), while women had an average PDC of 82.7% (95% CI = 82.6-82.9). Average PDC and drug adherence were higher for those patients insured by Medicare (83%, 95% CI = 82.9-83.1) than for those patients who were commercially insured (76.6%, 95% CI = 76.5-76.8) and Medicaid insured (74.4%, 95% CI = 74.2-74.6).
TABLE 2.
Average PDC, Drug Adherence Status, and Diabetes Control Status for Patients with T2DM Receiving Antidiabetic Medication by Insurance Type
| Commercial | Medicare | Medicaid | ||||
|---|---|---|---|---|---|---|
| Mean (%) | Standard Error | Mean (%) | Standard Error | Mean (%) | Standard Error | |
| Average PDC | ||||||
| Age group | ||||||
| 18-34 | 63 | 0.003 | 64 | 0.004 | ||
| 35-44 | 70 | 0.002 | 70 | 0.003 | ||
| 45-54 | 76 | 0.001 | 75 | 0.002 | ||
| 55-59 | 79 | 0.001 | 79 | 0.002 | ||
| 60-64 | 82 | 0.001 | 81 | 0.002 | ||
| <65 | 79 | 0.001 | ||||
| 65-69 | 84 | 0.001 | ||||
| ≥ 70 | 84 | 0.001 | ||||
| Gender | ||||||
| Female | 75 | 0.001 | 83 | 0.001 | 73 | 0.001 |
| Male | 78 | 0.001 | 83 | 0.001 | 76 | 0.002 |
| Total | 77 | 0.001 | 83 | 0.001 | 75 | 0.001 |
| Percentage with PDC ≥ 80% | ||||||
| Age group | ||||||
| 18-34 | 38 | 0.006 | 41 | 0.005 | ||
| 35-44 | 44 | 0.003 | 48 | 0.005 | ||
| 45-54 | 47 | 0.002 | 49 | 0.003 | ||
| 55-59 | 53 | 0.003 | 56 | 0.004 | ||
| 60-64 | 57 | 0.003 | 57 | 0.004 | ||
| <65 | 63 | 0.002 | ||||
| 65-69 | 71 | 0.003 | ||||
| ≥70 | 73 | 0.001 | ||||
| Gender | ||||||
| Female | 57 | 0.002 | 70 | 0.001 | 55 | 0.002 |
| Male | 61 | 0.001 | 71 | 0.002 | 58 | 0.003 |
| Total | 60 | 0.001 | 71 | 0.001 | 57 | 0.002 |
| Diabetes Control | ||||||
| Age group | ||||||
| 18-34 | 67 | 0.006 | 54 | 0.007 | ||
| 35-44 | 68 | 0.003 | 52 | 0.005 | ||
| 45-54 | 67 | 0.002 | 52 | 0.003 | ||
| 55-59 | 68 | 0.002 | 52 | 0.004 | ||
| 60-64 | 68 | 0.002 | 52 | 0.004 | ||
| <65 | 47 | 0.003 | ||||
| 65-69 | 54 | 0.003 | ||||
| ≥70 | 56 | 0.001 | ||||
| Gender | ||||||
| Female | 69 | 0.002 | 53 | 0.001 | 53 | 0.002 |
| Male | 68 | 0.001 | 54 | 0.002 | 53 | 0.003 |
| Total | 69 | 0.001 | 54 | 0.001 | 53 | 0.002 |
PDC = proportion of days covered; T2DM = type 2 diabetes mellitus.
Across the 3 insurance types, 60% of patients with T2DM receiving medication had their diabetes under control (Table 2). Between ages 18 and 64 years, the proportion of patients with their diabetes under control remained stable. However, for Medicare patients, diabetes control increased with age. Below aged 65 years, 46.6% (95% CI = 46.1-47.1) of the patients had their diabetes under control compared with 56.4% (95% CI = 56.1-56.6) of patients aged 70 years and above. Diabetes control was highest for commercially insured patients (68.9%, 95% CI = 69.1-68.7) than for Medicare (53.7%, 95% CI = 53.5-54.0) and Medicaid patients (52.7%, 95% CI = 52.3-53.0).
Figure 2 displays the average PDC across states and insurance types. Across the states, Medicaid patients experienced more variation in average PDC than Medicare or commercially insured patients. Among commercially insured patients, Minnesota had the highest average PDC (85%), while Florida, Georgia, and Mississippi had the lowest average PDC (73%). For Medicare patients, Maine, North Dakota, and Wyoming had the highest average PDC (87%), while the District of Columbia had the lowest average PDC (79%). For the Medicaid patients, Idaho, Montana, and Nebraska had the highest average PDC (82%), while Michigan had the lowest average PDC (61%).
Figure 2.
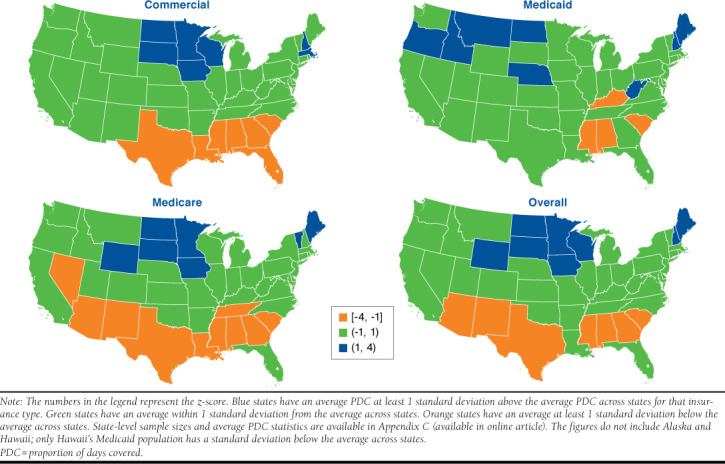
State Average PDC in Comparison to Average PDC Across States by Insurance Type and Overall
Among Medicare patients, the variation in percent adherent across states is smaller than the variation in percent adherent across states for Medicaid patients (Table 3). Percent adherent varied between 51% (Mississippi) and 74% (Minnesota) among the commercially insured; between 61% (District of Columbia) and 79% (Maine and North Dakota) among the Medicare patients; and between 33% (Kentucky) and 71% (Montana) among the Medicaid patients. Furthermore, the variation in percent adherent across states was larger than the variation in average PDC, suggesting that while average PDC may be similar, there is a larger variation in adherence if an adherence cutoff of 80% were used.
TABLE 3.
Proportion of the Population Adherent to Medication and with Diabetes Control
| State | Drug Adherence | Diabetes Control | ||||||
|---|---|---|---|---|---|---|---|---|
| Commercial % | Medicare % | Medicaid % | All Three % | Commercial % | Medicare % | Medicaid % | All Three % | |
| Alabama | 56 | 65 | 52 | 60 | 71 | 55 | 52 | 61 |
| Alaska | 59 | 74 | 59 | 66 | 68 | 67 | 55 | 66 |
| Arizona | 57 | 66 | 50 | 60 | 62 | 50 | 60 | 56 |
| Arkansas | 57 | 70 | 48 | 62 | 79 | 62 | 51 | 67 |
| California | 61 | 70 | 57 | 65 | 74 | 48 | 51 | 58 |
| Colorado | 61 | 70 | 59 | 65 | 66 | 56 | 52 | 59 |
| Connecticut | 61 | 72 | 61 | 66 | 70 | 54 | 53 | 61 |
| Delaware | 62 | 75 | 56 | 68 | 70 | 52 | 53 | 59 |
| District of Columbia | 56 | 61 | 33 | 56 | 68 | 44 | 53 | 55 |
| Florida | 54 | 70 | 55 | 62 | 65 | 50 | 51 | 56 |
| Georgia | 54 | 67 | 58 | 61 | 68 | 51 | 51 | 58 |
| Hawaii | 59 | 73 | 51 | 65 | 72 | 60 | 52 | 64 |
| Idaho | 61 | 71 | 67 | 66 | 83 | 66 | 55 | 71 |
| Illinois | 61 | 72 | 55 | 66 | 68 | 54 | 52 | 60 |
| Indiana | 60 | 69 | 57 | 65 | 73 | 56 | 51 | 62 |
| Iowa | 70 | 77 | 61 | 73 | 79 | 71 | 53 | 72 |
| Kansas | 65 | 76 | 50 | 69 | 73 | 62 | 52 | 65 |
| Kentucky | 60 | 70 | 33 | 62 | 76 | 58 | 54 | 65 |
| Louisiana | 55 | 67 | 59 | 61 | 72 | 53 | 52 | 60 |
| Maine | 62 | 79 | 67 | 71 | 77 | 62 | 55 | 67 |
| Maryland | 62 | 72 | 57 | 66 | 62 | 49 | 52 | 55 |
| Massachusetts | 68 | 72 | 60 | 69 | 66 | 54 | 52 | 59 |
| Michigan | 58 | 71 | 42 | 63 | 70 | 55 | 53 | 61 |
| Minnesota | 74 | 78 | 56 | 74 | 81 | 69 | 52 | 72 |
| Mississippi | 51 | 64 | 37 | 56 | 71 | 54 | 53 | 60 |
| Missouri | 60 | 72 | 64 | 66 | 63 | 54 | 54 | 58 |
| Montana | 66 | 75 | 71 | 71 | 81 | 62 | 57 | 69 |
| Nebraska | 65 | 72 | 67 | 69 | 70 | 70 | 54 | 68 |
| Nevada | 58 | 67 | 63 | 63 | 66 | 52 | 53 | 57 |
| New Hampshire | 67 | 73 | 59 | 69 | 72 | 63 | 55 | 66 |
| New Jersey | 62 | 74 | 59 | 67 | 67 | 49 | 53 | 57 |
| New Mexico | 59 | 64 | 49 | 60 | 62 | 44 | 51 | 52 |
| New York | 59 | 75 | 62 | 67 | 70 | 53 | 53 | 59 |
| North Carolina | 58 | 69 | 53 | 63 | 70 | 54 | 51 | 60 |
| North Dakota | 71 | 79 | 66 | 75 | 77 | 71 | 56 | 72 |
| Ohio | 61 | 71 | 56 | 66 | 68 | 54 | 60 | 60 |
| Oklahoma | 57 | 68 | 56 | 62 | 71 | 55 | 51 | 61 |
| Oregon | 63 | 72 | 69 | 69 | 67 | 55 | 58 | 60 |
| Pennsylvania | 64 | 74 | 67 | 69 | 68 | 58 | 54 | 61 |
| Rhode Island | 69 | 68 | 60 | 68 | 71 | 54 | 55 | 61 |
| South Carolina | 57 | 67 | 49 | 61 | 74 | 60 | 51 | 65 |
| South Dakota | 68 | 78 | 61 | 72 | 81 | 66 | 55 | 71 |
| Tennessee | 57 | 67 | 53 | 62 | 68 | 52 | 52 | 58 |
| Texas | 55 | 66 | 51 | 60 | 60 | 45 | 50 | 51 |
| Utah | 61 | 69 | 66 | 65 | 79 | 67 | 56 | 71 |
| Vermont | 59 | 73 | 57 | 66 | 68 | 67 | 58 | 66 |
| Virginia | 63 | 70 | 66 | 67 | 68 | 54 | 53 | 59 |
| Washington | 64 | 73 | 55 | 67 | 70 | 54 | 53 | 60 |
| West Virginia | 62 | 72 | 66 | 67 | 72 | 55 | 54 | 61 |
| Wisconsin | 68 | 74 | 57 | 70 | 72 | 62 | 53 | 65 |
| Wyoming | 66 | 77 | 60 | 71 | 61 | 63 | 57 | 62 |
| Average across states | 61 | 71 | 57 | 66 | 71 | 57 | 53 | 62 |
Note: The full table including standard errors for drug adherence and diabetes control and a map for diabetes control are presented in Appendices D and E (available in online article).
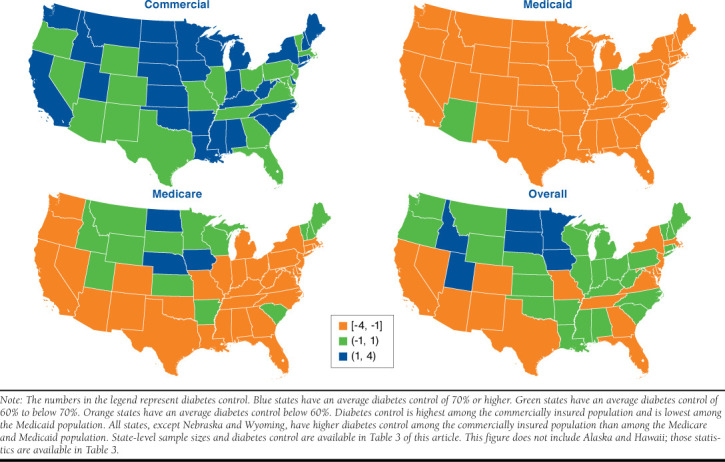
At the state level, variation in diabetes control across states and insurance types are more apparent. Diabetes control among the commercially insured patients was higher than among the Medicare and Medicaid populations (Table 3). Average diabetes control ranged between 60% in Texas and Wyoming and 83% in Idaho among the commercially insured; between 44% in District of Columbia and New Mexico and 71% in Iowa and North Dakota among the Medicare patients; and between 50% in Texas and 60% in Arizona and Ohio among the Medicaid patients.
The correlation between the state adherence rate and diabetes control was positive and significant for all insurance types. The correlation coefficient was smallest for the commercially insured patients (0.28, P = 0.043) and somewhat higher for the Medicare and Medicaid patients (0.49 and 0.56, P < 0.001, respectively).
MSA variation in diabetes drug adherence and diabetes control followed a pattern similar to the state variation previously presented. Results for average PDC and diabetes control are available in Appendix F (available in online article). Average PDC is higher for the Medicare patients than for the Medicaid and commercially insured patients and experiences less variation in average PDC across MSAs. In contrast, diabetes control was highest among the commercially insured patients and lowest among the Medicare patients. Variation in average PDC across MSAs was similar to the variation in average PDC across states. However, variation in diabetes control was larger at the MSA level than the state level.
Discussion
This study identifies gaps in drug adherence and diabetes control at the national, state, and MSA levels. Average PDC for an insured patient population with T2DM that received diabetic medication was 79%. However, for the same population, 1 in 3 patients (35%) did not achieve at least 80% PDC. Furthermore, at least 40% of the insured patient population with T2DM that received diabetic medication did not have their diabetes under control. Average PDC for our 3 insurance populations ranged between 75% and 83%, suggesting little difference in adherence across insurance categories. Our drug adherence results are comparable with 2 other nationally representative PBO populations.7 However, our Medicaid adherence results are higher than the 39% and 46% adherence for a Medi-Cal dataset using 1996-1998 data.
Compared with the Medicaid (75%) and commercially insured population (77%), the Medicare insured patients had a significantly higher average PDC (83%). However, commercially insured patients had better diabetes control (71%) than Medicare and Medicaid insured patients (57% and 53%, respectively). The relationship between drug adherence and diabetes control is confounded by disease duration, which could explain why Medicare patients on average have high levels of drug adherence but low levels of diabetes control.19 At the same time, disease complications are more likely to arise as the disease progresses.20 As a result, elderly patients are more likely to have lower diabetes control despite higher levels of drug adherence, although for elderly patients, less stringent A1c levels may be more appropriate depending on their disease history.
State- and MSA-level variation in drug adherence and diabetes control is relatively small for Medicare and commercially insured populations. For example, among the commercially insured population, average PDC ranged between 73% and 85%, while diabetes control ranged between 60% and 83%. However, the Medicaid population experienced substantial variation in drug adherence across states (ranging between 61% and 82%) but little variation in diabetes control (50%-60%). Regional variations in drug adherence that we describe correspond to findings in earlier literature. Similar to the study by Couto et al. (2014),13 the states that correspond to the New England, Middle Atlantic, East North Central, and West North Central regions have higher antidiabetic medication adherence than East South Central states in the Medicare population. Our results for the commercially insured population also largely correspond to the results for the commercial population used in that study.
Limitations
This study has several limitations. First, the definition of diabetes control is based on ICD-9-CM codes and captures lack of control only when physicians identify a patient as such. We therefore compared the prevalence rate when using ICD-9-CM with the prevalence rate when using various A1c cutoffs. The ICD-9-CM-based prevalence rate overestimated controlled status relative to the ADA’s recommended A1c level of below 7% for tight control (51%) but underestimated controlled status when using the Health Resources and Services Administration’s diabetes measure of poor control, which defines poor control with an A1c above 9%. While we do not have laboratory values available for the Medicare and Medicaid patients, we have no reason to suspect that coding would be different across insurance population or across states. Future research should focus on validating the use of ICD-9-CM codes to identify diabetes control across these dimensions.
Second, we used claims from 1 large commercial plan only, which may not be representative of the insured population at subnational levels. These concerns are mitigated partially by reweighting the outcomes by age group and gender. Third, because of data limitations, only Medicare and Medicaid fee-for-service beneficiaries were included in this study. States that have largely transitioned their Medicaid beneficiaries to managed care settings are often more complex. Fourth, some states suffered from small sample size problems including the commercial population in Alaska, Hawaii, and Vermont and the Medicaid population in Arizona. Ohio Medicaid claims did not include number of days supplied and therefore did not meet our selection criteria. Furthermore, our results were not adjusted for individual determinants of drug adherence other than age and gender. Income, race/ethnicity, health status, access to care, and provider treatment patterns could explain some of the geographic variation in outcomes that we highlight in this study. Understanding the significant drivers of geographic variation beyond those that can be explained by population demographics could shed light on creating more effective public health initiatives.
Finally, it is important to note that the Affordable Care Act may have changed the landscape in diabetes care. Expanded coverage such as the further closing of the coverage gap in the Medicare “donut hole” and Medicaid expansion improves access to care and potentially increases the incentives for preventive care and medication adherence. Other factors, such as the emergence of high-deductible employer plans and the large deductibles and cost sharing featured by many individual plans purchased through health exchanges, should also be considered. The interplay of these new trends in the age of health care reform merits additional research.
Conclusions
This study provides a detailed view of the adequacy of diabetes management among the insured population across states and MSAs. The significant and positive correlations between percentage of patients with optimal adherence and percentage with diabetes under control show that those states and MSAs with higher levels of adherence tend to have higher percentages of T2DM patients with control. The findings of this study highlight the need to develop localized efforts in increasing diabetes drug adherence awareness and improving care. Physicians and other prescribers, insurers, and employers should identify and acknowledge potential barriers to adherence. They should strive to educate patients on why they need to fill their prescriptions, even when patients are asymptomatic, and communicate the consequences of lack of adherence on their health on an ongoing basis. A systematic review concluded that continued multiple elements such as self-management plans, reinforcement, and occasionally rewards over time is a key element of success.21 In particular, these efforts should concentrate on the states of Arizona, Georgia, New Mexico, and Texas, where diabetes drug adherence and diabetes control remain the lowest in the country.
Acknowledgments
The authors would like to thank Erin Byrne, Jerry Franz, and Alisa Schiffman for their valuable insights on diabetes care and treatment.
APPENDIX A. Type 2 Diabetes Sample Inclusion Criteria and Identification Algorithm
This appendix describes the inclusion and exclusion criteria that make up the sample of this study and describes the type 2 diabetes (T2DM) identification algorithm that was applied to the sample.
Inclusion criteria
Evidence of T2DM (see Type 2 Diabetes Identification Algorithm below).
Continuously enrolled in the fee-for-service coverage type of health plan (UnitedHealth Care, Medicare, Medicaid) during the measurement year.
For diabetes patients with pharmacy claims or physician orders of prescriptions, ≥ 1 pharmacy claim for an antidiabetic medication.
Exclusion criteria
Patients aged < 18 years.
Evidence of type 1 diabetes (T1DM; identified with ICD-9-CM diagnosis codes 250.x1 or 250.x3).
Evidence of gestational diabetes and/or pregnancy (if longitudinal approach is used during the 6-month baseline and follow-up periods).
Type 2 Diabetes Identification Algorithm
T2DM is defined as a patient who meets the following criteria using data during the measurement period:
≥ 1 medical claim for T2DM (ICD-9-CM diagnosis codes 250.x0 or 250.x2) and no claims for T1DM, identified with ICD-9-CM diagnosis codes 250.x1 or 250.x3. Diagnosis codes in the primary or secondary positions will be used.
OR
-
If medical claims for both T1DM and T2DM, the patient must meet 1 of the following:
-
≥ 1 claim for an oral antidiabetic drug (OAD) including sulfonylureas, metformin, thiazolidinediones, α-glucosidase inhibitors, meglitinide derivatives, DPP-4 inhibitors, or combination of OADs with insulin or noninsulin injectable.OR
- If no claims for OADs, the patient must have 4 or more claims for 250.xx with a valid fifth digit AND the number of claims for T2DM (250.x0, 250.x2) must exceed the number of claims for T1DM (250.x1, 250.x3).
-
OR
If no medical claims for 250.xx with a valid fifth digit, then the patient must have ≥ 1 claim for an OAD AND a claim for an injectable antidiabetic medication (GLP-1, pramlintide, or insulin) and no evidence of medical claims identifying T1DM patient in the previous year.
OR
If no medical claims for 250.xx with a valid fifth digit and no claims for injectable antidiabetic medications, then the patient must have ≥ 1 claim for an OAD AND no medical claims with any of the following ICD-9-CM codes: 256.4, 272.6, 277.7, 648.8x, and 790.2x. These diagnosis codes are associated with diseases that require treatment similar to T2DM. As a result, we would be unable to ascertain that a patient was taking the drug for T2DM or another condition. Codes in any position will be used.
APPENDIX B. Methods for Metropolitan Statistical Area Analysis
This appendix details the multiple steps that were undertaken to create representative results at the Metropolitan Statistical Area (MSA) level.
The first step involved creating a population file with a representative sample of the population residing in each county. The county files combined demographics, household income, medical insurance, and type of living arrangement information from the 2012 American Community Survey (ACS; n = 2,375,715); disease prevalence and health risk factors for a community-based population from the 2011 and 2012 Behavioral Risk Factor Surveillance System (BRFSS; n = 982,154); and disease prevalence and health risk factors for a nursing home population from the 2004 National Nursing Home Survey (NNHS; n = 14,017).
Using information on residence type, we divided the ACS population into those in nursing facilities to be matched to people in the NNHS and those not in nursing facilities to be matched to the BRFSS. For the noninstitutionalized population, each ACS individual was randomly matched with someone in the BRFSS from the same state, sex, age group (15 groups); race/ethnicity (non-Hispanic white, non-Hispanic black, non-Hispanic other, Hispanic); insured/ uninsured status; and household income level (8 levels). Individuals categorized as residing in a nursing home were randomly matched to a person in the NNHS in the same age group, sex, and race/ethnicity strata. The final matched ACS-BRFSS-NNHS database included a sample weight for each person. This weight reflected the number of people he or she represents among the general population.
Using U.S. Census Bureau 2012 data, we identified the current size of the population in each county by age, sex, and race/ethnicity. This county population database was merged with the Current Statistical Area Delineation file to aggregate counties to census-defined metropolitan areas. The county population files with the MSA definitions were then merged with the ACS-BRFSS-NNHS matched national population file to create a health and socioeconomic profile for a representative sample of adults in each of the selected 50 metropolitan areas. Finally, for each metropolitan area, the sample weights for the individuals in the merged file were re-weighted so that the weighted statistics matched the U.S. Census-published MSA demographic composition. Note that not all metropolitan areas correspond with federal designations. The New York-Newark-Jersey City, NY-NJ-PA, was split such that the NY numbers corresponded solely to the population in NY, with the NJ population placed in a constructed Northern NJ metropolitan designation. Likewise, Orange County, California, was carved out of the Los Angeles-Long Beach-Anaheim metropolitan area and reported separately. Similarly, West Palm Beach was reported separately from Miami-Fort Lauderdale, Florida (whereas the official designation of this metropolitan statistical area is Miami-Fort Lauderdale-West Palm Beach).
APPENDIX C. Sample Size T2DM Receiving Antidiabetic Medication and Average PDC by State and Insurance Type
| State | Sample Size | Commercial | Medicare | Medicaid | All Three | ||||||
| Commercial | Medicare | Medicaid | Mean | StdErr | Mean | StdErr | Mean | StdErr | Mean | StdErr | |
| Alaska | 42 | 209 | 156 | 76 | 0.04 | 84 | 0.01 | 75 | 0.02 | 80 | 0.00 |
| Alabama | 1,220 | 3,514 | 2,169 | 75 | 0.01 | 80 | 0.00 | 70 | 0.01 | 77 | 0.00 |
| Arkansas | 1,222 | 2,516 | 835 | 75 | 0.01 | 82 | 0.00 | 70 | 0.01 | 78 | 0.00 |
| Arizona | 5,528 | 1,971 | 43 | 75 | 0.00 | 81 | 0.01 | 70 | 0.04 | 77 | 0.00 |
| California | 14,169 | 16,093 | 7,440 | 78 | 0.00 | 83 | 0.00 | 76 | 0.00 | 80 | 0.00 |
| Colorado | 4,120 | 1,317 | 742 | 77 | 0.00 | 83 | 0.01 | 75 | 0.01 | 80 | 0.00 |
| Connecticut | 2,659 | 2,177 | 1,023 | 77 | 0.00 | 84 | 0.00 | 79 | 0.01 | 80 | 0.00 |
| District of Columbia | 565 | 317 | 570 | 76 | 0.01 | 79 | 0.01 | 64 | 0.01 | 76 | 0.00 |
| Delaware | 238 | 728 | 522 | 77 | 0.02 | 85 | 0.01 | 73 | 0.01 | 81 | 0.00 |
| Florida | 13,351 | 10,621 | 1,789 | 73 | 0.00 | 83 | 0.00 | 74 | 0.01 | 78 | 0.00 |
| Georgia | 27,574 | 5,474 | 2,924 | 73 | 0.00 | 81 | 0.00 | 76 | 0.00 | 77 | 0.00 |
| Hawaii | 47 | 569 | 370 | 77 | 0.03 | 84 | 0.01 | 71 | 0.01 | 80 | 0.00 |
| Iowa | 2,329 | 2,778 | 854 | 82 | 0.00 | 86 | 0.00 | 78 | 0.01 | 84 | 0.00 |
| Idaho | 244 | 795 | 534 | 78 | 0.02 | 83 | 0.01 | 82 | 0.01 | 81 | 0.00 |
| Illinois | 5,255 | 9,507 | 2,596 | 77 | 0.00 | 84 | 0.00 | 74 | 0.01 | 80 | 0.00 |
| Indiana | 2,563 | 4,880 | 2,292 | 76 | 0.00 | 83 | 0.00 | 74 | 0.01 | 79 | 0.00 |
| Kansas | 1,465 | 2,266 | 692 | 79 | 0.01 | 85 | 0.00 | 72 | 0.01 | 81 | 0.00 |
| Kentucky | 1,570 | 4,438 | 2,499 | 76 | 0.01 | 82 | 0.00 | 66 | 0.01 | 78 | 0.00 |
| Louisiana | 3,936 | 3,183 | 2,650 | 74 | 0.00 | 81 | 0.00 | 76 | 0.00 | 78 | 0.00 |
| Massachusetts | 1,467 | 4,112 | 1,428 | 81 | 0.01 | 84 | 0.00 | 76 | 0.01 | 82 | 0.00 |
| Maryland | 6,499 | 3,276 | 1,356 | 79 | 0.00 | 84 | 0.00 | 75 | 0.01 | 81 | 0.00 |
| Maine | 186 | 1,351 | 526 | 78 | 0.02 | 87 | 0.01 | 80 | 0.01 | 83 | 0.00 |
| Michigan | 1,379 | 6,338 | 340 | 75 | 0.01 | 83 | 0.00 | 61 | 0.02 | 77 | 0.00 |
| Minnesota | 5,779 | 1,877 | 860 | 85 | 0.00 | 86 | 0.00 | 75 | 0.01 | 85 | 0.00 |
| Missouri | 4,327 | 4,449 | 1,706 | 76 | 0.00 | 83 | 0.00 | 79 | 0.01 | 80 | 0.00 |
| Mississippi | 1,421 | 3,467 | 1,673 | 73 | 0.01 | 80 | 0.00 | 63 | 0.01 | 75 | 0.00 |
| Montana | 126 | 616 | 316 | 79 | 0.02 | 85 | 0.01 | 82 | 0.01 | 82 | 0.00 |
| North Carolina | 3,675 | 7,722 | 2,717 | 76 | 0.00 | 82 | 0.00 | 74 | 0.01 | 78 | 0.00 |
| North Dakota | 257 | 571 | 318 | 83 | 0.01 | 87 | 0.01 | 81 | 0.01 | 85 | 0.00 |
| Nebraska | 836 | 1,424 | 311 | 79 | 0.01 | 84 | 0.01 | 82 | 0.01 | 82 | 0.00 |
| New Hampshire | 293 | 832 | 335 | 80 | 0.01 | 84 | 0.01 | 75 | 0.01 | 81 | 0.00 |
| New Jersey | 8,176 | 5,893 | 1,131 | 78 | 0.00 | 85 | 0.00 | 78 | 0.01 | 81 | 0.00 |
| New Mexico | 980 | 1,193 | 473 | 76 | 0.01 | 81 | 0.01 | 72 | 0.01 | 78 | 0.00 |
| Nevada | 804 | 891 | 411 | 76 | 0.01 | 81 | 0.01 | 79 | 0.01 | 79 | 0.00 |
| New York | 21,020 | 9,748 | 7,506 | 76 | 0.00 | 85 | 0.00 | 78 | 0.00 | 81 | 0.00 |
| Ohio | 8,345 | 7,068 | — | 78 | 0.00 | 83 | 0.00 | 75 | 0.00 | 80 | 0.00 |
| Oklahoma | 3,086 | 2,979 | 1,179 | 75 | 0.00 | 82 | 0.00 | 75 | 0.01 | 78 | 0.00 |
| Oregon | 860 | 1,549 | 546 | 79 | 0.01 | 84 | 0.01 | 81 | 0.01 | 82 | 0.00 |
| Pennsylvania | 2,454 | 7,635 | 809 | 79 | 0.00 | 84 | 0.00 | 80 | 0.01 | 82 | 0.00 |
| Rhode Island | 1,524 | 568 | 215 | 81 | 0.01 | 82 | 0.01 | 78 | 0.02 | 81 | 0.00 |
| South Carolina | 1,330 | 3,377 | 1,277 | 74 | 0.01 | 81 | 0.00 | 69 | 0.01 | 77 | 0.00 |
| South Dakota | 128 | 731 | 296 | 81 | 0.02 | 86 | 0.01 | 76 | 0.01 | 83 | 0.00 |
| Tennessee | 2,819 | 4,799 | 2,915 | 75 | 0.00 | 81 | 0.00 | 73 | 0.00 | 78 | 0.00 |
| Texas | 20,952 | 13,793 | 4,923 | 74 | 0.00 | 81 | 0.00 | 72 | 0.00 | 77 | 0.00 |
| Utah | 861 | 732 | 320 | 77 | 0.01 | 82 | 0.01 | 80 | 0.01 | 80 | 0.00 |
| Virginia | 4,330 | 5,062 | 1,050 | 78 | 0.00 | 83 | 0.00 | 78 | 0.01 | 80 | 0.00 |
| Vermont | 41 | 537 | 301 | 76 | 0.04 | 86 | 0.01 | 76 | 0.01 | 81 | 0.00 |
| Washington | 1,385 | 3,205 | 1,246 | 79 | 0.01 | 83 | 0.00 | 75 | 0.01 | 81 | 0.00 |
| Wisconsin | 3,899 | 2,897 | 1,276 | 81 | 0.00 | 85 | 0.00 | 76 | 0.01 | 82 | 0.00 |
| West Virginia | 477 | 2,085 | 1,356 | 78 | 0.01 | 84 | 0.00 | 81 | 0.01 | 81 | 0.00 |
| Wyoming | 128 | 309 | 187 | 79 | 0.02 | 87 | 0.01 | 77 | 0.02 | 82 | 0.00 |
| Average PDC across states | 197,941 | 184,439 | 70,003 | 77 | 0.00 | 83 | 0.00 | 75 | 0.00 | 80 | 0.00 |
PDC = proportion of days covered; StdErr = standard error; T2DM = type 2 diabetes mellitus
APPENDIX D. Proportion of the Population Adherent to Medication and with Diabetes Control
| State | Drug Adherence | Diabetes Control | ||||||||||||||
|---|---|---|---|---|---|---|---|---|---|---|---|---|---|---|---|---|
| Commercial | Medicare | Medicaid | All Three | Commercial | Medicare | Medicaid | All Three | |||||||||
| Mean | StdErr | Mean | StdErr | Mean | StdErr | Mean | StdErr | Mean | StdErr | Mean | StdErr | Mean | StdErr | Mean | StdErr | |
| Alabama | 56 | 0.01 | 65 | 0.01 | 52 | 0.01 | 60 | 0.01 | 71 | 0.01 | 55 | 0.01 | 52 | 0.01 | 61 | 0.01 |
| Alaska | 59 | 0.07 | 74 | 0.03 | 59 | 0.04 | 66 | 0.02 | 68 | 0.07 | 67 | 0.03 | 55 | 0.04 | 66 | 0.01 |
| Arizona | 57 | 0.01 | 66 | 0.01 | 50 | 0.07 | 60 | 0.01 | 62 | 0.01 | 50 | 0.01 | 60 | 0.07 | 56 | 0.01 |
| Arkansas | 57 | 0.01 | 70 | 0.01 | 48 | 0.01 | 62 | 0.01 | 79 | 0.01 | 62 | 0.01 | 51 | 0.02 | 67 | 0.01 |
| California | 61 | 0.00 | 70 | 0.00 | 57 | 0.00 | 65 | 0.00 | 74 | 0.00 | 48 | 0.00 | 51 | 0.01 | 58 | 0.01 |
| Colorado | 61 | 0.01 | 70 | 0.01 | 59 | 0.02 | 65 | 0.01 | 66 | 0.01 | 56 | 0.01 | 52 | 0.02 | 59 | 0.01 |
| Connecticut | 61 | 0.01 | 72 | 0.01 | 61 | 0.01 | 66 | 0.01 | 70 | 0.01 | 54 | 0.01 | 53 | 0.01 | 61 | 0.01 |
| Delaware | 62 | 0.03 | 75 | 0.02 | 56 | 0.02 | 68 | 0.01 | 70 | 0.03 | 52 | 0.02 | 53 | 0.02 | 59 | 0.01 |
| District of Columbia | 56 | 0.02 | 61 | 0.03 | 33 | 0.02 | 56 | 0.01 | 68 | 0.02 | 44 | 0.03 | 53 | 0.02 | 55 | 0.01 |
| Florida | 54 | 0.00 | 70 | 0.00 | 55 | 0.01 | 62 | 0.00 | 65 | 0.00 | 50 | 0.00 | 51 | 0.01 | 56 | 0.02 |
| Georgia | 54 | 0.00 | 67 | 0.01 | 58 | 0.01 | 61 | 0.00 | 68 | 0.00 | 51 | 0.01 | 51 | 0.01 | 58 | 0.00 |
| Hawaii | 59 | 0.07 | 73 | 0.02 | 51 | 0.03 | 65 | 0.02 | 72 | 0.07 | 60 | 0.02 | 52 | 0.03 | 64 | 0.01 |
| Idaho | 61 | 0.03 | 71 | 0.02 | 67 | 0.02 | 66 | 0.01 | 83 | 0.02 | 66 | 0.02 | 55 | 0.02 | 71 | 0.00 |
| Illinois | 61 | 0.01 | 72 | 0.00 | 55 | 0.01 | 66 | 0.00 | 68 | 0.01 | 54 | 0.01 | 52 | 0.01 | 60 | 0.00 |
| Indiana | 60 | 0.01 | 69 | 0.01 | 57 | 0.01 | 65 | 0.00 | 73 | 0.01 | 56 | 0.01 | 51 | 0.01 | 62 | 0.01 |
| Iowa | 70 | 0.01 | 77 | 0.01 | 61 | 0.01 | 73 | 0.01 | 79 | 0.01 | 71 | 0.01 | 53 | 0.02 | 72 | 0.00 |
| Kansas | 65 | 0.01 | 76 | 0.01 | 50 | 0.01 | 69 | 0.01 | 73 | 0.01 | 62 | 0.01 | 52 | 0.02 | 65 | 0.00 |
| Kentucky | 60 | 0.01 | 70 | 0.01 | 33 | 0.01 | 62 | 0.01 | 76 | 0.01 | 58 | 0.01 | 54 | 0.01 | 65 | 0.00 |
| Louisiana | 55 | 0.01 | 67 | 0.01 | 59 | 0.01 | 61 | 0.00 | 72 | 0.01 | 53 | 0.01 | 52 | 0.01 | 60 | 0.00 |
| Maine | 62 | 0.04 | 79 | 0.01 | 67 | 0.00 | 71 | 0.01 | 77 | 0.03 | 62 | 0.01 | 55 | 0.00 | 67 | 0.01 |
| Maryland | 62 | 0.01 | 72 | 0.01 | 57 | 0.01 | 66 | 0.00 | 62 | 0.01 | 49 | 0.01 | 52 | 0.01 | 55 | 0.01 |
| Massachusetts | 68 | 0.01 | 72 | 0.01 | 60 | 0.01 | 69 | 0.01 | 66 | 0.01 | 54 | 0.01 | 52 | 0.01 | 59 | 0.00 |
| Michigan | 58 | 0.01 | 71 | 0.01 | 42 | 0.02 | 63 | 0.01 | 70 | 0.01 | 55 | 0.01 | 53 | 0.02 | 61 | 0.02 |
| Minnesota | 74 | 0.01 | 78 | 0.01 | 56 | 0.01 | 74 | 0.00 | 81 | 0.01 | 69 | 0.01 | 52 | 0.02 | 72 | 0.00 |
| Mississippi | 51 | 0.01 | 64 | 0.01 | 37 | 0.01 | 56 | 0.01 | 71 | 0.01 | 54 | 0.01 | 53 | 0.01 | 60 | 0.01 |
| Missouri | 60 | 0.01 | 72 | 0.01 | 64 | 0.01 | 66 | 0.00 | 63 | 0.01 | 54 | 0.01 | 54 | 0.01 | 58 | 0.00 |
| Montana | 66 | 0.04 | 75 | 0.02 | 71 | 0.02 | 71 | 0.01 | 81 | 0.03 | 62 | 0.02 | 57 | 0.03 | 69 | 0.00 |
| Nebraska | 65 | 0.02 | 72 | 0.01 | 67 | 0.02 | 69 | 0.01 | 70 | 0.02 | 70 | 0.01 | 54 | 0.03 | 68 | 0.01 |
| Nevada | 58 | 0.02 | 67 | 0.02 | 63 | 0.02 | 63 | 0.01 | 66 | 0.02 | 52 | 0.02 | 53 | 0.02 | 57 | 0.00 |
| New Hampshire | 67 | 0.03 | 73 | 0.02 | 59 | 0.02 | 69 | 0.01 | 72 | 0.03 | 63 | 0.02 | 55 | 0.03 | 66 | 0.02 |
| New Jersey | 62 | 0.01 | 74 | 0.01 | 59 | 0.01 | 67 | 0.00 | 67 | 0.01 | 49 | 0.01 | 53 | 0.01 | 57 | 0.01 |
| New Mexico | 59 | 0.02 | 64 | 0.01 | 49 | 0.02 | 60 | 0.01 | 62 | 0.02 | 44 | 0.01 | 51 | 0.02 | 52 | 0.00 |
| New York | 59 | 0.00 | 75 | 0.00 | 62 | 0.00 | 67 | 0.00 | 70 | 0.00 | 53 | 0.01 | 53 | 0.01 | 59 | 0.01 |
| North Carolina | 58 | 0.01 | 69 | 0.01 | 53 | 0.01 | 63 | 0.00 | 70 | 0.01 | 54 | 0.01 | 51 | 0.01 | 60 | 0.01 |
| North Dakota | 71 | 0.03 | 79 | 0.02 | 66 | 0.02 | 75 | 0.01 | 77 | 0.03 | 71 | 0.02 | 56 | 0.03 | 72 | 0.02 |
| Ohio | 61 | 0.01 | 71 | 0.01 | 56 | 0.00 | 66 | 0.00 | 68 | 0.01 | 54 | 0.01 | 60 | 0.00 | 60 | 0.01 |
| Oklahoma | 57 | 0.01 | 68 | 0.01 | 56 | 0.01 | 62 | 0.01 | 71 | 0.01 | 55 | 0.01 | 51 | 0.01 | 61 | 0.01 |
| Oregon | 63 | 0.02 | 72 | 0.01 | 69 | 0.01 | 69 | 0.01 | 67 | 0.02 | 55 | 0.01 | 58 | 0.02 | 60 | 0.01 |
| Pennsylvania | 64 | 0.01 | 74 | 0.01 | 67 | 0.01 | 69 | 0.00 | 68 | 0.01 | 58 | 0.01 | 54 | 0.02 | 61 | 0.00 |
| Rhode Island | 69 | 0.01 | 68 | 0.02 | 60 | 0.03 | 68 | 0.01 | 71 | 0.01 | 54 | 0.02 | 55 | 0.03 | 61 | 0.01 |
| South Carolina | 57 | 0.01 | 67 | 0.01 | 49 | 0.01 | 61 | 0.01 | 74 | 0.01 | 60 | 0.01 | 51 | 0.01 | 65 | 0.00 |
| South Dakota | 68 | 0.04 | 78 | 0.02 | 61 | 0.02 | 72 | 0.01 | 81 | 0.03 | 66 | 0.02 | 55 | 0.03 | 71 | 0.00 |
| Tennessee | 57 | 0.01 | 67 | 0.01 | 53 | 0.01 | 62 | 0.00 | 68 | 0.01 | 52 | 0.01 | 52 | 0.01 | 58 | 0.01 |
| Texas | 55 | 0.00 | 66 | 0.00 | 51 | 0.01 | 60 | 0.00 | 60 | 0.00 | 45 | 0.00 | 50 | 0.01 | 51 | 0.01 |
| Utah | 61 | 0.02 | 69 | 0.02 | 66 | 0.02 | 65 | 0.01 | 79 | 0.01 | 67 | 0.02 | 56 | 0.02 | 71 | 0.01 |
| Vermont | 59 | 0.08 | 73 | 0.02 | 57 | 0.03 | 66 | 0.02 | 68 | 0.07 | 67 | 0.02 | 58 | 0.03 | 66 | 0.00 |
| Virginia | 63 | 0.01 | 70 | 0.01 | 66 | 0.01 | 67 | 0.00 | 68 | 0.01 | 54 | 0.01 | 53 | 0.01 | 59 | 0.01 |
| Washington | 64 | 0.01 | 73 | 0.01 | 55 | 0.01 | 67 | 0.01 | 70 | 0.01 | 54 | 0.01 | 53 | 0.01 | 60 | 0.01 |
| West Virginia | 62 | 0.02 | 72 | 0.01 | 66 | 0.01 | 67 | 0.01 | 72 | 0.02 | 55 | 0.01 | 54 | 0.01 | 61 | 0.01 |
| Wisconsin | 68 | 0.01 | 74 | 0.01 | 57 | 0.01 | 70 | 0.00 | 72 | 0.01 | 62 | 0.01 | 53 | 0.01 | 65 | 0.01 |
| Wyoming | 66 | 0.04 | 77 | 0.02 | 60 | 0.03 | 71 | 0.02 | 61 | 0.04 | 63 | 0.03 | 57 | 0.03 | 62 | 0.01 |
| Average across states | 61 | 0.00 | 71 | 0.00 | 57 | 0.00 | 66 | 0.00 | 71 | 0.00 | 57 | 0.00 | 53 | 0.00 | 62 | 0.00 |
StdErr = standard error.
APPENDIX E. Variation in Percentage of Diabetes Control Across Insurance Types and States
APPENDIX F. Sample Size of T2DM Receiving Antidiabetic Medication, Average PDC, and Diabetes Control by MSA and Insurance Type
This table presents average proportion of days covered (PDC) and percentage of diabetes control for each of the 50 Metropolitan Stastistical Areas (MSAs) included in this study. Similar to results at the state level, variation in diabetes control at the MSA level is larger than variation in average PDC. Average PDC ranges between 72% (Orlando, FL) and 84% (Minneapolis, MN) for commercially insured patients; 78% (Houston, TX) and 86% (Southern New Jersey, NJ) for Medicare insured patients; and 60% (Detroit, MI) and 82% (Orange County, CA) among Medicaid patients. In contrast, diabetes control varies between 52% (San Antonio, TX) and 82% (Minneapolis, MN) for commercially insured patients; 37% (San Antonio, TX) and 68% (Minneapolis, MN) for Medicare patients; and 42% (Salt Lake City, UT) and 60% (Phoenix, AZ; Pittsburgh, PA; Las Vegas, NV; and Cleveland and Columbus, OH).
For some metropolitan areas, the medical claims sample was small for some demographic groups (in particular the aged 20-34 years population). When the sample size fell below 30 adults for a particular demographic group, we used information for that same demographic group at the state or national level. For example, we did not identify any patients in the metropolitan areas and state level in Ohio. As a result, these statistics are based on the national age group and gender-adjusted estimates.
| MSA, State | Sample Size of T2DM with Treatment | Proportion of Days Covered | Diabetes Control | ||||||||||||||||
|---|---|---|---|---|---|---|---|---|---|---|---|---|---|---|---|---|---|---|---|
| Commercial | Medicare | Medicaid | Commercial | Medicare | Medicaid | All Three | Commercial | Medicare | Medicaid | All Three | |||||||||
| % | Z-score | % | Z-score | % | Z-score | % | Z-score | % | StdErr | % | StdErr | % | StdErr | % | StdErr | ||||
| Atlanta, GA | 8,817 | 2,079 | 561 | 74 | -1.24 | 80 | -1.39 | 75 | 0.02 | 77 | -1.33 | 66 | 0.01 | 48 | 0.01 | 49 | 0.02 | 55 | 0.01 |
| Austin, TX | 1,243 | 556 | 125 | 76 | -0.28 | 82 | -0.57 | 73 | -0.41 | 79 | -0.52 | 55 | 0.01 | 41 | 0.02 | 47 | 0.04 | 47 | 0.01 |
| Baltimore, MD | 1,423 | 1,683 | 659 | 81 | 1.49 | 83 | 0.49 | 75 | 0.05 | 81 | 1.05 | 61 | 0.01 | 48 | 0.01 | 48 | 0.02 | 53 | 0.01 |
| Boston, MA | 1,538 | 2,617 | 860 | 81 | 1.54 | 84 | 1.07 | 77 | 0.68 | 82 | 1.50 | 64 | 0.01 | 55 | 0.01 | 48 | 0.02 | 58 | 0.01 |
| Charlotte, NC | 1,203 | 1,524 | 295 | 75 | -0.76 | 82 | -0.13 | 72 | -0.78 | 78 | -0.65 | 70 | 0.01 | 58 | 0.01 | 48 | 0.03 | 61 | 0.01 |
| Chicago, IL | 2,303 | 6,203 | 1,674 | 76 | -0.40 | 83 | 0.31 | 74 | -0.10 | 79 | -0.09 | 70 | 0.01 | 52 | 0.01 | 48 | 0.01 | 58 | 0.01 |
| Cincinnati, OH | 2,271 | 1,069 | 78 | 78 | 0.34 | 82 | -0.36 | 71 | -0.98 | 79 | -0.22 | 77 | 0.01 | 58 | 0.01 | 54 | 0.06 | 65 | 0.01 |
| Cleveland, OH | 831 | 1,128 | — | 76 | -0.33 | 82 | -0.11 | 75 | 0.04 | 79 | -0.22 | 71 | 0.02 | 55 | 0.01 | 60 | 0.00 | 62 | 0.01 |
| Columbus, OH | 1,208 | 867 | — | 79 | 0.62 | 84 | 1.08 | 75 | 0.04 | 81 | 0.86 | 63 | 0.01 | 44 | 0.02 | 60 | 0.00 | 53 | 0.01 |
| Dallas, TX | 6,296 | 2,823 | 665 | 74 | -1.10 | 81 | -0.97 | 77 | 0.44 | 78 | -0.96 | 62 | 0.01 | 47 | 0.01 | 48 | 0.02 | 53 | 0.02 |
| Denver, CO | 2,041 | 412 | 201 | 78 | 0.24 | 81 | -0.84 | 76 | 0.23 | 79 | -0.22 | 64 | 0.01 | 49 | 0.02 | 49 | 0.03 | 55 | 0.00 |
| Detroit, MI | 349 | 2,608 | 98 | 75 | -0.96 | 82 | -0.10 | 60 | -4.05 | 77 | -1.52 | 69 | 0.02 | 48 | 0.01 | 51 | 0.05 | 56 | 0.01 |
| Hartford, CT | 1,070 | 714 | 365 | 77 | -0.05 | 84 | 0.63 | 75 | 0.03 | 80 | 0.28 | 71 | 0.01 | 54 | 0.02 | 50 | 0.02 | 60 | 0.00 |
| Houston, TX | 2,637 | 2,219 | 901 | 74 | -1.25 | 78 | -2.66 | 70 | -1.36 | 76 | -2.27 | 60 | 0.01 | 41 | 0.01 | 50 | 0.02 | 49 | 0.00 |
| Indianapolis, IN | 793 | 1,127 | 321 | 77 | -0.05 | 83 | 0.55 | 70 | -1.18 | 79 | -0.04 | 72 | 0.02 | 53 | 0.01 | 49 | 0.03 | 60 | 0.01 |
| Jacksonville, FL | 887 | 749 | 95 | 73 | -1.62 | 81 | -0.82 | 74 | -0.30 | 77 | -1.34 | 71 | 0.02 | 52 | 0.02 | 55 | 0.05 | 60 | 0.00 |
| Kansas City, MO | 1,125 | 1,010 | 281 | 79 | 0.66 | 82 | -0.11 | 75 | 0.17 | 80 | 0.34 | 69 | 0.01 | 56 | 0.01 | 48 | 0.03 | 60 | 0.00 |
| Las Vegas, NV | 345 | 580 | — | 76 | -0.39 | 81 | -1.20 | 75 | 0.04 | 78 | -0.78 | 62 | 0.03 | 46 | 0.02 | 60 | 0.00 | 54 | 0.00 |
| Los Angeles, CA | 2,575 | 4,539 | 2,172 | 77 | 0.06 | 83 | 0.17 | 75 | 0.14 | 80 | 0.14 | 77 | 0.01 | 45 | 0.01 | 49 | 0.01 | 58 | 0.00 |
| Memphis, TN | 538 | 877 | 378 | 73 | -1.51 | 79 | -2.24 | 69 | -1.53 | 76 | -2.25 | 62 | 0.02 | 46 | 0.02 | 49 | 0.03 | 52 | 0.01 |
| Miami, FL | 2,342 | 3,040 | 78 | 73 | -1.42 | 83 | 0.48 | 74 | -0.25 | 79 | -0.59 | 67 | 0.01 | 44 | 0.01 | 56 | 0.05 | 54 | 0.01 |
| Milwaukee, WI | 1,873 | 784 | 428 | 81 | 1.47 | 82 | -0.23 | 69 | -1.60 | 80 | 0.30 | 71 | 0.01 | 57 | 0.02 | 48 | 0.02 | 62 | 0.00 |
| Minneapolis, MN | 2,998 | 830 | 432 | 84 | 2.98 | 85 | 1.50 | 73 | -0.53 | 83 | 2.20 | 82 | 0.01 | 68 | 0.02 | 48 | 0.02 | 71 | 0.02 |
| Nashville, TN | 493 | 762 | 255 | 77 | -0.03 | 81 | -0.99 | 72 | -0.72 | 78 | -0.66 | 62 | 0.02 | 45 | 0.02 | 47 | 0.03 | 52 | 0.00 |
| New York, NY | 21,432 | 10,938 | 5,121 | 76 | -0.25 | 85 | 1.52 | 79 | 1.12 | 81 | 0.85 | 70 | 0.00 | 50 | 0.00 | 47 | 0.01 | 57 | 0.01 |
| Norfolk, VA | 275 | 763 | 95 | 75 | -0.65 | 82 | -0.55 | 75 | -0.05 | 78 | -0.63 | 57 | 0.03 | 49 | 0.02 | 56 | 0.05 | 53 | 0.00 |
| Northern New Jersey, NJ | 8,495 | 4,494 | 729 | 78 | 0.37 | 84 | 1.17 | 78 | 0.75 | 81 | 0.94 | 66 | 0.01 | 49 | 0.01 | 47 | 0.02 | 55 | 0.00 |
| Oklahoma City, OK | 1,268 | 713 | 232 | 76 | -0.48 | 83 | 0.05 | 77 | 0.69 | 79 | -0.07 | 70 | 0.01 | 55 | 0.02 | 48 | 0.03 | 60 | 0.01 |
| Orange County, CA | 911 | 1,092 | 206 | 79 | 0.84 | 85 | 1.49 | 82 | 1.93 | 82 | 1.62 | 73 | 0.01 | 47 | 0.01 | 43 | 0.03 | 56 | 0.00 |
| Orlando, FL | 1,850 | 1,046 | 121 | 72 | -2.01 | 81 | -0.69 | 77 | 0.51 | 77 | -1.29 | 64 | 0.01 | 50 | 0.01 | 53 | 0.04 | 56 | 0.02 |
| Philadelphia, PA | 673 | 3,282 | 346 | 79 | 0.81 | 84 | 0.69 | 73 | -0.44 | 81 | 0.66 | 68 | 0.02 | 55 | 0.01 | 49 | 0.02 | 59 | 0.01 |
| Phoenix, AZ | 3,053 | 986 | 15 | 75 | -0.69 | 82 | -0.33 | 75 | 0.04 | 79 | -0.52 | 60 | 0.01 | 47 | 0.01 | 60 | 0.13 | 53 | 0.00 |
| Pittsburgh, PA | 159 | 714 | 17 | 80 | 1.05 | 83 | 0.48 | 75 | 0.04 | 81 | 0.81 | 67 | 0.04 | 56 | 0.02 | 60 | 0.12 | 61 | 0.01 |
| Portland, OR | 1,020 | 523 | 239 | 78 | 0.45 | 84 | 0.91 | 78 | 0.86 | 81 | 0.88 | 66 | 0.01 | 53 | 0.02 | 48 | 0.03 | 57 | 0.01 |
| Providence, RI | 2,699 | 1,120 | 298 | 81 | 1.60 | 84 | 0.75 | 78 | 0.82 | 82 | 1.41 | 70 | 0.01 | 57 | 0.01 | 46 | 0.03 | 61 | 0.02 |
| Raleigh, NC | 565 | 555 | 120 | 76 | -0.46 | 83 | 0.20 | 77 | 0.51 | 79 | -0.03 | 73 | 0.02 | 52 | 0.02 | 51 | 0.04 | 60 | 0.01 |
| Richmond, VA | 755 | 832 | 69 | 78 | 0.26 | 82 | -0.47 | 77 | 0.60 | 80 | 0.06 | 68 | 0.02 | 53 | 0.02 | 58 | 0.06 | 59 | 0.01 |
| Riverside, CA | 1,255 | 1,251 | 659 | 76 | -0.41 | 82 | -0.42 | 74 | -0.12 | 79 | -0.45 | 74 | 0.01 | 43 | 0.01 | 49 | 0.02 | 56 | 0.01 |
| Sacramento, CA | 596 | 633 | 500 | 80 | 1.03 | 83 | 0.14 | 77 | 0.69 | 81 | 0.78 | 68 | 0.02 | 45 | 0.02 | 47 | 0.02 | 54 | 0.00 |
| Salt Lake City, UT | 861 | 292 | 130 | 77 | -0.05 | 81 | -0.89 | 81 | 1.76 | 79 | -0.04 | 75 | 0.01 | 63 | 0.03 | 42 | 0.03 | 65 | 0.01 |
| San Antonio, TX | 2,275 | 796 | 519 | 76 | -0.56 | 78 | -2.65 | 75 | 0.05 | 77 | -1.56 | 52 | 0.01 | 37 | 0.02 | 48 | 0.02 | 44 | 0.00 |
| San Diego, CA | 1,012 | 934 | 436 | 79 | 0.63 | 82 | -0.10 | 78 | 0.83 | 80 | 0.49 | 74 | 0.01 | 55 | 0.02 | 48 | 0.02 | 61 | 0.00 |
| San Francisco, CA | 1,183 | 1,548 | 617 | 79 | 0.86 | 85 | 1.47 | 81 | 1.59 | 82 | 1.55 | 74 | 0.01 | 50 | 0.01 | 47 | 0.02 | 59 | 0.01 |
| Seattle, WA | 1,395 | 1,314 | 526 | 79 | 1.00 | 84 | 0.83 | 75 | 0.00 | 81 | 0.94 | 68 | 0.01 | 53 | 0.01 | 47 | 0.02 | 58 | 0.01 |
| Southern Connecticut, CT | 2,373 | 1,054 | 464 | 79 | 0.88 | 83 | 0.50 | 80 | 1.36 | 81 | 1.04 | 71 | 0.01 | 54 | 0.01 | 44 | 0.02 | 60 | 0.01 |
| Southern New Jersey, NJ | 354 | 971 | 180 | 77 | -0.13 | 86 | 1.79 | 79 | 1.09 | 81 | 1.05 | 71 | 0.02 | 51 | 0.01 | 48 | 0.04 | 58 | 0.00 |
| St. Louis, MO | 2,867 | 1,694 | 442 | 77 | -0.05 | 83 | 0.26 | 73 | -0.61 | 79 | -0.05 | 61 | 0.01 | 48 | 0.01 | 47 | 0.02 | 53 | 0.01 |
| Tampa, FL | 4,089 | 1,202 | 203 | 74 | -1.22 | 83 | 0.45 | 73 | -0.48 | 79 | -0.56 | 61 | 0.01 | 48 | 0.01 | 50 | 0.03 | 53 | 0.01 |
| Washington, DC | 3,979 | 1,972 | 862 | 78 | 0.57 | 83 | 0.02 | 70 | -1.42 | 80 | -0.02 | 66 | 0.01 | 48 | 0.01 | 49 | 0.02 | 55 | 0.01 |
| West Palm Beach, FL | 1,706 | 721 | 50 | 74 | -1.39 | 82 | -0.20 | 74 | -0.22 | 78 | -0.90 | 65 | 0.01 | 51 | 0.02 | 59 | 0.07 | 57 | 0.01 |
| Average across MSAs | 114,299 | 82,240 | 24,118 | 77 | N/A | 83 | N/A | 75 | N/A | 80 | N/A | 67 | 0.00 | 51 | 0.00 | 50 | 0.00 | 57 | 0.00 |
MSA = Metropolitan Statistical Area; N/A = not applicable; PDC = proportion of days covered; StdErr = standard error; T2DM = type 2 diabetes mellitus.
References
- 1.Roebuck MC, Liberman JN, Gemmill-Toyama M, Brennan TA.. Medication adherence leads to lower health care use and costs despite increased drug spending. Health Aff (Millwood). 2011;30(1):91-99. [DOI] [PubMed] [Google Scholar]
- 2.Centers for Disease Control and Prevention. National diabetes statistics report, 2014. Available at: http://www.cdc.gov/diabetes/pubs/statsreport14/national-diabetes-report-web.pdf. Accessed October 5, 2015. [Google Scholar]
- 3.Rozenfeld Y, Hunt JS, Plauschinat C, Wong KS.. Oral antidiabetic medication adherence and glycemic control in managed care. Am J Manag Care. 2008;14(2):71-75. [PubMed] [Google Scholar]
- 4.Stratton IM, Adler AI, Neil HA, et al. Association of glycaemia with macrovascular and microvascular complications of type 2 diabetes (UKPDS 35): prospective observational study. BMJ. 2000;321(7258):405-12. [DOI] [PMC free article] [PubMed] [Google Scholar]
- 5.Fitch K, Pyenson BS, Iwasaki K.. Medical claim cost impact of improved diabetes control for medicare and commercially insured patients with type 2 diabetes. J Manag Care Pharm. 2013;19(8):609-20, 620a-620d. Available at: http://www.amcp.org/JMCP/2013/2013_October/17214/1033.html. [DOI] [PMC free article] [PubMed] [Google Scholar]
- 6.American Diabetes Association. Tight diabetes control. 2013. Available at: http://www.diabetes.org/living-with-diabetes/treatment-and-care/blood-glucose-control/tight-diabetes-control.html. Accessed October 5, 2015.
- 7.Cramer, JA. A systematic review of adherence with medications for diabetes. Diabetes Care. 2004;27(5):1218-24. [DOI] [PubMed] [Google Scholar]
- 8.Kirkman MS, Rowan-Martin MT, Levin R, et al. Determinants of adherence to diabetes medications: findings from a large pharmacy claims database. Diabetes Care. 2015;38(4):604-09. [DOI] [PMC free article] [PubMed] [Google Scholar]
- 9.Cuckler G, Martin A, Whittle L, et al. Health spending by state of residence, 1991-2009. Medicare Medicaid Res Rev. 2011;1(4). [DOI] [PMC free article] [PubMed] [Google Scholar]
- 10.American Diabetes Association. Economic costs of diabetes in the U.S. in 2012. Diabetes Care. 2013;36(4):1033-46. [DOI] [PMC free article] [PubMed] [Google Scholar]
- 11.Tamblyn R, Eguale T, Huang A, Winslade N, Doran P.. The incidence and determinants of primary nonadherence with prescribed medication in primary care: a cohort study. Ann Intern Med. 2014;160(7):441-50. [DOI] [PubMed] [Google Scholar]
- 12.Hoang C, Kolenic G, Kline-Rogers E, Eagle KA, Erickson SR.. Mapping geographic areas of high and low drug adherence in patients prescribed continuing treatment for acute coronary syndrome after discharge. Pharmacotherapy. 2011;31(10):927-33. [DOI] [PubMed] [Google Scholar]
- 13.Couto JE, Panchal JM, Lal LS, et al. Geographic variation in medication adherence in commercial and Medicare Part D populations. J Manag Care Spec Pharm. 2014;20(8):834-42. Available at: http://www.amcp.org/JMCP/2014/August/18388/1033.html. [DOI] [PMC free article] [PubMed] [Google Scholar]
- 14.Choudhry NK, Shrank WH, Levin RL, et al. Measuring concurrent adherence to multiple related medications. Am J Manag Care. 2009;15(7):457-64. [PMC free article] [PubMed] [Google Scholar]
- 15.Pharmacy Quality Alliance. Proportion of days covered (PDC): percentage of patients who filled at least two prescriptions for the specified diabetes medications on two unique dates of service who met the PDC threshold of 80% during the measurement period. 2014. Available at: http://www.qualitymeasures.ahrq.gov/content.aspx?id=47500. Accessed October 22, 2015. [Google Scholar]
- 16.Buysman E, Conner C, Aagren M, Bouchard J, Liu F.. Adherence and persistence to a regimen of basal insulin in a pre-filled pen compared to vial/syringe in insulin-naive patients with type 2 diabetes. Curr Med Res Opin. 2011;27(9):1709-17. [DOI] [PubMed] [Google Scholar]
- 17.Malmenäs M, Bouchard JR, Langer J.. Retrospective real-world adherence in patients with type 2 diabetes initiating once-daily liraglutide 1.8 mg or twice-daily exenatide 10 μg. Clin Ther. 2013;35(6):795-807. [DOI] [PubMed] [Google Scholar]
- 18.Centers for Medicare & Medicaid Services. Medicare health & drug plan quality and performance ratings, 2013: Part C & Part D technical notes. First plan preview. August 9, 2012. Available at: http://www.cms.gov/Medicare/Prescription-Drug-Coverage/PrescriptionDrugCovGenIn/Downloads/Technical-Notes-2013-.pdf. Accessed October 5, 2015. [Google Scholar]
- 19.Feldman BS, Cohen-Stavi CJ, Leibowitz M, et al. Defining the role of medication adherence in poor glycemic control among a general adult population with diabetes. PLoS One. 2014;9(9):e108145. [DOI] [PMC free article] [PubMed] [Google Scholar]
- 20.Orchard TJ, Dorman JS, Maser RE, et al. Prevalence of complications in IDDM by sex and duration. Pittsburgh Epidemiology of Diabetes Complications Study II. Diabetes. 1990;39(9):1116-24. [DOI] [PubMed] [Google Scholar]
- 21.Kripalani S, Yao X, Haynes RB.. Interventions to enhance medication adherence in chronic medical conditions: a systematic review. Arch Intern Med. 2007;167(6):540-50. [DOI] [PubMed] [Google Scholar]