

Abstract
BACKGROUND:
Pharmacists have important roles in managing the therapy of patients with type 2 diabetes and improving patient care. Pharmacists titrate medications; reinforce patient education; and address care gaps, such as medication adherence, vaccinations, and overdue health screenings. Through these efforts and more, pharmacists help to improve patient care and achieve Healthcare Effectiveness Data and Information Set (HEDIS) measures. Thus, it is important to demonstrate improved health outcomes through pharmacist contributions to diabetes management, which can then provide an opportunity to expand the role of clinical pharmacists in other medical centers and practice settings within an integrated health care system.
OBJECTIVE:
To evaluate the effect of a pharmacist-managed program within a primary care setting by determining the percentage of patients who reached the HEDIS goal of hemoglobin A1c (A1c) < 8.0%, the time needed to reach this goal, and A1c reduction in patients with type 2 diabetes.
METHODS:
This retrospective cohort study identified patients aged 18-74 years who had uncontrolled A1c ≥ 8.0%. Patients in the Complete Care Program (CCP) had their diabetes therapy managed by a pharmacist and were propensity score matched to a comparison group of usual care (UC) patients. Multivariate regression analyses and a Cox proportional hazards model compared the change in A1c from baseline and the time to A1c goal between the 2 groups.
RESULTS:
There were no significant differences in baseline characteristics between the CCP and UC patients (n = 980 patients per group). CCP patients were significantly more likely to achieve the HEDIS goal of A1c < 8% at 3 months (OR = 2.44, 95% CI = 1.93-3.10, P < 0.0001) and at 6 months (OR = 1.32, 95% CI = 1.08-1.61, P = 0.007) compared with the UC patients. CCP patients also reached the A1c goal significantly faster: 3.4 months versus 4.6 months (P < 0.0001), even after controlling for covariates (HR = 1.24, 95% CI = 1.09-1.41, P = 0.001). Change in baseline A1c was -0.95% versus -0.54% (P < 0.0001) at 3 months and -1.19% versus -0.99% (P = 0.008) at 6 months for CCP versus UC patients, respectively.
CONCLUSIONS:
Type 2 diabetes therapy management by clinical pharmacists was associated with a greater percentage of patients achieving the HEDIS goal of A1c < 8.0%, reaching the A1c goal faster, and a greater A1c reduction from baseline at 3 and 6 months of follow-up compared with patients receiving usual care.
What is already known about this subject
Type 2 diabetes is a major chronic health problem, and its prevalence continues to grow rapidly in the United States and worldwide, while its economic burden continues to increase in parallel.
Pharmacists are in an ideal position to provide patient education, monitor and promote adherence, change or titrate medication regimens per authorized protocols, and order labs, which has been shown to have a positive effect on achieving target goals and therapeutic outcomes.
Few primary care practices include clinical pharmacists on their multidisciplinary teams, and even fewer are in integrated managed care health care systems, where clinical pharmacists work in the primary care setting alongside primary care providers.
What this study adds
This study offers a real-world example of pharmacists with provider status who have increased their scope of practice to initiate and optimize drug therapy and provide value as drug-disease experts.
A framework is provided for collaboration between pharmacists and primary care medical teams to provide chronic disease management that could be considered in other practice settings within an integrated health care system.
Type 2 diabetes is a major chronic health problem, and its prevalence continues to grow rapidly worldwide. It has been estimated that 425 million people globally suffered from diabetes in 2017, and this number is predicted to increase to 693 million people by 2045.1 If diabetes is left uncontrolled, many clinical studies suggest that patients may develop microvascular and macrovascular complications, which cause morbidity, mortality, and decreased health-related quality of life.2-4 Patients with diabetes impose an increasing economic burden on U.S. health care, with estimated expenditures of $673 billion in 2015.2,5,6 Despite the available effective therapies to help patients manage their type 2 diabetes and control their hemoglobin A1c (A1c) levels, evidence demonstrates that achievement of recommended targets remains suboptimal for these patients.2,7,8 Some contributory factors and challenges associated with suboptimal goal attainment are lack of adherence, complex treatment regimens, medication side effects, poor patient-provider communication, patient financial resources, and possible memory impairment.9-11
To address these challenges associated with type 2 diabetes, health plans are developing collaborative and integrated team-based approaches to help manage patients with chronic disease states, thus creating multidisciplinary health care teams.2,5,12-18 In addition, the American Diabetes Association recommends incorporating multidisciplinary care management teams, including pharmacists, to improve care for patients with diabetes and optimize provider and team behavior.19 Several studies have shown pharmacists to be in an ideal position to provide patient education, monitor and promote adherence, change or titrate medication regimens per authorized protocols, and order labs, which has been shown to have a positive effect on achieving target goals and therapeutic outcomes.2,5,12-18 The technical and scientific expertise of pharmacists in pharmacotherapy and comprehensive medication review contributes positively to diabetes management and bridges the gap between other health care professionals and patients.2,5 Pharmacists can ensure continuity of care and work closely with health care professionals in designing, implementing, and monitoring therapeutic plans to achieve specific outcomes that improve patient quality of life.2,5,14,15
However, few primary care practices include clinical pharmacists on their multidisciplinary teams, and even fewer pharmacists are in integrated managed care health care systems, where clinical pharmacists work in the primary care setting alongside primary care providers. In this study, our objective was to evaluate the effect of pharmacist interventions within a primary care setting on patients with type 2 diabetes compared with similar patients receiving usual care.
Methods
The Complete Care Program
This study was conducted at the Kaiser Permanente Downey Medical Center (KPDMC), which is 1 of the 14 medical service areas of Kaiser Permanente Southern California (KPSC), an integrated health care delivery system with currently over 4.3 million members. KPDMC serves a predominantly Latino population, which represents more than 60% of its membership.
The Complete Care Program (CCP) at KPDMC is designed as a team-based approach in which clinical pharmacists are added to an integrated health care team that includes a primary care provider (PCP), nurses, and support staff. The clinical pharmacists work within the primary care setting to manage the drug therapies of patients with type 2 diabetes under a collaborative practice protocol. In this model, there is approximately 1 pharmacist for every 10 PCPs. The pharmacists proactively identify and outreach to patients who have seen their PCPs within the previous 10 months and have an uncontrolled A1c ≥ 8.0%, as recorded in the electronic medical record (EMR). PCPs may also directly refer individual patients for pharmacist care based on uncontrolled A1c lab values, if needed. Pharmacists assist the PCPs in achieving A1c, hypertension, and dyslipidemia control among patients who have not reached clinical target goals. Clinical pharmacists can order labs for drug therapy monitoring and initiate, adjust, and stop medications. They also address care gaps such as medication adherence, prescription refills, vaccinations, overdue health screenings, and reinforce patient education regarding lifestyle modifications related to diabetes, hypertension, and dyslipidemia. Through these efforts, pharmacists help to improve patient care and achieve Healthcare Effectiveness Data and Information Set (HEDIS) measures. These standardized performance measures are used to compare health plans across the nation and are developed by the National Committee for Quality Assurance.20
In the CCP, pharmacist interventions are documented by encounter codes in the EMR. Once a patient reaches the A1c goal of < 8.0%, they are referred back to the PCP for further diabetes management. If the PCP concludes it is necessary to achieve a patient-specific A1c goal, (e.g., A1c < 7.0%), then the PCP is responsible for adjusting the diabetes medications to reach that lower goal. There is no further management by the pharmacist as long as the patient stays at A1c < 8.0%. If a patient’s A1c rises to ≥ 8.0% in the future, the cycle will repeat, and the patient’s drug therapy would again be managed by the clinical pharmacist.
Since 2010, the HEDIS Comprehensive Diabetes Care measures have defined A1c control as < 8.0% for patients aged 18-75 years with type 1 or 2 diabetes.21 A goal of < 7.0% is used for a select population meeting specific criteria.21 Therefore, the HEDIS A1c goal of < 8.0% was chosen as the clinical target goal in the CCP and in this retrospective database cohort study.
Study Design and Population
Patients who had type 2 diabetes and uncontrolled A1c ≥ 8.0% from January 1, 2012, to December 31, 2013, at the KPDMC were identified (Figure 1). Patients were required to have an International Classification of Diseases, Ninth Revision, Clinical Modification (ICD-9-CM) type 2 diabetes diagnosis code, be 18-74 years, and have an A1c level ≥ 8.0%. Patients were further categorized into the CCP group with pharmacist-managed diabetes care or the usual care (UC) group (Figure 1).
FIGURE 1.
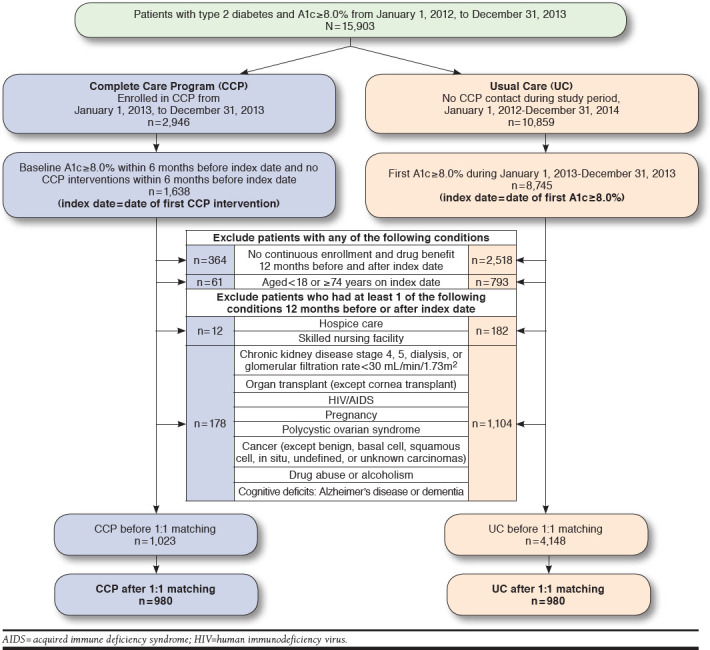
Study Diagram
Patients in the CCP group were seen by a CCP clinical pharmacist, and the index date was defined as the date of the initial intervention by the pharmacist at any time from January 1, 2013, to December 31, 2013. The CCP patients did not have any encounters with a CCP pharmacist in the 6 months before the index date, and they had an uncontrolled A1c ≥ 8.0% on or up to 6 months before the index date. Alternatively, patients in the UC group had no CCP contact at any time during the entire study period and follow-up through December 31, 2014, and the index date for the UC group was defined as the first A1c level ≥ 8.0% from January 1, 2013, to December 31, 2013.
All patients had continuous health plan membership with drug benefit eligibility for 12 months before and after the index date. Patients were excluded from the study if they had any of the following criteria in the 12 months before the index date: (a) receiving hospice care or residing in a skilled nursing facility or (b) chronic kidney disease stage 4 or 5, hemodialysis, glomerular filtration rate (GFR) < 30 mL/min/1.73m2, an active cancer diagnosis (except benign, basal cell, squamous cell, in situ, undefined, or unknown carcinomas), organ transplant (except cornea), human immunodeficiency virus or acquired immune deficiency syndrome, pregnancy, polycystic ovary syndrome, drug or alcohol abuse, Alzheimer’s disease, dementia, or other cognitive deficits (Appendix A, available in online article).
All data were extracted from the KPSC EMR using ICD-9-CM codes. Propensity scores were calculated for each patient as the probability of being in the CCP group based on the following factors in the 12 months before the index date: age; gender; race; body mass index; uncontrolled blood pressure > 140/90 mmHg; ICD-9-CM codes for comorbid conditions (hypertension, dyslipidemia, retinopathy, neuropathy, protein-uria, ischemic and other forms of heart disease, cerebrovascular disease including stroke, and tobacco use); diabetes and hypertension medications; and PCP department (family medicine, internal medicine, or other). The Charlson Comorbidity Index (CCI) score was calculated and used to control for other comorbid conditions in the 12 months before the index date (Appendix B, available in online article).22
The groups were matched by propensity score on a 1:1 basis using the nearest neighbor method ± 0.01. Based on an estimate of 30% of patients at the goal of A1c < 8.0%, we needed about 350 patients in each group to detect a 10% difference in the proportion of patients at A1c goal between the CCP and UC group at an alpha level of 0.05 and 80% power. Although the focus of our study was on the matched cohort, data analysis was performed on the unmatched and matched cohorts to provide more complete information about the population.
Outcomes
The primary outcome was the percentage of patients in the CCP and UC groups who achieved a target A1c goal of < 8.0% during the 12 months of follow-up. We evaluated A1c at 3, 6, 9, and 12 months after the index date. If a patient did not have another A1c value during those 3-month time points, the previous A1c level was used per the last observation carried forward method. Secondary outcomes included time needed to reach the A1c goal and the mean change in A1c from baseline at each 3-month follow-up time point. We also aimed to describe the communication method and number of pharmacist-patient interactions in the CCP group. The CCP pharmacist-patient interactions were defined as telephone calls, office visits, or other methods of communication, such as secure e-mail via the EMR.
Statistical Analyses
Descriptive statistics were used to assess baseline differences between the 2 groups using 2-sided t-tests for continuous variables, and chi-square tests or Fisher’s exact tests were used for categorical variables. Comparisons between the CCP and UC groups were made before and after the 1:1 propensity score matching to check for balance between the matched groups. For the percentage of patients at A1c goal at each 3-month follow-up time point, the McNemar test was used to compare the CCP and UC groups. Paired t-tests were used to compare change in A1c from baseline at each 3-month follow-up time point. Five different multivariate logistic regression models were used to evaluate the likelihood of patients reaching the A1c goal at different time periods: 3, 6, 9, and 12 months after the index date and at any time during follow-up between the CCP versus UC groups. A Cox proportional hazards model was used to analyze the amount of time it took patients to reach the A1c goal of < 8.0% in each of the 2 study groups. Covariates for these models were the same characteristics used to calculate propensity scores. A 2-tailed P value of 0.05 was used to determine statistical significance. All analyses were conducted using SAS version 9.3 (SAS Institute, Cary, NC). This study was approved by the KPSC Institutional Review Board.
Results
A total of 15,903 patients with a diagnosis of type 2 diabetes and A1c ≥ 8.0% were identified between January 1, 2012, and December 31, 2013 (Figure 1). When separated into distinct groups of patients who had been seen by a CCP pharmacist or no CCP contact and after applying exclusion criteria, there were 1,023 patients in the CCP group and 4,148 patients in the UC group. After 1:1 propensity score matching, there were 980 patients in each group (Figure 1).
Patient Characteristics
Baseline characteristics were statistically similar between the 2 groups after 1:1 propensity score matching (Table 1). In the CCP group, the mean (standard deviation [SD]) age was 54.91 [±10.24] years; 538 (54.90%) patients were male; 636 (64.90%) were of Hispanic race; and 678 (69.18%) were obese. Both groups had a majority of patients with baseline A1c > 9.0% and a mean A1c of 10.0%. The number of A1c lab results between the 2 groups were also similar. In addition, most patients had controlled blood pressure < 140/90 mmHg—809 (82.55%) and 810 (82.65%) in the CCP and UC groups, respectively. Additional comorbid conditions were described for both groups before and after matching (Table 1).
TABLE 1.
Baseline Clinical Characteristics
| Characteristic | Unmatched Cohort | Matched Cohort | ||||||||
|---|---|---|---|---|---|---|---|---|---|---|
| Complete Care Program n = 1,023 | Usual Care n = 4,148 | P Value | Complete Care Program n = 980 | Usual Care n = 980 | P Value | |||||
| Age (years) | ||||||||||
| Mean (SD) | 54.91 | (10.26) | 54.48 | (10.72) | 0.248 | 54.91 | (10.24) | 54.31 | (10.41) | 0.196 |
| ≥ 65 years, n (%) | 201 | (19.65) | 787 | (18.97) | 0.623 | 194 | (19.80) | 169 | (17.24) | 0.146 |
| Male, n (%) | 565 | (52.23) | 2181 | (52.58) | 0.128 | 538 | (54.90) | 538 | (54.90) | 1.000 |
| Race, n (%) | ||||||||||
| Hispanic | 672 | (65.69) | 2,313 | (55.76) | < 0.0001 | 636 | (64.90) | 615 | (62.76) | 0.639 |
| Black | 106 | (10.36) | 533 | (12.85) | 104 | (10.61) | 115 | (11.73) | ||
| Asian/Pacific Islander | 49 | (4.79) | 416 | (10.03) | 48 | (4.90) | 54 | (5.51) | ||
| White | 130 | (12.71) | 632 | (15.24) | 127 | (12.96) | 119 | (12.14) | ||
| Other/Unknown | 66 | (6.45) | 254 | (6.12) | 65 | (6.63) | 77 | (7.86) | ||
| Baseline A1c,% | ||||||||||
| Mean (SD) | 10.03 | (1.49) | 9.49 | (1.56) | < 0.0001 | 9.99 | (1.46) | 10.02 | (1.49) | 0.633 |
| 8.0%-9.0%, n (%) | 262 | (25.61) | 2,249 | (54.22) | < 0.0001 | 260 | (26.53) | 245 | (25.00) | 0.439 |
| > 9.0%, n (%) | 761 | (74.39) | 1,899 | (45.78) | 720 | (73.47) | 735 | (75.00) | ||
| Number of A1c labs, mean (SD) | 2.8 | (1.36) | 2.5 | (1.32) | < 0.0001 | 2.73 | (1.24) | 2.63 | (1.32) | 0.120 |
| Baseline BP < 140/90 mmHg, n (%) | 823 | (81.49) | 3,310 | (85.18) | 0.004 | 809 | (82.55) | 810 | (82.65) | 0.953 |
| BMI (kg/m2) | ||||||||||
| Mean (SD) | 33.79 | (6.61) | 33.51 | (7.20) | 0.250 | 33.78 | (6.59) | 33.65 | (7.32) | 0.679 |
| 18.5-24.9, normal BMI, n (%) | 60 | (5.96) | 311 | (7.98) | 0.012 | 57 | (5.82) | 75 | (7.65) | 0.107 |
| 25-29.9, overweight, n (%) | 252 | (25.02) | 1,075 | (27.58) | 245 | (25.00) | 266 | (27.14) | ||
| ≥ 30, obese, n (%) | 695 | (69.02) | 2,512 | (64.44) | 678 | (69.18) | 639 | (65.20) | ||
| Comorbidities, n (%) | ||||||||||
| Hypertension | 618 | (60.41) | 2,256 | (54.39) | 0.001 | 598 | (61.02) | 585 | (59.69) | 0.548 |
| Dyslipidemia | 685 | (66.96) | 2,452 | (59.11) | < 0.0001 | 660 | (67.35) | 660 | (67.35) | 1.000 |
| Retinopathy | 148 | (14.47) | 489 | (11.79) | 0.02 | 144 | (14.69) | 142 | (14.49) | 0.898 |
| Neuropathy | 17 | (1.66) | 69 | (1.66) | 0.997 | 17 | (1.73) | 18 | (1.84) | 0.865 |
| Cardiovascular Disease | 62 | (6.06) | 300 | (7.23) | 0.188 | 61 | (6.22) | 53 | (5.41) | 0.440 |
| Cerebrovascular Disease | 12 | (1.17) | 51 | (1.23) | 0.883 | 12 | (1.22) | 15 | (1.53) | 0.561 |
| Proteinuria | 383 | (37.44) | 798 | (19.24) | < 0.0001 | 353 | (36.02) | 341 | (34.80) | 0.571 |
| Charlson Comorbidity Index, mean (SD) | 1.62 | (1.08) | 1.52 | (0.94) | 0.004 | 1.62 | (1.08) | 1.6 | (0.95) | 0.674 |
| Smoker, n (%) | 249 | (24.34) | 748 | (18.03) | < 0.0001 | 237 | (24.18) | 240 | (24.49) | 0.875 |
A1c = hemoglobin A1c; BMI = body mass index; BP = blood pressure; SD = standard deviation.
Achieving A1c Goal
Significantly more patients in the CCP group achieved the A1c goal at 3 months (27.86% vs. 14.39%, P < 0.0001) and at 6 months (37.35% vs. 31.63%, P = 0.006) when compared with the UC group (Figure 2). There was no difference between the 2 groups at subsequent follow-up time points.
FIGURE 2.
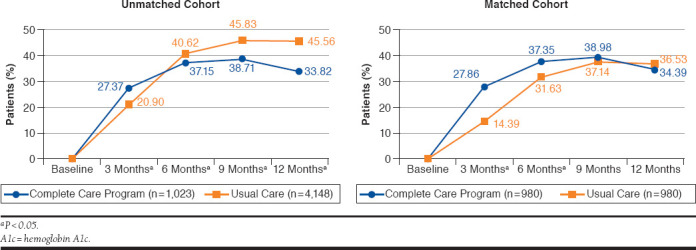
Patients Achieving Goal A1c < 8.0%
Multivariate analyses also showed that at 3 months of follow-up, patients managed by a CCP pharmacist were significantly more likely to achieve the A1c goal compared with UC patients (odds ratio [OR] = 2.44, 95% confidence interval [CI] = 1.93-3.10, P < 0.0001; Table 2). Achieving the A1c goal was also statistically more likely at 6 months of follow-up (OR = 1.32, 95% CI = 1.08-1.61, P = 0.007) for the CCP group (Table 2).
TABLE 2.
Logistic Regressions
| Unmatched Cohort: Unadjusted Logistic Regressionsa | |||
|---|---|---|---|
| Patients at A1c Goal < 8.0% | Complete Care Program vs. Usual Care | ||
| Odds Ratio | 95% CI | P Value | |
| At 3 months | 1.43 | 1.22-1.67 | < 0.0001 |
| At 6 months | 0.86 | 0.75-1.00 | 0.042 |
| At 9 months | 0.75 | 0.65-0.86 | < 0.0001 |
| At 12 months | 0.61 | 0.53-0.71 | < 0.0001 |
| At any time during follow-up | 0.73 | 0.64-0.84 | < 0.0001 |
| Matched Cohort: Multivariate Logistic Regressionsb | |||
| Patients at A1c Goal < 8.0% | Complete Care Program vs. Usual Care | ||
| Odds Ratio | 95% CI | P Value | |
| At 3 months | 2.44 | 1.93-3.10 | < 0.0001 |
| At 6 months | 1.32 | 1.08-1.61 | 0.007 |
| At 9 months | 1.08 | 0.89-1.31 | 0.441 |
| At 12 months | 0.88 | 0.72-1.07 | 0.211 |
| At any time during follow-up | 1.14 | 0.94-1.38 | 0.189 |
aN = 5,171 for all models.
bControlling for age, gender, race, BMI, hypertension, dyslipidemia, retinopathy, neuropathy, cardiovascular disease, cerebrovascular disease, proteinuria, Charlson Comorbidity Index score, smoking, previous type 2 diabetes and hypertension medications, and primary care provider department. N = 1,960 for all models.
A1c = hemoglobin A1c; BMI = body mass index; CI = confidence interval.
Time Needed to Reach A1c Goal
The mean (SD) time to reach A1c goal was 3.4 (2.7) months for the CCP group versus 4.6 (2.7) months for the UC group (P < 0.0001). The median time to A1c goal was 2.6 months versus 3.9 months for the CCP and UC groups, respectively. After controlling for covariates, patients managed by a CCP pharmacist were significantly more likely to reach A1c goal compared with UC patients (hazard ratio [HR] = 1.24, 95% CI = 1.09-1.41, P = 0.001).
A1c Reduction from Baseline
In the first 3 months of follow-up, the mean (SD) change in A1c from baseline was -0.95% (1.47) for the CCP group versus -0.54% (1.12) for the UC group (P < 0.0001; Figure 3). At 6 months, the mean (SD) change in A1c was -1.19% (1.65) versus -0.99% (1.59; P < 0.009) for the CCP and UC groups, respectively (Figure 3). There were no significant differences between the 2 groups at 9 or 12 months.
FIGURE 3.
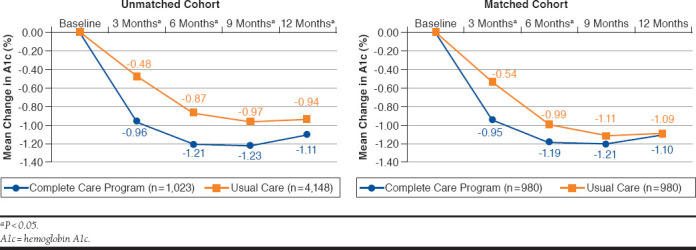
A1c Reduction from Baseline
Pharmacist Interventions
Over the 12-month follow-up period, there were 2,637 CCP pharmacist interventions coded in the EMR. Pharmacists communicated through a variety of methods: 65.0% by telephone calls, 34.5% by in-person office visits, and 0.9% via other methods such as EMR secure email. The mean (SD) number of interventions by a pharmacist over the entire follow-up period was 2.7 (2.3) interventions per patient. The mean (SD) number of CCP pharmacist interventions needed to reach A1c goal was 1.9 (1.3) interventions per patient, with a range of 1 to 9 interventions.
Discussion
This study aimed to examine the clinical effect of drug therapy management by a pharmacist in an interdisciplinary, team-based model within an integrated health care system. Patients who had their diabetes medication therapy managed by a pharmacist were statistically more likely to achieve their A1c goals within 6 months—and reach their goals faster. In addition, these patients had a greater overall decrease in A1c from baseline compared with patients receiving usual care.
This team-based model creates a partnership between PCPs and clinical pharmacists to divide workload. The clinical pharmacist can focus on patients with extremely high A1c values and work to achieve the HEDIS goal of A1c < 8.0%. Meanwhile, the PCP can focus on select patients who need even tighter glucose control (i.e., A1c goal < 7.0%). An advantage of this model is that it uses applicable HEDIS goals as end metrics yet still allows the PCP to decide on patient-specific A1c goals.
This study showed a significant increase in the percentage of patients at A1c goal who were managed by a pharmacist at 3 and 6 months of follow-up, but the trend dissipated at 9 and 12 months of follow-up. A likely explanation for the lack of difference in the subsequent months is the unique structure of this model, in which patients were referred back to PCP care after the patients reached the A1c goal of < 8.0%. In this study, patients reached the A1c goal in an average time of 3.4 months. After this time point, the patients’ diabetes drug therapy was no longer managed by clinical pharmacists. This difference in care may explain the A1c outcomes at the later time points of 9 and 12 months, since a clinical pharmacist may not have managed these patients anymore. This practice poses an opportunity to examine methods in which long-term pharmacist monitoring and follow-up of patients with diabetes may be warranted to achieve continuous A1c control. In addition, the similar A1c goal rates at 9 and 12 months of follow-up may be attributed to the chronic and progressive nature of type 2 diabetes—the longer that patients are treated, the harder it may be to reach A1c goal due to worsening disease severity.
Previous studies have also looked at the effect of adding a pharmacist to the primary care team. A similar study by Ip et al. (2013) evaluated the care provided by an enhanced care group (with clinical pharmacist involvement) compared with PCP-only care: the mean A1c decreased from 9.5% to 6.9% in the enhanced care group versus 9.3% to 8.4% in the control group (P < 0.001).16 However, Ip et al. used a lower A1c goal of < 7.0% and assessed the overall mean A1c for all patients together rather than A1c mean change from baseline. These patients also had more severe comorbid conditions as demonstrated by the greater average (SD) CCI of 7.0 (1.4) for the enhanced group. The average (SD) CCI in our study is 1.62 (1.08; Table 1). The patients in the Ip et al. study were also continually followed by clinical pharmacists, unlike in our study in which patients were referred back to the PCP for additional follow-up and/or A1c reduction to a patient-specific goal. Our study provided a different workflow structure for pharmacists working in collaboration with PCPs, where the patient is managed to be at least meeting the HEDIS goal of < 8.0%. The PCP can further provide additional lowering of the A1c goal if warranted by an individual patient’s condition and disease progression.
Our study demonstrated a 0.95% to 1.19% mean reduction in A1c compared with usual care within the first 6 months. Other studies of pharmacist-based programs in other multidisciplinary health care settings have also seen a similar reduction in A1c from baseline with proactive pharmacist management; however, some of these studies had fewer patients and shorter follow-up time periods.23-27 In a study by Kelly and Rodgers (2000), 26 patients with type 2 diabetes and 6 patients with type 1 diabetes in a pharmacist-managed diabetes service started with a mean (SD) A1c of 9.0 (±1.3)%.28 After 7 months of follow-up, the pharmacist-managed group had a mean (SD) A1c of 7.5 (±1.2)%, which was statistically significant over the control group.28 As with the Ip et al. study, Kelly and Rodgers used the overall mean A1c for all patients combined, rather than mean change in A1c from baseline. In our study, A1c values fluctuated during the follow-up period, and there was no difference in the percentage of patients reaching goal in 12 months. However, this fluctuation and the lack of difference may demonstrate the chronic nature of diabetes and the difficulty that patients may face in controlling long-term A1c levels without consistent management and follow-up. Future research may focus on continued methods of follow-up with patients after they are referred back to the PCP in this model.
Our study also showed that a majority (65.0%) of pharmacist interventions occurred via telephone. Using telephone calls as a primary means of communication with patients may be increasingly necessary as the health care burden rises. Telephonic communication is more efficient and convenient for patients and health plans. Other integrated health systems are also developing ways to improve disease management for patients with diabetes, including the use of telephone calls, emails, and other forms of electronic communication.29-30 Using telephonic communication is not limited to diabetes management; several studies have examined pharmacist interactions by telephone in medication therapy management and other chronic diseases, such as hypertension, dyslipidemia, anticoagulation, and tobacco use.31-35
Limitations
This study has some limitations to consider. This study was retrospective, using data from 1 medical center, yet the use of a control group from the same geographic region helped to control for potential regional socioeconomic differences. It is possible that the results may have been affected by differential selection into UC group versus the CCP group; however, the use of propensity score matching may have helped to reduce such differences between the 2 groups. Within our organization, there is also the possibility of other interventions or strategies to improve outcomes for our population of patients with diabetes. Such carry-over strategies may have had an effect, especially on the UC group, that we were not able to control for in the analysis. We did not adjust for lifestyle factors, such as diet or exercise, and did not evaluate the type or dose of diabetes medications patients were taking during the study.
To isolate the effect of the CCP pharmacists, the date of the first CCP visit was used as the index date for the CCP group instead of the date of the first A1c result, which was used for the UC group. This could have potentially overestimated the time to goal for the UC group. However, with the EMR system, PCPs were rapidly informed of high A1c results, which may have prompted them to make therapy adjustments before the next PCP visit. Furthermore, a sensitivity analysis for the UC group using the first PCP visit date on or after the baseline A1c as the index date (instead of the date of the baseline A1c) resulted in similar outcomes. Patients in the CCP group still had a significantly lower mean time to A1c goal compared with the UC group (3.4 vs. 4.1 months, P = 0.001). In addition, multivariate results showed that the CCP group was still significantly more likely to reach A1c goal compared with the UC group (HR = 1.19, 95% CI = 1.05-1.36, P = 0.008).
In this real-world dataset, A1c lab results were not available for every patient at every follow-up time point. Thus, it was necessary to use the last observation carried forward method for missing follow-up points. As a result, the A1c fluctuation may have been too generalized and may have skewed the results toward finding no difference in A1c goal rates. However, there was no difference in the mean number of A1c lab results performed in the total 12 months of follow-up between the CCP (2.73 A1c results) and UC (2.63 A1c results) groups (Table 1).
Because the 2 groups were so different at baseline in important characteristics such as baseline A1c, race, obesity, and comorbidities, we performed all analyses on a matched group, which resulted in a loss of sample size and natural variation inherent in the 2 populations. The intent-to-treat population was not evaluated in order to only study patients with recent uncontrolled A1c values before enrollment into the CCP. However, we included all unadjusted results for the unmatched cohort to provide more complete information about the population (Table 1, Figure 2, Figure 3, and Table 2). In addition, we performed a post hoc multivariate analysis on the unmatched population (n = 5,171) and found that the CCP group was more likely to achieve A1c goal at 3 months compared with the UC group (OR = 1.85, 95% CI = 1.56-2.18, P < 0.0001). There were no other significant differences between the 2 groups at other time points.
Conclusions
This study provides a real-world example of pharmacists with provider status and demonstrates that in some settings, it may be beneficial for pharmacists to have increased scope of practice. Drug therapy management by clinical pharmacists was associated with a greater percentage of patients achieving the HEDIS A1c goal of < 8.0%, reaching the A1c goal faster, and a greater reduction in A1c from baseline compared with patients receiving usual care at 3 and 6 months of follow-up. While there was no statistically significant difference in these outcomes between the 2 groups at 9 and 12 months of follow-up, this lack of significance may be attributed to various limitations, including the study design, which discharged patients back to the care of their PCPs after reaching the A1c goal.
This study also provides a framework for collaboration between pharmacists and medical teams for the provision of chronic disease care and potentially could be considered in other practice settings within an integrated health care system due to the significant and quick effect of pharmacist intervention on A1c reduction at the start of drug therapy management. Future research should be conducted to explore the effect of pharmacists as health care providers and to evaluate the economic effect of a pharmacist-managed program with a team-based approach within an integrated system.
ACKNOWLEDGMENTS
The authors thank the providers, pharmacists, staff, and patients of the Kaiser Permanente Downey Medical Center Complete Care Program. The authors also thank Mirta Millares, PharmD, FCSHP, FASHP; the Kaiser Permanente Drug Information Services; and the Pharmacy Outcomes Research Group for their support. Special thanks go to Fang Niu, MS, for statistical advice.
APPENDIX A. Definitions of Outcomes and Inclusion/Exclusion Criteria
| Outcome | Definition |
|---|---|
| Baseline A1c (based on HEDIS measures) | < 8.0% is at goal for most patients ≥ 8.0% is not at goal |
| Blood pressure (based on HEDIS measures) | SBP < 140 and < 90 mmHg is at goal (controlled) SBP ≥ 140 or DBP ≥ 90 mmHg is not at goal (uncontrolled) |
| Inclusion or Exclusion Criteria | ICD-9-CM codes |
| Type 2 diabetes | 250.xx (except 250.x1 or 250.x3) |
| Age | Patient’s age as of the index date |
| Hospice care or skilled nursing facility | From utilization database |
| CKD 4, 5, dialysis, or GFR < 30 mL/min/1.73m2 | 585.4 585.5 585.6 V45.11 GFR calculated from lab values in electronic medical record |
| Organ transplant (except cornea) | V42.xx (except V42.5) |
| HIV/AIDS | 042 |
| Pregnancy | V22.xx V23.xx V61.6 V61.7 V72.42 633.xx 650.xx 651.xx |
| Polycystic ovary syndrome | 256.4 |
| Cancer (except benign, basal cell, squamous cell, in situ, undefined, or unknown carcinomas) | 140.xx-149.xx 150.xx-159.xx 160.xx-169.xx 170.xx 171.xx 172.xx 173.xx (except 173.x1, 173.x2, 173.x9) 174.xx 175.xx 176.xx 179.xx 180.xx-189.xx 190.xx-199.xx 190.xx-199.xx 200.xx-209.xx |
| Drug abuse or alcoholism (except in remission) | 303.xx (except 303.x3) 304.xx (except 304.x3) 305.xx (except 305.x3) |
| Cognitive deficits: Alzheimer’s disease or dementia | 290.xx 294.xx 331.xx |
A1c = hemoglobin A1c; AIDS = acquired immune deficiency syndrome; CKD = chronic kidney disease; DBP = diastolic blood pressure; GFR = glomerular filtration rate; HEDIS = Healthcare Effectiveness Data and Information Set; HIV = human immunodeficiency virus; ICD-9-CM = International Classification of Diseases, Ninth Revision, Clinical Modification; SBP = systolic blood pressure.
APPENDIX B. Definitions of Covariates/Control Variables
| Covariates (12 Months Before Index Date) | Definition or ICD-9-CM Code |
|---|---|
| Ethnicity - as defined in electronic health record | White Black Hispanic Asian = Asian/Pacific Islander, Native Hawaiian/other Pacific Islander Other = Native American, other, decline to state, unknown |
| Body mass index | (weight in kg)/(height in meters)2 < 18.5 kg/m2 is underweight 18.5-24.9 kg/m2 is normal weight 25-29.9 kg/m2 is overweight or obese ≥ 30 kg/m2 is obesity |
| Charlson Comorbidity Index score | Sum of scores used to predict the 10-year mortality for a patient: • 1 score each: myocardial infarction, congestive heart failure, peripheral vascular disease, dementia, cerebrovascular disease, chronic lung disease, connective tissue disease, ulcer, chronic liver disease, diabetes • 2 scores each: hemiplegia, moderate or severe kidney disease, diabetes with end organ damage, tumor, leukemia, lymphoma • 3 scores each: moderate or severe liver disease • 6 scores each: malignant tumor, metastasis, AIDS |
| Hypertension | 401.xx 402.xx 403.xx 404.xx 405.xx |
| Dyslipidemia | 272.xx |
| Retinopathy | 362.0 362.10-362.12 362.20 362.22-362.27 363.31 |
| Neuropathy | 337.00 337.09 337.1 356.0 356.2 356.4 356.8 356.9 377.33 377.34 377.41 |
| Proteinuria | One lab result for microalbumin-random ≥ 30 mcg/mg within 12 months before index date |
| Ischemic and other forms of heart disease, including myocardial infarction and heart failure | 410.xx-414.xx 420.xx-429.xx |
| Cerebrovascular disease, including stroke | 430.xx-438.xx |
| Smoking status | 305.1 V15.82 |
AIDS = acquired immune deficiency syndrome; ICD-9-CM = International Classification of Diseases, Ninth Revision, Clinical Modification.
REFERENCES
- 1.International Diabetes Federation . IDF Diabetes Atlas. 8th ed. Brussels, Belgium: International Diabetes Federation; 2017. Available at: http://www.idf.org/diabetesatlas. Accessed December 20, 2017. [Google Scholar]
- 2.Pousinho S, Morgado M, Falcao A, et al. Pharmacist interventions in the management of type 2 diabetes mellitus: a systematic review of randomized controlled trials. J Manag Care Spec Pharm. 2016;22(5):493-515. Available at: http://www.jmcp.org/doi/10.18553/jmcp.2016.22.5.493. [DOI] [PMC free article] [PubMed] [Google Scholar]
- 3.Wu Y, Ding Y, Tanaka Y, et al. Risk factors contributing to type 2 diabetes and recent advances in the treatment and prevention. Int J Med Sci. 2014;11(11):1185-200. [DOI] [PMC free article] [PubMed] [Google Scholar]
- 4.Huang ES, Brown SE, Ewigman BG, et al. Patient perceptions of quality of life with diabetes-related complications and treatments. Diabetes Care. 2007;30(10):2478-83. [DOI] [PMC free article] [PubMed] [Google Scholar]
- 5.Ko J, Lu J, Rascati K, et al. Analysis of glycemic control of a pharmacist-led medication management program in patients with type 2 diabetes. J Manag Care Spec Pharm. 2016;22(1):32-37. Available at: http://www.jmcp.org/doi/10.18553/jmcp.2016.22.1.32. [DOI] [PMC free article] [PubMed] [Google Scholar]
- 6.Dall TM, Zhang Y, Chen YJ, et al. The economic burden of diabetes. Health Aff (Millwood). 2010;29(2):297-303. [DOI] [PubMed] [Google Scholar]
- 7.Charpentier G, Genes N, Vaur L, et al. Control of diabetes and cardiovascular risk factors in patients with type 2 diabetes: a nationwide French survey. Diabetes Metab. 2003;29(2 Pt 1):152-58. [DOI] [PubMed] [Google Scholar]
- 8.Eliasson B, Cederholm J, Nilsson P, Gudbjornsdottir S; Steering Committee of the Swedish National Diabetes Register. The gap between guidelines and reality: type 2 diabetes in a national diabetes register 1996-2003. Diabet Med. 2005;22(10):1420-26. [DOI] [PubMed] [Google Scholar]
- 9.Debussche X. Is adherence a relevant issue in the self-management education of diabetes? A mixed narrative review. Diabetes Metab Syndr Obes. 2014;7:357-67. [DOI] [PMC free article] [PubMed] [Google Scholar]
- 10.Nam S, Chesla C, Stotts NA, et al. Barriers to diabetes management: patient and provider factors. Diabetes Res Clin Pract. 2011;93(1):1-9. [DOI] [PubMed] [Google Scholar]
- 11.Vermeire E, Hearnshaw H, Van Royen P, et al. Patient adherence to treatment: three decades of research. A comprehensive review. J Clin Pharm Ther. 2001;26(5):331-42. [DOI] [PubMed] [Google Scholar]
- 12.Nowak SN, Singh R, Clarke A, et al. Metabolic control and adherence to American Diabetes Association practice guidelines in a pharmacist-managed diabetes clinic. Diabetes Care. 2002;25(8):1479. [DOI] [PubMed] [Google Scholar]
- 13.Stading J, Herrmann J, Walters R, et al. Impact of pharmacist intervention on diabetes patients in an ambulatory setting. Diabetes Spectr. 2009;22(4):241-46. [Google Scholar]
- 14.Rogers EA, Hessler D, Dube K, et al. The Panel Management Questionnaire: a tool to measure panel management capability. Perm J. 2015;19(2):4-9. [DOI] [PMC free article] [PubMed] [Google Scholar]
- 15.McAdam-Marx C, Dahal A, Jennings B, et al. The effect of a diabetes collaborative care management program on clinical and economic outcomes in patients with type 2 diabetes. J Manag Care Spec Pharm. 2015;21(6):452-68. Available at: http://www.jmcp.org/doi/10.18553/jmcp.2015.21.6.452. [DOI] [PMC free article] [PubMed] [Google Scholar]
- 16.Ip EJ, Shah BM, Yu J, et al. Enhancing diabetes care by adding a pharmacist to the primary care team. Am J Health Syst Pharm. 2013;70(10):877-86. [DOI] [PubMed] [Google Scholar]
- 17.Spence MM, Makarem AF, Reyes SL, et al. Evaluation of an outpatient pharmacy clinical services program on adherence and clinical outcomes among patients with diabetes and/or coronary artery disease. J Manag Care Spec Pharm. 2014;20(10):1036-45. Available at: http://www.jmcp.org/doi/10.18553/jmcp.2014.20.10.1036. [DOI] [PMC free article] [PubMed] [Google Scholar]
- 18.Rothman R, Malone R, Bryant B, et al. Pharmacist-led, primary care-based disease management improves hemoglobin A1c in high-risk patients with diabetes. Am J Med Qual. 2003;18(2):51-58. [DOI] [PubMed] [Google Scholar]
- 19.American Diabetes Association . 1. Strategies for improving care. Diabetes Care. 2016;39(Suppl 1):S6-12. [DOI] [PubMed] [Google Scholar]
- 20.National Committee for Quality Assurance. HEDIS and Quality Compass . Available at: http://www.ncqa.org/hedis-quality-measurement/what-is-hedis. Accessed December 14, 2017.
- 21.National Committee for Quality Assurance . Comprehensive Diabetes Care. Healthcare Effectiveness Data and Information Set (HEDIS) 2015. Technical specifications for health plan, vol 2. 2014. Available at: http://www.ncqa.org/hedis-quality-measurement/hedis-measures/hedis-2015. Accessed December 14, 2017. [Google Scholar]
- 22.Charlson ME, Pompei P, Ales KL, et al. A new method of classifying prognostic comorbidity in longitudinal studies: development and validation. J Chronic Dis. 1987;40(5):373-83. [DOI] [PubMed] [Google Scholar]
- 23.Coast-Senior EA, Kroner BA, Kelley CL, Trilli LE. Management of patients with type 2 diabetes by pharmacists in primary care clinics. Ann Pharmacother. 1998;32(6):636-40. [DOI] [PubMed] [Google Scholar]
- 24.Leal S, Glover JJ, Herrier RN, et al. Improving quality of care in diabetes through a comprehensive pharmacist-based disease management program. Diabetes Care. 2004;27(12):2983-84. [DOI] [PubMed] [Google Scholar]
- 25.Choe HM, Mitrovich S, Dubay D, et al. Proactive case management of high-risk patients with type 2 diabetes mellitus by a clinical pharmacist: a randomized controlled trial. Am J Manag Care. 2005;11(4):253-60. [PubMed] [Google Scholar]
- 26.McCord AD. Clinical impact of a pharmacist-managed diabetes mellitus drug therapy management service. Pharmacotherapy. 2006;26(2):248-53. [DOI] [PubMed] [Google Scholar]
- 27.Kiel PJ, McCord AD. Pharmacist impact on clinical outcomes in a diabetes disease management program via collaborative practice. Ann Pharmacother. 2005;39(11):1828-32. [DOI] [PubMed] [Google Scholar]
- 28.Kelly C, Rodgers PT. Implementation and evaluation of a pharmacist-managed diabetes service. J Manag Care Pharm. 2000;6(6):488-93. Available at: http://www.jmcp.org/doi/abs/10.18553/jmcp.2000.6.6.488. [Google Scholar]
- 29.Wu L, Forbes A, Griffiths P, et al. Telephone follow-up to improve glycaemic control in patients with type 2 diabetes: systematic review and meta-analysis of controlled trials. Diabet Med. 2010;27(11):1217-25. [DOI] [PubMed] [Google Scholar]
- 30.Piette JD, Kerr E, Richardson C, et al. Veterans Affairs research on health information technologies for diabetes self-management support. J Diabetes Sci Technol. 2008;2(1):15-23. [DOI] [PMC free article] [PubMed] [Google Scholar]
- 31.Simpson SH, Majumdar SR, Tsuyuki RT, et al. Effect of adding pharmacists to primary care teams on blood pressure control in patients with type 2 diabetes: a randomized controlled trial. Diabetes Care. 2011;34(1):20-26. [DOI] [PMC free article] [PubMed] [Google Scholar]
- 32.Moczygemba LR, Barner JC, Brown CM, et al. Patient satisfaction with a pharmacist-provided telephone medication therapy management program. Res Social Adm Pharm. 2010;6(2):143-54. [DOI] [PubMed] [Google Scholar]
- 33.Philip A, Green M, Hoffman T, et al. Expansion of clinical pharmacy through increased use of outpatient pharmacists for anticoagulation services. Am J Health Syst Pharm. 2015;72(7):568-72. [DOI] [PubMed] [Google Scholar]
- 34.Dolder NM, Dolder CR. Comparison of a pharmacist-managed lipid clinic: in-person versus telephone. J Am Pharm Assoc. 2010;50(3):375-78. [DOI] [PubMed] [Google Scholar]
- 35.Chen T, Kazerooni R, Vannort EM, et al. Comparison of an intensive pharmacist-managed telephone clinic with standard of care for tobacco cessation in a veteran population. Health Promot Pract. 2014;15(4):512-20. [DOI] [PubMed] [Google Scholar]