

Abstract
SUMMARY: Over the past decade, the Department of Veterans Affairs (VA) Pharmacy Benefits Management Services (PBM) has enhanced its formulary management activities and added programs to ensure that the national drug plan continues to meet the pharmacy needs of veterans and to promote safe and appropriate drug therapy in the face of rising medication expenditures. This article describes the broad range of services provided by the VA PBM that work in partnership to deliver a high-quality and sustainable pharmacy benefit for veterans.
In support of formulary management, VA PBM pharmacists prepare extensive clinical guidance documents (e.g., drug monographs and criteria for use) that are used by physicians and pharmacists with operational and clinical oversight of the VA national formulary. The VA PBM has utilized various contracting techniques and continually evaluates drug utilization data to identify opportunities for potential savings. Remarkably, since before 2004, the average acquisition cost for a 1-month supply of medication has remained fairly stable at approximately $13-$15.
Two new VA PBM programs are the VA Center for Medication Safety (VA MedSAFE) and the Clinical Pharmacy Practice Office (CPPO). VA MedSAFE is a comprehensive pharmacovigilance program focused on the detection, assessment, and prevention of adverse drug events, and CPPO is dedicated to improving safe and appropriate medication use by supporting and expanding clinical pharmacy practice. Moving forward, the VA PBM will consider new initiatives to stay at the forefront of providing quality care while maintaining economic viability.
The Department of Veterans Affairs (VA) Pharmacy Benefits Management Services (PBM) oversees the national drug plan for the more than 9.1 million veterans enrolled in the VA health care system and provided almost 144 million prescriptions in fiscal year (FY) 2014 (Table 1). Over time, the VA PBM has expanded its services and refined its programs to promote safe and appropriate drug therapy and to ensure that the national drug plan continues to meet the pharmacy needs of veterans in the face of rising medication expenditures.1 This article describes the comprehensive services provided by the VA PBM that work together to achieve a high-quality and sustainable pharmacy benefit for veterans, including programs focused on consolidated mail outpatient pharmacies (CMOP) and professional pharmacy practice, as well as the multiple and diverse aspects of formulary management.
TABLE 1.
General Pharmacy Utilization and Patient Demographics: FY 2004-FY 2014a
| Characteristic | FY 2004 | FY 2005 | FY 2006 | FY 2007 | FY 2008 | |
| Total enrolleesb | 7,331,138 | 7,655,563 | 7,872,439 | 7,833,446 | 7,834,764 | |
| Total pharmacy unique patientsc | 4,189,938 | 4,303,025 | 4,386,081 | 4,414,599 | 4,438,696 | |
| Change per FY,d % | 4.3 | 2.7 | 1.9 | 0.7 | 0.5 | |
| Enrollees using drug benefit,e % | 57.2 | 56.2 | 55.7 | 56.4 | 56.7 | |
| Total actual prescription volumef | 115,904,290 | 118,662,153 | 120,271,394 | 122,086,665 | 125,881,700 | |
| Change per FY,d % | 7.0 | 2.4 | 1.4 | 1.5 | 3.1 | |
| 30-day equivalent prescription volume | 219,423,992 | 231,108,406 | 237,325,278 | 239,515,525 | 244,515,292 | |
| Average prescriptions per pharmacy unique patientg | 27.66 | 27.58 | 27.42 | 27.66 | 28.36 | |
| Average cost per actual prescription, $ | 27.99 | 28.80 | 28.60 | 27.14 | 24.43 | |
| Average cost per pharmacy unique patient per month,h $ | 64.53 | 66.19 | 65.36 | 62.54 | 57.75 | |
| Patient age,i % | ||||||
| < 65 years | 22.4 | 23.9 | 25.0 | 26.8 | 28.7 | |
| ≥ 65 years | 77.6 | 76.0 | 74.2 | 71.6 | 68.7 | |
| Unknown | 0.01 | 0.07 | 0.8 | 1.7 | 2.6 | |
| Patient sex, % | ||||||
| Male | 94.5 | 94.3 | 93.4 | 92.5 | 91.4 | |
| Female | 5.5 | 5.6 | 5.7 | 5.9 | 6.0 | |
| Unknown | 0.0 | 0.06 | 0.8 | 1.7 | 2.6 | |
| Characteristic | FY 2009 | FY 2010 | FY 2011 | FY 2012 | FY 2013 | FY 2014 |
| Total enrolleesb | 8,061,251 | 8,342,674 | 8,574,198 | 8,763,174 | 8,926,610 | 9,093,511 |
| Total pharmacy unique patientsc | 4,527,364 | 4,661,286 | 4,741,240 | 4,787,090 | 4,827,423 | 4,897,647 |
| Change per FY,d % | 2.0 | 3.0 | 1.7 | 1.0 | 0.8 | 1.5 |
| Enrollees using drug benefit,e % | 56.2 | 55.9 | 55.3 | 54.6 | 54.1 | 53.9 |
| Total actual prescription volumef | 130,355,846 | 136,035,517 | 139,371,064 | 141,534,858 | 142,986,291 | 143,939,344 |
| Change per FY,d % | 3.6 | 4.4 | 2.5 | 1.6 | 1.0 | 0.7 |
| 30-day equivalent prescription volume | 249,753,009 | 258,008,955 | 262,965,215 | 266,157,743 | 268,636,067 | 271,409,571 |
| Average prescriptions per pharmacy unique patientg | 28.79 | 29.18 | 29.40 | 29.57 | 29.62 | 29.39 |
| Average cost per actual prescription, $ | 24.21 | 24.14 | 24.12 | 24.47 | 23.18 | 25.72 |
| Average cost per pharmacy unique patient per month,h $ | 58.10 | 58.72 | 59.08 | 60.29 | 57.22 | 62.99 |
| Patient age,i % | ||||||
| < 65 years | 31.0 | 32.9 | 34.5 | 35.5 | 36.7 | 37.6 |
| ≥ 65 years | 65.3 | 62.0 | 58.9 | 55.7 | 52.5 | 49.1 |
| Unknown | 3.7 | 5.2 | 7.0 | 8.8 | 10.8 | 13.3 |
| Patient sex, % | ||||||
| Male | 90.1 | 88.5 | 86.6 | 84.8 | 82.7 | 80.2 |
| Female | 6.2 | 6.3 | 6.4 | 6.4 | 6.5 | 6.6 |
| Unknown | 3.7 | 5.2 | 7.0 | 8.8 | 10.8 | 13.3 |
aPharmacy utilization information is from the VA Pharmacy Benefits Management Services prescription database, version 3.0, FY 2004-FY 2014, Hines, Illinois.
bNumber eligible, which includes all veterans enrolled for health care benefits, not just pharmacy benefits.
cAny enrolled veteran who is a user of the pharmacy benefit, defined as receiving at least 1 prescription within the system.
dPercentage of change calculated using previous year’s data.
ePercentage of eligible using the drug benefit, calculated by dividing total pharmacy unique patients by total enrollees and multiplying by 100.
fActual prescriptions include those for 30-, 60-, and 90-day supplies.
gCalculated by dividing total actual prescription volume by total pharmacy unique patients.
hThe product of average cost per actual prescription and actual prescriptions per pharmacy unique patient. This product is divided by 12 to give the average cost per pharmacy unique patient per month.
iAge calculations were based on the difference between June 1, 2015, and the patient’s date of birth.
FY = fiscal year; VA = Veterans Affairs.
VA PBM Formulary Management
VA PBM formulary management involves a team of physicians and pharmacists whose functions include maintaining a national drug formulary, which ensures that veterans have access to the same drugs nationwide, and promoting, optimizing, and assisting VA practitioners with the safe and appropriate use of medications. Formulary management depends on the following programs: clinical guidance, contracting/pharmacoeconomics/pharmacy efficiency, pharmaceutical prime vendor, pharmacy data domains and reporting and analytics, and medication safety.
In 2009, all regional formularies were abolished, and a single VA national formulary was established.2 Within the VA PBM, 2 groups provide operational and clinical oversight for the national formulary: (1) the Medical Advisory Panel (MAP), which is composed of practicing VA physicians representing various specialties, clinical pharmacy program managers, and a Veterans Integrated Service Network (VISN) pharmacist executive (VPE), and (2) the VPE group, which includes the VPE from each of the VA’s 21 regional networks (which will decrease to 18 over the next 2 years) and a representative from the MAP, VA National Center for Patient Safety, Department of Defense, and Indian Health Services. These groups meet individually on a monthly basis and together each quarter to consider items such as the addition of medications to the national formulary and criteria for use (CFU). These meetings also include consideration of the efficacy and safety of drugs, their relevance to the VA population, other available therapies, and cost.3
Currently, the VA utilizes a 2-tier system that designates drugs as formulary or nonformulary. Within those categories, CFU are often developed that guide appropriate use. Nonformulary medications, with and without CFU, can be prescribed through the nonformulary request process. Typically, this occurs at the local level using similar procedures across facilities. Hence, the term “nonformulary” does not mean that a drug is unavailable through the VA; it simply means that additional information is required for the drug to be dispensed. A small group of medications require prior authorization at the VISN (regional) or national level; all of these medications are included in the VA formulary.
Clinical Guidance
Clinical pharmacy program managers are national VA PBM pharmacists who primarily collaborate with multidisciplinary groups and subject matter experts to develop policies for medication use. The guidance documents they prepare include drug monographs for new molecular entities, CFU, drug class reviews, and clinical practice guidelines (for examples visit www.pbm.va.gov). When creating these documents, clinical pharmacy program managers consider the efficacy and safety of the medication based on available evidence (and in populations similar to the VA if data exist), review the prevalence of the disease state treated by the medication, evaluate VA use of related drugs, and assess possible drug-drug and drug-disease interactions. The potential effect on the pharmacy budget may be determined by identifying possible candidates for treatment using VA databases and modeling various levels of uptake and cost offsets. Documents are circulated nationally to VA providers for comment and review before they are finalized by the MAP and VPE groups.
Contracting/Pharmacoeconomics/Pharmacy Efficiency
Clinical drug guidance may lead to competitive solicitation and standardized contracting nationally; regional networks do not negotiate separate contracts. The VA PBM has utilized various contracting techniques to help maintain its drug benefit at a relatively low cost. When it is determined that there is therapeutic equipoise among related drugs, the VA PBM may negotiate for preferred products within that drug class. Before statins went generic, the VA achieved significant cost savings with contracts for preferred statins, supported by market share agreements. Although drug expenditures continue to rise, the average acquisition cost for a 1-month supply of medication has remained fairly stable for the past 10 years (Figure 1) and as far back as 1998.1,3 The recent increase can be largely attributed to the provision of new direct-acting antivirals for hepatitis C (Figure 1). Considering all contracting types, the VA cost avoided almost $32 billion dollars in FY 2004-FY 2014. Contracts for insulin, inhaled corticosteroids/long-acting beta-agonists, and phosphodiesterase-5 inhibitors accounted for sizeable cost avoidances in FY 2014.
FIGURE 1.
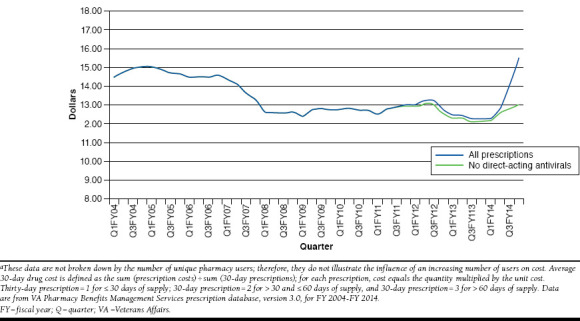
Average Acquisition Cost Per 30-Day Equivalent Prescriptions from FY 2004 to FY 2014a
Since 2014, a pharmacoeconomics program manager provides cost analyses for new drugs and contract pricing, periodic reports on high-cost drugs, and follow-up on formulary decisions. While the VA PBM does not routinely include formal cost-effectiveness analyses (CEAs) in its formulary decisions, budget impact models and occasionally CEAs are provided as part of the deliberation process. In addition to the more traditional cost analyses, the VA PBM evaluates potential savings on an ongoing basis through the National Pharmacy Efficiency Program Savings Opportunity Workgroup. This workgroup leverages drug utilization data and benchmarking to identify opportunities for cost savings where quality of patient care is not compromised. For example, over 99% of patients requiring a proton pump inhibitor are prescribed a generic product. The work of this group has helped the VA PBM to maintain low costs for pharmaceuticals. For example, the group tracks high-use items that experience significant price increases and then identifies medications in the same class with similar efficacy and safety at a lower cost. When the primary pancreatic enzyme product significantly increased its pricing to the VA, the VA PBM developed a voluntary initiative to encourage sites to convert to a lower cost option. Monthly reports track changes in use and identify cost avoidance and lost opportunity cost.
Pharmaceutical Prime Vendor
The Pharmaceutical Prime Vendor program orchestrates the procurement and distribution of pharmaceuticals within the VA using a single wholesaler and complements the contracting process by ensuring drug accountability and compliance with prices. The system allows for comparative drug pricing to determine the most economical source; more responsive procurement and faster delivery to ensure less out-of-stock items; lower total acquisition cost based on specified product volume; and a reduction in drug storage space, decreasing inventory carrying costs.5
Pharmacy Data Domains and Reporting and Analytics
Staff from the Pharmacy Data Domains section maintains the PBM data warehouse that provides near real-time medication dispensing elements in aggregate and on provider and patient levels. Maintenance of the database occurs daily, with over 12 million records loaded per month. Prescription data are assessed and translated into a secondary (tier 2) format that includes data cubes, which are browsed using commercial software. These data are available to pharmacy managers at all levels to support formulary management, ascertain variations in prescribing practices, and identify opportunities to improve prescribing. For example, pharmacy managers may compare their use of medications for a particular disease state with other similar facilities and find potential cost savings. Also, medication safety issues are routinely assessed (e.g., inappropriate dosing or drug combinations).
VA Center for Medication Safety
VA Center for Medication Safety (VA MedSAFE) is a comprehensive pharmacovigilance program within the VA PBM, and its main goals are to track and evaluate the use of high-risk medications, new molecular entities, and older medications with newly identified safety signals, as well as to determine rates of adverse drug events (ADEs). These goals are accomplished through active and passive surveillance of ADEs, national medication use evaluations, risk reduction efforts, medication safety communications, and research.
Pharmacovigilance. As part of its active surveillance program, VA MedSAFE often employs rapid cycle analyses (e.g., using databases to quickly evaluate the rate and risk of ADEs for specific medications) to assess potential medication safety signals.6 If a problem is identified, then a risk reduction project is implemented to improve the safe use of the medication. Some examples of rapid cycle analyses include varenicline and neuropsychiatric events, proton pump inhibitors and fracture, and direct oral anticoagulants and major bleeding. In addition, VA MedSAFE works closely with the U.S. Food and Drug Administration and the Centers for Disease Control and Prevention to monitor, evaluate, and communicate medication and vaccine safety issues.
VA Adverse Drug Event Reporting. VA MedSAFE uses a web-based VA Adverse Drug Event Reporting System (VA ADERS), which contains detailed information on observed ADEs, as part of its passive surveillance program.7 This unique, national database allows for rapid assessment of emerging drug safety issues.8 In addition, VA ADERS is used for benchmarking reportable ADEs, assessing preventable ADEs, and generating information such as the number of ADEs reported for new drugs. From inception in 2006 through 2015, over 500,000 ADE reports were entered in VA ADERs. Examples of the most common ADEs are lisinopril and cough, atorvastatin and myalgias, and metformin and diarrhea.
National Medication Use Evaluations. VA MedSAFE conducts national medication use evaluations (MUEs) to assess the safe and appropriate use of drugs across the country. Based on the findings, processes for improving the use of the medication are developed, and targeted education is provided. For a recent MUE on the duration of antibiotic therapy for inpatient pneumonia, a “Field Guidance Package to Optimize the Duration of Antimicrobial Therapy” was developed, which provides a tool for assessing appropriate duration of therapy and a process for recommending a shorter course when indicated.
Risk Reduction Projects and Medication Use Evaluation Tracker. Risk reduction projects and the Medication Use Evaluation Tracker (MUET) are methods implemented at the patient level to encourage safe prescribing and monitoring of medications. MUET is a web-based application that provides VA medical centers with secured lists of target patients that meet pre-set criteria for intervention and enables the interventions to be “reported back” into a centralized database.9 As examples, use of MUET improved prescribing of erythropoiesis-stimulating agents and enhanced compliance with the direct oral anticoagulant CFU. Risk reduction projects employ a variety of methods to improve medication use. For example, the number of patients receiving more than 10 mg of zolpidem decreased by 79% between the second quarter of FY 2007 and first quarter of FY 2009 after providers were contacted.
Medication Safety Communications. VA MedSAFE publishes the National PBM Bulletin, Patient Level Recall Communications (www.pbm.va.gov/PBM/vacenterformedicationsafety/vacenterformedicationsafetybulletinsandnewsalerts.asp), and an electronic newsletter entitled “Medication Safety in Seconds” to provide medication safety information to clinicians in the field. Recent National PBM Bulletins addressed idelalisib safety and posaconazole dosing errors.
Research. VA MedSAFE occasionally expands rapid cycle analyses into formal research projects to evaluate outcomes of VA PBM initiatives or more carefully examine potential associations between medications and adverse events. For example, VA MedSAFE evaluated the effect of a risk reduction project to decrease glyburide use in elderly outpatients with renal insufficiency.10 Glyburide was discontinued in more than 70% of these veterans without compromising glucose control (mean glycated hemoglobin 7.2%).10
Consolidated Mail Outpatient Pharmacies
Consolidated mail outpatient pharmacies (CMOPs) allow centralized filling and distribution of veterans’ prescriptions at 7 highly automated facilities across the nation. In FY 2014, the VA filled almost 144 million prescriptions, with 85% by mail order and the remaining 15% by local facility pharmacies. There is also a CMOP specialty pharmacy that provides many expensive and difficult-to-obtain medications (e.g., enzalutamide and dalfampridine) and certain medications with a REMS (RISK Evaluation and Mitigation) requirement. Increased use of CMOPs allows pharmacists at local medical centers to spend more time in direct care of veterans. VA mail order pharmacies received the highest score for the past 6 years from J.D. Power and Associates for cost competitiveness, prescription delivery, ordering, and customer service.11-15
Professional Pharmacy Practice Programs
The professional pharmacy practice programs within the VA PBM work to promote and expand the role of pharmacists in the safe and appropriate use of medications outside of direct formulary management. These programs include clinical pharmacy practice, pharmacy residency training, academic detailing, and antimicrobial stewardship.
Clinical Pharmacy Practice Office
The Clinical Pharmacy Practice Office (CPPO) was created in 2010 to further strengthen clinical pharmacy practice in the VA. CPPO has employed a multidimensional approach consisting of education/training, policy and guidance deployment, and data reporting and analysis to support and expand clinical pharmacy practice. As of FY 2014, approximately 40% of the over 7,700 clinical pharmacists in the VA have an advanced practice role with a scope of practice that includes prescriptive authority. These pharmacists work in over 25 different areas with the highest concentrations in primary care and anticoagulation. Focused efforts by the CPPO have resulted in tremendous growth in clinical pharmacists working in targeted gap areas of hepatitis C, mental health, and antimicrobial stewardship. For example, over 120 pharmacists with a scope of practice in hepatitis C provided direct patient care and prescribed 18% of all hepatitis C prescriptions in FY 2014.
National Pharmacy Residency Program Office
The National Pharmacy Residency Program Office (PRPO) offers national support for the growth of VA pharmacy residency programs and provides expert guidance for accreditation purposes, preceptor development, and resident education. The VA has the largest postdoctorate pharmacy training program in the country with over 600 pharmacy residents annually, and all programs are accredited by the American Society of Health-System Pharmacists.
Academic Detailing Program
As a result of a VA academic detailing pilot that improved prescribing of psychopharmacotherapy in mental health, academic detailing programs have been implemented, or are in progress, across the VA. Thus far, initiatives have primarily focused on psychotropic drug safety and pain management. In conjunction with other efforts to improve opioid safety, some early results of academic detailing include a 3.4% decrease in opioid use in one VISN, and an almost 2% decrease in concomitant opioid and benzodiazepine prescribing in another over the last three quarters (Academic Detailing Workload Report, released February 2016. Data on file with Melissa Christopher, PharmD, National Director, VA PBM Academic Detailing Service.). The National Academic Detailing Program Office provides data to support initiatives, training in academic detailing, guidance for local programs, educational materials, and methods to track progress.16
Antimicrobial Stewardship
The National Antimicrobial Stewardship Task Force (ASTF) assists VA facilities in the development and expansion of antimicrobial stewardship activities (i.e., programs that promote appropriate antibiotic selection, dosing, and duration of therapy).17 The ASTF is co-chaired by a pharmacist from the VA PBM and a physician from the National Infectious Diseases Service. VA medical centers are provided a variety of tools, including examples of policies and order sets, as well as a monthly educational teleconference series. While hard outcomes with antimicrobial stewardship are challenging (e.g., resistance rates), ASTF has documented decreases in antimicrobial use on a global level (manuscript in preparation).
Conclusions
The VA PBM is a robust, comprehensive program with many unique features that fall outside of traditional formulary management. These diverse aspects have augmented the safe and appropriate use of medications by veterans, with a secondary outcome of controlling pharmacy expenditures. With a unified formulary and extensive databases, the VA PBM can easily track medication use and contact patients and providers when there is an important safety issue. Through its national pharmacovigilance program, ADEs are identified and evaluated, and when necessary, projects are initiated to improve medication prescribing and prevent future harmful events. Finally, more pharmacists are directly involved in medication therapy management, academic detailing, and antimicrobial stewardship, all of which support appropriate drug therapy. Together, VA PBM programs create a first-class and sustainable pharmacy benefit for veterans.
ACKNOWLEDGMENTS
The authors acknowledge the support of Matthew Lechtenberg, John Lowe, and Anthony Morreale with the VA PBM, for contributing information to the article, and Joseph Canzolino and Jennifer Zacher, also with the VA PBM, for their critical review of the manuscript.
References
- 1.Sales MM, Cunningham FE, Glassman PA, Valentino MA, Good CB. Pharmacy benefits management in the Veterans Health Administration: 1995-2003. Am J Manag Care. 2005;11(2):104-12. [PubMed] [Google Scholar]
- 2.Thompson CA. One formulary fits all of VA. Am J Health Syst Pharm. 2009;66(11):972-73. [DOI] [PubMed] [Google Scholar]
- 3.Good CB, Valentino MA. Access to affordable medications: the Department of Veterans Affairs pharmacy plan as a national model. Am J Public Health. 2007;97(12):2129-31. [DOI] [PMC free article] [PubMed] [Google Scholar]
- 4.Koons C, Chen C. Merck targets toughest cases to gain hepatitis C foothold. Bloomberg Business. July 28, 2015. Available at: http://www.bloomberg.com/news/articles/2015-07-28/merck-targets-toughest-cases-forfoothold-in-hepatitis-c-market. Accessed July 26, 2016.
- 5.Patterson AA, Pierce RA, Powell AP. Prime vendor purchasing of pharmaceuticals in the Veterans Affairs health care system. Am J Health Syst Pharm. 1995;52(17):1886-89. [DOI] [PubMed] [Google Scholar]
- 6.Gibbons RD, Segawa E, Karabatsos G, et al. Mixed-effects Poisson regression analysis of adverse event reports: the relationship between antidepressants and suicide. Statist Med. 2008;27(11):1814-33. [DOI] [PMC free article] [PubMed] [Google Scholar]
- 7.Emmendorfer T, Glassman PA, Moore V, Leadholm TC, Good CB, Cunningham F. Monitoring adverse drug reactions across a nationwide health care system using information technology. Am J Health Syst Pharm. 2012;69(4):321-28. [DOI] [PubMed] [Google Scholar]
- 8.Institute of Medicine. Appendix B. A CEO checklist for high-value health care. In: Best Care at Lower Cost: The Path to Continuously Learning Health Care in America. Washington, DC: The National Academies Press; 2013. [PubMed] [Google Scholar]
- 9.Burk M, Moore V, Glassman P, et al. Medication-use evaluation with a web application. Am J Health Syst Pharm. 2013;70(24):2226-34. [DOI] [PubMed] [Google Scholar]
- 10.Aspinall SL, Zhao X, Good CB, et al. Intervention to decrease glyburide use in elderly patients with renal insufficiency. Am J Geriatr Pharmacother. 2011;9(1):58-68. [DOI] [PubMed] [Google Scholar]
- 11.J.D. Power and Associates. Press release. As consumers shoulder more healthcare expenses, cost increasingly drives overall customer satisfaction with pharmacies. September 21, 2010. Available at: http://businesscenter.jdpower.com/news/pressrelease.aspx?ID=2010187. Accessed July 26, 2016.
- 12.J.D. Power and Associates. Press release. Pharmacy customers have higher expectations for short wait times. September 20, 2011. Available at: http://www.jdpower.com/press-releases/pharmacy-satisfaction-study. Accessed July 26, 2016.
- 13.J.D. Power and Associates. Press release. Customer satisfaction with mail-order pharmacies trails satisfaction with brick and mortar pharmacies. September 27, 2012. Available at: http://www.jdpower.com/pressreleases/2012-us-pharmacy-study. Accessed July 26, 2016.
- 14.J.D. Power and Associates. Press release. The customer satisfaction gap continues to widen between brick and mortar and mail-order pharmacies. September 30, 2013. Available at: http://www.jdpower.com/press-releases/2013-us-pharmacy-study. Accessed July 26, 2016.
- 15.J.D. Power and Associates. Press release. Pharmacy’s focus on customer satisfaction sets the bar for the healthcare industry. August 24, 2015. Available at: http://www.jdpower.com/press-releases/2015-us-pharmacystudy. Accessed July 26, 2016.
- 16.Wells DL, Popish S, Kay C, Torrise V, Christopher MLD. VA Academic Detailing Service: implementation and lessons learned. Fed Pract. 2016;33(5):38-42. [PMC free article] [PubMed] [Google Scholar]
- 17.U.S. Department of Veterans Affairs. VHA Directive 1031. Antimicrobial stewardship programs. January 22, 2014. Available at: http://www.va.gov/vhapublications/ViewPublication.asp?pub_ID=2964. Accessed July 26, 2016.