

Abstract
BACKGROUND:
Hypoglycemia poses a significant clinical and economic burden to patients with type 2 diabetes mellitus (T2DM). Minimizing the risk of hypoglycemia is an important component when managing patients with T2DM. Understanding hypoglycemia rates and the associated economic consequences can help to inform health care decision makers.
OBJECTIVE:
To assess hypoglycemia incidence rates and associated costs in patients who initiated second-line treatment with the antidiabetic agents linagliptin or a sulfonylurea (SU) after metformin.
METHODS:
A large U.S. administrative claims database was used to identify patients with T2DM (during the identification period July 2011-October 2013) who initiated linagliptin or a SU after metformin use. The date of the first prescription for linagliptin or a SU during the identification period was designated as the index date. Linagliptin users were matched to SU users based on demographic and clinical characteristics identified within a 12-month period before the index date using propensity scores (1:3 ratio, caliper: ±0.001). Rates and costs (2013 U.S. dollars) of hypoglycemia resulting in any health care resource use were quantified during a variable follow-up period (i.e., end of the study, end of the 12-month follow-up, treatment regimen change, or disenrollment, whichever came first). Hypoglycemia rates per 100 person-years were compared using univariate Poisson regression, and hazard of hypoglycemia was obtained from multivariate Cox proportional hazards regression. Mean monthly hypoglycemia-related costs, all-cause costs, and T2DM-related costs were computed for patients with hypoglycemia and compared using t-tests.
RESULTS:
Propensity-score matching resulted in a sample of 11,536 patients (linagliptin = 2,884; SU = 8,652) with a mean age of 56 years and 59% male. The rate of hypoglycemia (per 100 person-years) was lower in the linagliptin than the SU user groups (2.51 vs. 3.63; P= 0.049). Linagliptin users had a 33% lower risk of hypoglycemia compared with SU users (HR = 0.67; 95% CI = 0.47-0.97; P= 0.031). Among patients who had hypoglycemia, linagliptin users showed numerically lower mean monthly hypoglycemia-related costs compared with SU users ($300 vs. $890; P= 0.092), which was primarily driven by differences in hypoglycemia-related costs in the hospital setting. A similar theme was observed with monthly all-cause costs (linagliptin users, $1,971 vs. SU users, $3,758; P= 0.092).
CONCLUSIONS:
Linagliptin use was associated with a lower incidence rate of hypoglycemia compared with SU use in patients initiating second-line therapy after metformin monotherapy. Among patients who experienced hypoglycemia, linagliptin users appeared to have lower monthly hypoglycemia-related and all-cause costs than SU users. Careful consideration of newer treatment alternatives may be prudent for optimal T2DM management, especially with regard to hypoglycemia.
What is already known about this subject
Hypoglycemia is a prevalent complication of type 2 diabetes mellitus (T2DM) treatment, which significantly contributes to the clinical and economic burden of T2DM.
American Diabetes Association (ADA) guidelines position hypoglycemia risk as an important consideration during treatment and hemoglobin A1c goal selection.
Clinical trials have sufficiently demonstrated the superior safety profile, in terms of hypoglycemia risk reduction, of newer oral antidiabetic drugs (such as dipeptidyl peptidase-4 [DPP-4] inhibitors) compared with older drugs (such as sulfonylureas [SUs]). Therefore, these newer drugs can be important treatment alternatives for second-line therapy after failure of metformin monotherapy in patients considered as high-risk for hypoglycemia.
What this study adds
The results of this study corroborate findings from clinical trials using real-world data from a large U.S. administrative claims database and show that linagliptin (a DPP-4 inhibitor) use was associated with a 33% lower risk of hypoglycemia compared with SU use in T2DM patients initiating second-line therapy after metformin monotherapy.
Linagliptin users were less likely to be treated in a hospital/emergency room setting for an incident hypoglycemic event compared with SU users.
The lower rates of hypoglycemia translated into numerically lower medical costs for linagliptin users who experienced hypoglycemia compared with SU users.
As of 2014, diabetes mellitus has affected an estimated 29.1 million people in the United States, and the Centers for Disease Control and Prevention estimates that the prevalence of diabetes could increase to 1 in 3 Americans by the year 2050.1,2 The majority of patients with diabetes (approximately 95%) suffer from type 2 diabetes mellitus (T2DM).1 Hypoglycemia is an important consequence of treatment for T2DM, potentially affecting clinical and economic outcomes for these patients. Prevalence estimates for hypoglycemia are variably reported in the literature and range from 12% to 30%, depending on the treatment regimen.3-5 Severe clinical manifestations, such as falls, dysrhythmias, confusion, and neuroglycopenia, have been attributed to hypoglycemia and present a significant burden for patients, caregivers, and providers.6
In addition to the clinical burden, hypoglycemia also poses an economic burden to patients, providers, and payers. While some episodes of hypoglycemia are mild and can be managed by the patient or caregiver, other episodes require medical intervention by health care professionals, resulting in increased resource utilization. U.S. public health surveillance data have shown that in patients aged 65 years or older who presented to the emergency room (ER) for drug events related to endocrine agents, nearly all resultant hospitalizations (94.6%) were for hypoglycemia.7 Recently published estimates for direct costs of hypoglycemia events requiring medical assistance were reported to be $1,161, on average, per episode in the United States, while indirect costs have been estimated to be as high as $579 per episode (2012 U.S. dollars).8
Given the potential impact of hypoglycemia on patients, the American Diabetes Association (ADA) and European Association for the Study of Diabetes guidelines recommend the consideration of hypoglycemia risk when setting glycated hemoglobin (A1c) targets and selecting treatment regimens.9 These guidelines specifically recommend monotherapy with metformin as first-line therapy.9 For patients who fail to meet goals on metformin, the addition of another oral antidiabetic drug (OAD) is recommended.9 Sulfonylureas (SUs) are the most often used add-on therapy, since they are effective and less costly than other OADs.10 However, as many as 10% of patients receiving an SU are at risk of a severe hypoglycemia episode each year because of the long half-life periods or delayed kidney clearance associated with these drugs.10-12
Newer OADs have a better safety profile with regard to hypoglycemia than older treatment regimens.13 For example, newer OADs such as dipeptidyl peptidase-4 (DPP-4) inhibitors have been shown to be effective treatment options for T2DM with a reduced risk of hypoglycemia because of their glucose-dependent mechanism of action, which makes them ideal candidates for second-line therapy in patients with hypoglycemia issues who failed on metformin monotherapy.14 In a 2-year, randomized, double-blind, noninferiority trial comparing linagliptin (a DPP-4 inhibitor) to glimepiride (an SU) in patients with T2DM inadequately controlled with metformin, patients on linagliptin had lower rates of hypoglycemic events overall yet had similar rates of A1c reduction compared with patients on glimepiride.13 Although clinical trials have sufficiently demonstrated that DPP-4 inhibitors reduce the risk of hypoglycemia compared with SUs, there is limited corroborative evidence and information on its health economic implications from real-world settings.
Treating diabetes while minimizing risk of hypoglycemia is an important component of T2DM management, and newer OADs initiated after first-line metformin treatment should be evaluated in relation to their impact on hypoglycemia. The purpose of this study was to assess hypoglycemia rates and associated costs in a real-world setting for patients who initiated second-line treatment with antidiabetic agents linagliptin or SUs after metformin.
Methods
Study Design
This study employed a retrospective, matched-cohort design using integrated medical and pharmacy claims from a large, geographically representative U.S. administrative claims database (IMS LifeLink PharMetrics Plus). This database provides medical claims, pharmacy claims, and enrollment information for approximately 90 million health plan members from over 100 managed care organizations and Medicare. Patients with T2DM previously treated with metformin and newly initiating treatment with linagliptin or a SU as second-line therapy were evaluated over the study period from July 2010 to December 2013.
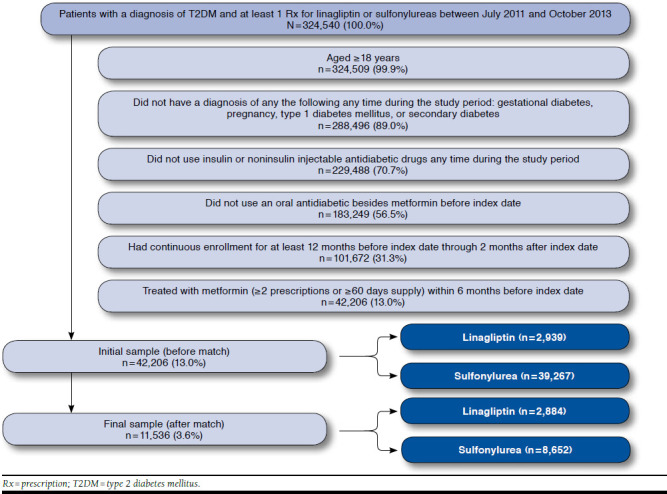
The index date was defined as the date of the first prescription for linagliptin or a SU during the index identification period of July 2011-October 2013. The baseline period was the 12-month time frame before the index date. Patients were followed for a variable period (minimum of 2 months to a maximum of 12 months) starting from the index date until 1 of the following occurred: discontinuation of linagliptin or SU (i.e., treatment gap of ≥ 60 days), switching/adding on another OAD, end of 12-month follow-up period, end of study period, or end of continuous health plan eligibility (Figure 1).
FIGURE 1.

Study Design
Linagliptin users were matched to SU users in a 1:3 ratio using the technique of nearest neighbor match based on propensity scores.15 Propensity scores were estimated with logistic regression models that calculated scores by predicting the probability of being in the linagliptin cohort. Covariates included in the model were age; gender; geographic region; payer type; plan type; Charlson Comorbidity Index (CCI); presence of conditions reported to have an association with hypoglycemia (dementia, depression, coronary artery disease, congestive heart failure, retinopathy, renal impairment, Addison’s disease, growth hormone deficiency, hypopituitarism, and hypothyroidism); prior hospitalization; prior endocrinologist visit; previous hypoglycemic event; length of metformin therapy before index date; baseline T2DM-related costs; and metformin continuation (yes/no).16-20
Study Population
To be included in the study, patients were required to have at least 1 claim for linagliptin or an SU from July 2011 to October 2013; be aged ≥ 18 years, have at least 1 medical claim with a primary or secondary diagnosis of T2DM (International Classification of Diseases, Ninth Revision, Clinical Modification [ICD-9-CM] codes 250.x0 and 250.x2); have at least 2 prescriptions or ≥ 60 days supply of metformin within 6 months before index date; and be continuously enrolled for at least 12 months before and at least 2 months after the index date. Patients with the presence of index medication or other OAD (with the exception of metformin) before the index date were excluded, as were patients with a diagnosis of pregnancy, gestational diabetes, secondary diabetes, or type 1 diabetes mellitus at any point during the study period.
Study Outcomes and Analyses
Study outcomes included the incidence of hypoglycemia (that resulted in any health care resource use) and health care costs (hypoglycemia-associated, T2DM-related, and all-cause). The incidence rate of hypoglycemic events was captured over the variable 12-month follow-up period. An algorithm developed by Ginde et al. (2008) was used as the basis for identifying a hypoglycemia episode,21 with the incidence of hypoglycemia defined as the first occurrence of hypoglycemia requiring intervention as determined by resource utilization with a primary or secondary ICD-9-CM code for hypoglycemia (codes 251.0, 251.1, 251.2, and 250.8 without the codiagnosis of an alternative diabetic event such as secondary diabetic glycogenosis or diabetic lipidosis). While the original algorithm only considered hospitalizations and ER visits, the algorithm was slightly modified for this study to include outpatient visits so that a comprehensive assessment of the hypoglycemia burden could be conducted. Incidence rates were reported on a 100 person-year basis, with overall rates of hypoglycemia and rates by setting of care reported.
Costs for hypoglycemia-associated medical claims during the follow-up period were calculated for each patient who experienced hypoglycemia. Paid amounts were used and represent the insurer and patient responsibility. Costs were computed on a monthly basis per person and as a cost per hypoglycemic event. All costs were standardized to 2013 U.S. dollars using the medical component of the Consumer Price Index.22
Costs from all medical and pharmacy claims during the follow-up period were calculated for each patient who experienced hypoglycemia and presented as all-cause costs. Accordingly, costs for medical claims with a primary diagnosis code of T2DM and all claims for diabetes-related medications were captured for each patient who experienced hypoglycemia and presented as T2DM-related costs. Similar to hypoglycemia-associated costs, these costs were measured by paid amounts, computed on a monthly basis, and standardized to 2013 U.S. dollars using the medical component of the Consumer Price Index.
Demographic and clinical characteristics of the cohorts at baseline were compared using paired t-tests for continuous variables and McNemar’s tests for categorical variables. Standardized differences were estimated to evaluate the success of matching.23 Differences of < 10% were indicative of acceptable balance in baseline characteristics between matched cohorts. Hypoglycemia rates per 100 person-years were compared using univariate Poisson regression, and the hazard of hypoglycemia was obtained from multivariate Cox proportional hazards regression. Furthermore, t-tests were used to assess differences in cost outcomes between cohorts. All analyses were conducted with SAS version 9.2 (SAS Institute, Cary, NC). No statistical comparisons were conducted for hypoglycemia rates by setting of care because of small sample sizes.
Results
Overall, 42,206 patients met the initial study criteria (2,939 in the linagliptin cohort; 39,267 in the SU cohort). Major factors contributing to attrition were the lack of continuous enrollment during the 12-month baseline period through the 2-month period following the index date; previous use of injectable antidiabetic drugs; use of an OAD (besides metformin) before the index date; and lack of treatment with metformin (≥ 2 prescriptions or ≥ 60 days supply) during the 6 months before the index date (see Appendix, available in online article). After matching patients from the 2 study cohorts using propensity scores, 11,536 patients remained. Based on the 1:3 matching ratio, the linagliptin cohort included 2,884 patients, and the SU cohort included 8,652 patients. Ninety-eight percent of the linagliptin cohort was retained, indicating that the sample was representative.
After matching, the baseline characteristics for the study cohorts were well balanced, and the postmatch standardized differences were < 10% for all baseline characteristics (Table 1). A higher percentage of the final matched sample was mostly male (58.5%), with a mean age of 56±10 years and residing in the southern region of the United States. The CCI score was moderate in the matched cohorts (mean = 1.6±1.1). The most common comorbidity was coronary artery disease (14%), followed by depression (8%). Previous hospitalization and visits to endocrinologists were observed in 9% of the cohorts, while previous hypoglycemic events were observed in < 2% of the matched cohorts.
TABLE 1.
Characteristics of Matched Cohort at Baseline
| Characteristics at Baseline | Total N = 11,536 | Linagliptin n = 2,884 | Sulfonylurea n = 8,652 | P Valuea | Standardized Difference(%)b | |||
|---|---|---|---|---|---|---|---|---|
| Age in years, mean (SD) | 55.7 | (10.1) | 55.7 | (9.8) | 55.8 | (10.3) | 0.833 | 0.3 |
| Males, n (%) | 6,744 | (58.5) | 1,692 | (58.7) | 5,052 | (58.4) | 0.719 | 0.6 |
| Geographic region, n (%) | ||||||||
| Northeast | 3,161 | (27.4) | 785 | (27.2) | 2,376 | (27.5) | 0.714 | 0.5 |
| Midwest | 1,994 | (17.3) | 495 | (17.2) | 1,499 | (17.3) | 0.706 | 0.4 |
| South | 5,645 | (48.9) | 1,428 | (49.5) | 4,217 | (48.7) | 0.215 | 1.5 |
| West | 736 | (6.4) | 176 | (6.1) | 560 | (6.5) | 0.299 | 1.5 |
| Payer type, n (%) | ||||||||
| Commercial | 7,325 | (63.5) | 1,824 | (63.3) | 5,501 | (63.6) | 0.640 | 0.7 |
| Medicare | 342 | (3.0) | 88 | (3.1) | 254 | (2.9) | 0.680 | 0.7 |
| Medicaid/SCHIP | 138 | (1.2) | 30 | (1.0) | 108 | (1.3) | 0.217 | 2.0 |
| Otherc | 3,731 | (32.3) | 942 | (32.7) | 2,789 | (32.2) | 0.539 | 0.9 |
| Plan type, n (%) | ||||||||
| HMO | 916 | (7.9) | 229 | (7.9) | 687 | (7.9) | 1.000 | 0.0 |
| Indemnity | 391 | (3.4) | 94 | (3.3) | 297 | (3.4) | 0.555 | 1.0 |
| PPO/POS | 9,969 | (86.4) | 2,491 | (86.4) | 7,478 | (86.4) | 0.925 | 0.2 |
| Otherd | 260 | (2.3) | 70 | (2.4) | 190 | (2.2) | 0.332 | 1.5 |
| Charlson Comorbidity Index, mean (SD) | 1.6 | (1.1) | 1.6 | (1.1) | 1.6 | (1.1) | 0.424 | 1.2 |
| Specific comorbidities, n (%) | ||||||||
| Depression | 931 | (8.1) | 236 | (8.2) | 695 | (8.0) | 0.735 | 0.6 |
| Dementia | 20 | (0.2) | 6 | (0.2) | 14 | (0.2) | 0.597 | 1.1 |
| Coronary artery disease | 1,580 | (13.7) | 388 | (13.5) | 1,192 | (13.8) | 0.546 | 0.9 |
| Congestive heart failure | 327 | (2.8) | 82 | (2.8) | 245 | (2.8) | 1.000 | 0.1 |
| Retinopathy | 355 | (3.1) | 89 | (3.1) | 266 | (3.1) | 1.000 | 0.1 |
| Renal impairment | 889 | (7.7) | 216 | (7.5) | 673 | (7.8) | 0.466 | 1.1 |
| Have comorbidities with increased risk of hypoglycemia while on diabetes treatmente | 1,762 | (15.3) | 428 | (14.8) | 1,334 | (15.4) | 0.243 | 1.6 |
| Previous hospitalization for any reason, n (%) | 1,008 | (8.7) | 247 | (8.6) | 761 | (8.8) | 0.600 | 0.8 |
| Visited an endocrinologist, n (%) | 1,031 | (8.9) | 247 | (8.6) | 784 | (9.1) | 0.093 | 1.8 |
| Metformin continuer, n (%) | 8,946 | (77.6) | 2,210 | (76.6) | 6,736 | (77.9) | 0.055 | 2.9 |
| Previous hypoglycemic event, n (%) | 206 | (1.8) | 53 | (1.8) | 153 | (1.8) | 0.777 | 0.5 |
| Length of metformin therapy before index (days), mean (SD) | 236.5 | (106.4) | 236.1 | (104.9) | 236.6 | (106.9) | 0.748 | 0.4 |
| Baseline T2DM-related costs (annual), mean (SD) | $505 | (923.0) | $531 | (952.0) | $496 | (913.0) | 0.015 | 3.7 |
a Paired t-test for continuous variables and McNemar’s test for dichotomous variables.
b Standardized difference = 100 × (x1-x2)/√{(s1 2 + s2 2)/2}, where x1 = mean of group 1, x2 = mean of group 2, s1 = standard deviation of group 1, and s2 = standard deviation of group 2.
c Self-insured, unknown/missing.
d Consumer-directed health plan, unknown/missing.
e Addison’s disease, growth hormone deficiency, hypopituitarism, and hypothyroidism.
HMO = health maintenance organization; POS = point of service; PPO = preferred provider organization; SCHIP = State Children’s Health Insurance Program; SD = standard deviation; T2DM = type 2 diabetes milletus.
A total of 36 (1.25%) linagliptin and 171 (1.98%) SU patients had at least 1 hypoglycemic event during the follow-up period. The incidence rate of hypoglycemia per 100 person-years was significantly lower in the linagliptin cohort than the SU user cohort (2.51 vs. 3.63; P=0.049). Results of the Cox proportional hazards regression revealed that linagliptin users had a 33% lower risk of hypoglycemia compared with SU users (hazard ratio [HR] = 0.67; 95% confidence interval [CI] = 0.47-0.97; P= 0.031; Figure 2). When evaluating hypoglycemia by setting of care, rates identified within the hospital setting only were more than twice as high in the SU cohort (0.30 vs. 0.14). Among both cohorts, the physician office was the most common setting of care for hypoglycemic events. Additional results by setting of care are provided in Table 2 (statistical testing was not done by setting of care due to small sample sizes).
FIGURE 2.

Time-to-Event (Hypoglycemia) Analysis: Kaplan-Meier Curve
TABLE 2.
Incidence Rate of Hypoglycemic Events
| Total N = 11,536 | Linagliptin n = 2,884 | Sulfonylurea n = 8,652 | |
|---|---|---|---|
| Rate in 100 person-years | 3.37 | 2.51 | 3.63a |
| Rate in 100 person-years by setting of care (% of overall rate) | |||
| Hospital | 0.26 (7.7) | 0.14 (5.6) | 0.30 (8.2) |
| Emergency room | 0.34 (10.1) | 0.07 (2.8) | 0.42 (11.7) |
| Physician office | 2.38 (70.6) | 1.82 (72.2) | 2.55 (70.2) |
| Otherb | 0.39 (11.6) | 0.49 (19.4) | 0.36 (9.9) |
a P = 0.049 vs. linagliptin; using generalized linear model with log link function and Poisson distribution.
b Includes hospital outpatient services, home health care, other inpatient stays (skilled nursing facility and rehab stays), and other ancillary services not accompanying a hospitalization, emergency room, or physician office visit.
Among patients who experienced a hypoglycemic event, linagliptin users had numerically lower mean monthly hypoglycemia costs per patient compared to SU users ($300 vs. $890; P= 0.092; Table 3). When costs were evaluated on a per hypoglycemic event basis, mean costs were numerically lower for linagliptin users ($1,868 vs. $2,683; P= 0.636). When assessing hypoglycemia-related costs by setting of care, hospitalization was the most expensive, with linagliptin users having numerically lower costs compared with SU users ($1,577 vs. $2,338; P = 0.660). While hypoglycemia costs were notably different across the study cohorts, these differences did not reach statistical significance.
TABLE 3.
Costs Among Patients with Hypoglycemic Eventsa
| After Match | |||||||
|---|---|---|---|---|---|---|---|
| Total N = 207 | Linagliptin n = 36 | Sulfonylurea n = 171 | P Value | ||||
| Hypoglycemia-related medical costs per patient per month, mean (SD) | |||||||
| Overall, $ | 787 | (3,804) | 300 | (848) | 890 | (4,162) | 0.092 |
| By setting of care, $ | |||||||
| Hospitalization | 642 | (3,757) | 200 | (842) | 736 | (4,112) | 0.122 |
| Emergency room | 60 | (251) | 37 | (219) | 65 | (257) | 0.544 |
| Physician office | 77 | (417) | 44 | (74) | 84 | (458) | 0.286 |
| Otherb | 8 | (36) | 19 | (64) | 6 | (26) | 0.220 |
| Hypoglycemia-related medical costs per hypoglycemic event, mean (SD) | |||||||
| Overall, $ | 2,542 | (13,032) | 1,868 | (8,109) | 2,683 | (13,862) | 0.636 |
| By setting of care, $ | |||||||
| Hospitalization | 2,205 | (13,067) | 1,577 | (8,140) | 2,338 | (13,899) | 0.660 |
| Emergency room | 164 | (624) | 110 | (657) | 176 | (618) | 0.562 |
| Physician office | 140 | (275) | 117 | (111) | 145 | (298) | 0.328 |
| Otherb | 31 | (130) | 65 | (216) | 24 | (103) | 0.277 |
| All-cause costs per patient per month, mean (SD) | |||||||
| Total, $ | 3,447 | (10,249) | 1,971 | (3,727) | 3,758 | (11,130) | 0.092 |
| Medical | 3,095 | (10,128) | 1,420 | (3,477) | 3,447 | (11,005) | 0.049 |
| Pharmacy | 352 | (598) | 551 | (347) | 310 | (631) | < 0.001 |
| T2DM costs per patient per month, mean (SD) | |||||||
| Total, $ | 304 | (1,082) | 402 | (500) | 283 | (1,168) | 0.332 |
| Medical | 242 | (1,078) | 148 | (494) | 261 | (1,164) | 0.352 |
| Pharmacy | 62 | (107) | 254 | (76) | 22 | (57) | < 0.001 |
Note: Bold values indicate P < 0.05.
a Costs are presented in 2013 U.S. dollars.
b Includes hospital outpatient services, home health care, other inpatient stays (skilled nursing facility and rehab stays), and other ancillary services not accompanying a hospitalization, emergency room, or physician office visit.
SD = standard deviation; T2DM = type 2 diabetes mellitus.
Overall, a similar theme was observed while assessing monthly total all-cause costs. Linagliptin users had numerically lower mean monthly all-cause costs compared with SU users ($1,971 vs. $3,758, respectively; P= 0.092), where the difference was likely because of lower all-cause medical costs among linagliptin users ($1,420 vs. $3,447; P= 0.049). Conversely, mean monthly T2DM-related costs appeared to be higher for linagliptin users than SU users ($402 vs. $283; P=0.332). This was attributable to higher pharmacy costs for the linagliptin users ($254 vs. $22; P < 0.001).
Discussion
Overall, incidence rates of hypoglycemia were significantly lower for patients receiving second-line linagliptin after metformin monotherapy, resulting in lower costs. Furthermore, a lower proportion of patients in the linagliptin cohort received care in a hospital or ER setting for their incident hypoglycemic events compared with the SU cohort, likely an indicator that the hypoglycemia events experienced may have been less severe for the linagliptin cohort. Health care costs were consistently favorable (although not statistically significant) for linagliptin users who experienced hypoglycemia compared with SU users, with the exception of pharmacy costs.
The current study findings from real-world settings seem to corroborate data from clinical trials.13,24 Gallwitz et al. (2012) compared linagliptin to glimepiride in a 2-year, parallel-group, noninferiority trial.13 Although the primary endpoint of the trial was A1c levels, the study also captured the incidence of hypoglycemia. Hypoglycemic events in the clinical trial were defined as asymptomatic and symptomatic events that may or may not have required health care resource utilization. Severe hypoglycemia in the clinical trial was based on the definition set by the ADA in 2005 and reconfirmed by an ADA workgroup in 2012,25,26 wherein severe hypoglycemia was defined as an event requiring assistance of another person to actively administer carbohydrate, glucagon, or other resuscitative actions. Gallwitz et al. showed that significantly fewer patients receiving linagliptin had hypoglycemia or severe hypoglycemia compared with patients receiving glimepiride (7% vs. 36% for hypoglycemia, P < 0.0001; < 1% vs. 2% for severe hypoglycemia).13 It is worth pointing out that the hypoglycemia definition used in the clinical trial was different likely did not include asymptomatic events. Furthermore, not than that used in this study; a claim-based definition was used all patients experiencing hypoglycemia in this study needed in this study to assess and compare real-world rates of hypo-resuscitative actions, since many events were diagnosed in a glycemia that actually resulted in health care resource use. All physician’s office rather than an ER. Therefore, results should patients experiencing hypoglycemic events identified using be interpreted with varying definitions and settings (clinical the claim-based definition utilized health care resources and trial vs. claims analyses) of hypoglycemia in mind.
Curkendall et al. (2014) also evaluated the use of a DPP-4 inhibitor (specifically saxagliptin) compared with an SU, both used concomitantly with metformin in an observational study using claims data.24 The purpose of that study was to measure hypoglycemia event rates during the first 4 months after initiation of either therapy. The methodology of the Curkendall study was similar to this study in that it was conducted using a claims database in a population that included commercially insured and Medicare beneficiaries, and patients were also propensity-score matched. As was the case in this study, rates of hypoglycemia were significantly lower for patients receiving saxagliptin plus metformin versus an SU plus metformin (1.74 vs. 4.45 per 100-person years; P=0.005). It should be noted that rates reported in the Curkendall et al. study were overall events rates (count of all events) rather than incidence rates (count of first instance of the event) as was assessed in this study. In addition, the rates in the Curkendall et al. study were computed based on a follow-up period of 4 months, while this study was based on a variable follow-up period of up to 12 months. Notwithstanding differences in methodology, both studies were similar in their findings that the rates were lower for the DPP-4 inhibitor compared with SUs.
Costs of hypoglycemia reported in the literature vary greatly by study, so it is important to bear this in mind while interpreting and comparing them to results in this study. Pietri et al. (2012) examined the annual costs of hypoglycemia over a 1-year time period in a claims analysis.27 The analysis compared patients who experienced hypoglycemia with those not experiencing hypoglycemia and did not differentiate by type of diabetes therapy received. Univariate results of the analysis showed higher total annual health care costs for patients with severe hypoglycemic events compared with controls ($32,337 vs. $19,786; P < 0.0001). Multivariate results confirmed the findings and showed that severe hypoglycemic events led to a significant 1.66-fold increase (95% CI = 1.35-2.04) in total annual health care costs.27
Curkendall et al. (2011) also conducted a claims analysis for patients diagnosed with T2DM to evaluate the economic impact of hypoglycemia.28 Costs averaged $10,362 per event for ER-to-inpatient hypoglycemia events and $285 per outpatient event, regardless of drug regimen. The Curkendall study evaluated patients from time of diagnosis until the end of the study period, which ranged from 2003 to 2008.28 While there was some stratification by therapy, the study did not look specifically at second-line therapy. However, results from this study do suggest that setting of care plays an important role in the contribution to costs, which is congruent with the findings of this study.
Foos et al. (2015) is the most recently published study evaluating costs of hypoglycemia.8 A model was constructed to estimate costs on a per-episode basis of hypoglycemia. Based on the model results, the average cost per episode of hypoglycemia requiring medical assistance was $1,161 (2012 U.S. dollars). In comparison, the cost per episode reported in this study was $2,542, which was slightly higher; however, it should be noted that the results by Foos et al. were not regimen specific. While costs associated with hypoglycemia vary, it is clear that it presents a burden to the patient, the payer, and the health care system.
Limitations
Several limitations are associated with this study that warrant consideration. First, pharmacy claims data are not able to capture medications obtained from the physician office or medications that do not typically involve insurance (low-cost generics). In addition, SUs are available as low-cost generics, so the linagliptin cohort may have been more likely to have patients also receiving an SU; therefore, there was the potential to overestimate hypoglycemic events in the linagliptin cohort. Second, one of the criteria used to end follow-up was treatment discontinuation. This criterion was applied in order to assess the hypoglycemic event associated with the antidiabetic regimen under consideration. This approach could, however, lead to underestimation of costs in the SU cohort, since those patients are at higher risk of hypoglycemia and, therefore, more likely to discontinue the SU regimen. This limitation was mitigated by reporting monthly costs to account for the variable follow-up. Third, results of the cost analysis should also be interpreted with caution because of the small sample sizes and variability in costs. Hypoglycemia events are typically under-reported or misclassified in claims data, and any costs would therefore be underestimated. This analysis was dependent on hypoglycemia coding to identify the incident, since clinical information was not available in the claims. Consequently, the definition of hypoglycemia in this study may be different than those in other studies or trials. Additionally, results may be influenced by other confounders not captured in claims data, such as T2DM severity and years since diagnosis. Fourth, a prescription filled was assumed to be taken as prescribed. This is important, since incorrect use of antidiabetic drugs (dose/timing) is associated with hypoglycemia.20 Finally, since the study findings are based on a predominantly (> 80%) commercially insured population, they may not be generalizable to other populations.
Conclusions
Linagliptin use was associated with lower incidence rates of hypoglycemia compared with SUs in patients initiating therapy as a second-line after metformin monotherapy. SU users experiencing hypoglycemia were more likely to be treated in the hospital and ER setting compared with linagliptin users, likely indicating a higher severity of hypoglycemic events among SU users. Among patients experiencing hypoglycemia, numerically lower monthly hypoglycemia-related costs were observed for linagliptin users than SU users. The difference was primarily because of costs associated with hospitalizations. Further investigation with larger sample sizes is warranted to validate results, especially with respect to cost outcomes. Consideration of newer treatment alternatives may be warranted for optimal management of T2DM, particularly with regard to adverse events such as hypoglycemia.
ACKNOWLEDGMENTS
The authors acknowledge Meg Franklin, who assisted with the writing of the manuscript.
APPENDIX. Study Attrition
REFERENCES
- 1.Centers for Disease Control and Prevention. National diabetes statistics report: estimates of diabetes and its burden in the United States, 2014. Atlanta, GA: U.S. Department of Health and Human Services; 2014. Available at: http://www.cdc.gov/diabetes/pubs/statsreport14/national-diabetes-report-web.pdf. Accessed February 11, 2016. [Google Scholar]
- 2.Boyle JP, Thompson TJ, Gregg EW, Barker LE, Williamson DF. Projection of the year 2050 burden of diabetes in the US adult population: dynamic modeling of incidence, mortality, and prediabetes prevalence. Popul Health Metr. 2010:8:29. [DOI] [PMC free article] [PubMed] [Google Scholar]
- 3.Jermendy G, Hungarian RECAP Group, Erdesz D, et al. Outcomes of adding second hypoglycemic drug after metformin monotherapy failure among type 2 diabetes in Hungary. Health Qual Life Outcomes. 2008;6:88. [DOI] [PMC free article] [PubMed] [Google Scholar]
- 4.Miller CD, Phillips LS, Ziemer DC, Gallina DL, Cook CB, El-Kebbi IM. Hypoglycemia in patients with type 2 diabetes mellitus. Arch Intern Med. 2001;161(13):1653-59. [DOI] [PubMed] [Google Scholar]
- 5.Stargardt T, Gonder-Frederick L, Krobot KJ, Alexander CM. Fear of hypoglycaemia: defining a minimum clinically important difference in patients with type 2 diabetes. Health Qual Life Outcomes. 2009;7:91. [DOI] [PMC free article] [PubMed] [Google Scholar]
- 6.Barnett AH, Cradock S, Fisher M, Hall G, Hughes E, Middleton A. Key considerations around the risks and consequences of hypoglycaemia in people with type 2 diabetes. Int J Clin Pract. 2010;64(8):1121-29. [DOI] [PubMed] [Google Scholar]
- 7.Budnitz DS, Lovegrove MC, Shehab N, Richards CL. Emergency hospitalizations for adverse drug events in older Americans. N Engl J Med. 2011;365(21):2002-12. [DOI] [PubMed] [Google Scholar]
- 8.Foos V, Varol N, Curtis BH, et al. Economic impact of severe and non-severe hypoglycemia in patients with type 1 and type 2 diabetes in the United States. J Med Econ. 2015;18(6):420-32. [DOI] [PubMed] [Google Scholar]
- 9.Inzucchi SE, Bergenstal RM, Buse JB, et al. Management of hyperglycemia in type 2 diabetes: a patient-centered approach. Position statement of the American Diabetes Association (ADA) and the European Association for the Study of Diabetes (EASD). Diabetologia. 2012;55(6):1577-96. [DOI] [PubMed] [Google Scholar]
- 10.Nathan DM, Buse JB, Davidson MB, et al. Medical management of hyperglycemia in type 2 diabetes: a consensus algorithm for the initiation and adjustment of therapy: a consensus statement of the American Diabetes Association and the European Association for the Study of Diabetes. Diabetes Care. 2009;32(1):193-203. [DOI] [PMC free article] [PubMed] [Google Scholar]
- 11.Campbell IW. Sulfonylureas and hypoglycemia. Diabetic Hypoglycemia. 2009;2(1):3-10. [Google Scholar]
- 12.Rodbard HW, Blonde L, Braithwaite SS, et al. American Association of Clinical Endocrinologists medical guidelines for clinical practice for the management of diabetes mellitus. Endocr Pract. 2007;13(Suppl 1):1-68. [DOI] [PubMed] [Google Scholar]
- 13.Gallwitz B, Rosenstock J, Rauch T, et al. 2-year efficacy and safety of linagliptin compared with glimepiride in patients with type 2 diabetes inadequately controlled on metformin: a randomised, double-blind, non-inferiority trial. Lancet. 2012;380(9840):475-83. [DOI] [PubMed] [Google Scholar]
- 14.McGill JB. Linagliptin for type 2 diabetes mellitus: a review of the pivotal clinical trials. Ther Adv Endocrinol Metab. 2012;3(4):113-24. [DOI] [PMC free article] [PubMed] [Google Scholar]
- 15.Rosenbaum PR, Rubin DB. The central role of the propensity score in observational studies for causal effects. Biometrika. 1983;70(1):41-55. [Google Scholar]
- 16.Charlson ME, Pompei P, Ales KL, MacKenzie CR. A new method of classifying prognostic comorbidity in longitudinal studies: development and validation. J Chron Dis. 1987;40(5):373-83. [DOI] [PubMed] [Google Scholar]
- 17.Deyo R, Cherkin DC, Ciol MA. Adapting a clinical comorbidity index for use with ICD-9-CM administrative databases. J Clin Epidemiol. 1992;45(6):613-19. [DOI] [PubMed] [Google Scholar]
- 18.Tschöpe D, Bramlage P, Binz C, Krekler M, Deeg E, Gitt AK. Incidence and predictors of hypoglycaemia in type 2 diabetes - an analysis of the prospective DiaRegis registry. BMC Endocr Disord. 2012;12:23. [DOI] [PMC free article] [PubMed] [Google Scholar]
- 19.Desouza CV, Bolli GB, Fonseca V. Hypoglycemia, diabetes, and cardiovascular events. Diabetes Care. 2010;33(6):1389-94. [DOI] [PMC free article] [PubMed] [Google Scholar]
- 20.Amiel SA, Dixon T, Mann R, Jameson K. Hypoglycaemia in type 2 diabetes. Diabet Med. 2008;25(3):245-54. [DOI] [PMC free article] [PubMed] [Google Scholar]
- 21.Ginde AA, Blanc PG, Lieberman RM, Camargo CA Jr. Validation of ICD-9-CM coding algorithm for improved identification of hypoglycemia visits. BMC Endocr Disord. 2008;8:4. [DOI] [PMC free article] [PubMed] [Google Scholar]
- 22.U.S. Bureau of Labor Statistics. Consumer Price Index. Available at: http://www.bls.gov/CPI. Accessed February 11, 2016.
- 23.Austin PC. Balance diagnostics for comparing the distribution of baseline covariates between treatment groups in propensity-score matched samples. Stat Med. 2009;28(25):3083-107. [DOI] [PMC free article] [PubMed] [Google Scholar]
- 24.Curkendall SM, Zhang B, Lenhart G, Thomson E, Bell KF. Rate of hypoglycemia in patients with type 2 diabetes receiving metformin plus saxagliptin versus metformin plus sulfonylurea: a retrospective observational cohort study using administrative claims data. Expert Rev Endocrinol Metab. 2014;9(2):183-91. [DOI] [PubMed] [Google Scholar]
- 25.American Diabetes Association Workgroup on Hypoglycemia. Defining and reporting hypoglycemia in diabetes: a report from the American Diabetes Association Workgroup on Hypoglycemia. Diabetes Care. 2005;28(5):1245-49. [DOI] [PubMed] [Google Scholar]
- 26.Seaquist ER, Anderson J, Childs B, et al. Hypoglycemia and diabetes: a report of a workgroup of the American Diabetes Association and the Endocrine Society. Diabetes Care. 2013;36(5):1384-95. [DOI] [PMC free article] [PubMed] [Google Scholar]
- 27.Pietri G, Kennedy K, Bouchard J, et al. The cost of hypoglycemic events associated with diabetes: a retrospective claims database study. Value Health. 2012;15(4):A177. [Abstract PDB37]. [Google Scholar]
- 28.Curkendall SM, Zhang B, Oh KS, Williams SA, Pollack MF, Graham J. Incidence and cost of hypoglycemia among patients with type 2 diabetes in the United States: analysis of a health insurance database. J Clin Outcomes Manage. 2011;18(10):455-62. [Google Scholar]