

Abstract
BACKGROUND:
The federal 340B Drug Discount Program provides access to significant drug price discounts for health care organizations in the United States that serve a disproportional share of disadvantaged patients.
OBJECTIVE:
To analyze trends over a 10-year period (2006~2016) in the price of specialty drugs, contrasting the market price with the price paid under the 340B program.
METHODS:
Pharmacy purchase records, including the 340B drug price and the wholesale acquisition cost (WAC), were collected from a 340B-contract pharmacy group in Southern California between 2006 and 2016. Records were used to calculate price changes in the annual average price paid. The average price was calculated as the weighted price, using purchasing volume for each year as weights. Separate time series of year-to-year price changes were created by therapeutic class using the American Hospital Formulary Service Therapeutic Classification system.
RESULTS:
The 340B price growth rate patterns were similar to the profile of the WAC prices over time across all drug classes. The overall drug price growth rate per year over 10 years for WAC prices was 15% and 10% for 340B prices. For specialty drug classes, the average growth rates per year were 14% for the WAC price and 6% for the 340B price. For certain specialty drug classes, such as antineoplastic and antiretroviral drugs, the 340B price inflation rates were significantly lower than the WAC price inflation rates after 2013.
CONCLUSIONS:
The price inflation of specialty drugs exceeds the rate of inflation in the Consumer Price Index for prescription drugs. The 340B price shows a similar inflation pattern as the WAC price over time in the specialty drug categories.
What is already known about this subject
The use and cost of specialty drugs over time have accounted for one-third of total drug spending in the United States.
The federal 340B Drug Discount Program provides access to significant drug price discounts for health care organizations serving disadvantaged patients.
The fast expansion of 340B-covered entities and the growth of specialty drug use raises the awareness of specialty drug prices under the 340B program.
What this study adds
The annual price increases in wholesale acquisition costs (WAC) and 340B prices for specialty drugs are higher than the overall prescription price inflation rate.
In general, the 340B price growth rates in specialty drugs did not outpace the WAC price growth rate and have a similar growth pattern as the WAC price growth rate.
The past 20 years have seen a substantial increase in drug prices in the U.S. health care market, especially for specialty drugs.1-4 To be designated as a specialty drug commonly requires that the drug is either high cost, requires special handling during transportation and administration, requires patient monitoring for safety and efficacy, requires a limited distribution network, or focuses on a rare disease.5 Specialty drugs usually include self-injection products, agents infused in outpatient clinics, or expensive oral products.6 Despite the various definitions, the most common determination cited by insurance payers is the high cost.7 The Medicare specialty tier threshold definition uses $600 per 30 days’ supply for payers to classify a drug in the specialty category.8 For some commercial plans, the threshold ranges from $1,000 to $1,200.9
Specialty drugs have attracted the attention of numerous global pharmaceutical companies and have thus become the focus of increasing research investment. In 2006, only 6 specialty drugs gained approval by the U.S. Food and Drug Administration (FDA) in the United States. The number increased quickly to 27 by 2014.10 In the first 2 quarters of 2018, 14 specialty drugs were approved by the FDA.11-13 Meanwhile, the sales of specialty drugs have increased significantly in the U.S. market, accounting for $77.5 billion, or nearly 24%, of drug spending in 2011. This sales volume rose to $150.8 billion and 36% of the drug spending in 2015.14-16 With the expectation of steady growth in the specialty drug market, predictions also showed that the annual sales of specialty drugs would increase to $402 billion and represent 47% of all medications by 2020.14,16,17
Many pharmaceutical companies have shifted their research and development strategy from traditional small-molecule “blockbuster” drugs to “niche buster” specialty drugs to offset the loss from competition that results when drugs lose patent protection.18-20 Information regarding the price of specialty drugs is becoming a major issue for health care stakeholders. Previous research has estimated an inelastic demand for specialty drugs among patients compared with traditional drugs,21 with studies also showing upward trends in drug prices in the specialty drugs domain.1 However, research documenting the price trends for specialty drugs relative to other drug prices in the United States is currently absent.
There is no single reference drug price that is universally accepted in the U.S. health care market. Four published drug prices have been commonly used as the U.S. reference price: the average wholesale price (AWP),22-24 the average sales price (ASP),24-26 the average manufacturer price (AMP),24,27 and the wholesale acquisition cost (WAC).22,23 Among these reference prices, the WAC price is the most commonly accepted drug price benchmark in the U.S. pharmaceutical market.23 Another drug price, the 340B price, has been less discussed.
The 340B drug price originates from the 340B Drug Discount Program, created by the federal government in 1992 to promote the delivery of health care services to the disadvantaged population.28,29 The 340B program allows covered health care entities, such as specialty care facilities and safety net clinics, to purchase outpatient medications at a significantly discounted price from the WAC. The 340B drug price ceiling is set by law at least 15% below the AMP price for medications.24,30,31 Drug manufacturers that participate in the Medicaid program are required by the government to provide drugs to covered entities at a cost no higher than the ceiling price in the 340B program.
To become an entity covered by the 340B program, the health care system must serve a disproportionally large number of Medicare/Medicaid beneficiaries or other low-income patients and apply for 340B program eligibility.28 Covered entities can purchase medications directly from manufacturers and wholesalers at 340B prices and dispense these medications via entity-owned pharmacies, contracted pharmacies, clinic dispensaries, or outpatient clinics for physician-administrated medicines. Alternatively, the covered entities can purchase drugs from the manufacturers at the 340B price but dispense them through a network of 340B-contracted community pharmacies.29 Covered entities are required to adhere to guidelines set forth by the Health Resource and Services Administration (HRSA) and are only allowed to dispense 340B drugs to eligible patients.
Several studies have discussed price trends for specialty drugs in the U.S. health care market.9,32,33 However, few studies have addressed specialty drug price inflation under the 340B program. Our analysis documented the price inflation among specialty drugs in the 340B program and compared these results to the corresponding price inflation data using the WAC price. We also compared the 340B price inflation for specialty drugs with the Consumer Price Index for drugs reported by the U.S government to visualize how 340B specialty drug prices changed compared with regular drug prices over time.
Methods
Medication purchasing records were collected from a 340B-contracted pharmacy network in southern California for the years 2006-2016. Data included National Drug Code (NDC) numbers, drug names, purchasing quantities, AWP values, 340B invoice price values, and transaction dates. Because the WAC price was not included in the purchasing records, we derived the WAC price based on the in-file AWP using the following formula23:
WAC price value = AWP price value ÷ 1.2
We used American Hospital Formulary Service (AHFS) Pharmacologic-Therapeutic Classification codes to classify the drugs for the analysis.34 The following formula for drug price per therapeutic class was applied:
[Sum of (Drug Purchasing Quantity × Drug price) ÷ Sum of Drug Quantity]
We calculated this volume-weighted drug price monthly and then calculated the average annual price by therapeutic class. We then compared the current year drug price change with the previous year and reported the annual price change as a percentage change by therapeutic class. For a sensitivity analysis, we used the unweighted drug price values in the WAC and 340B groups to examine whether the purchasing quantity affected the drug price inflation calculations.
The First Databank drug database was used to obtain the brand-name status for all drugs in the purchasing records by matching the NDC numbers. We compared the average drug price inflation between the brand-name products and generic products in each reference price by therapeutic class. While there are no consistent criteria in defining specialty drugs, we selected drugs under the therapeutic classes that have been commonly cited by specialty drug studies and based on the purchase record availability.1,5,6,8,9,21,33,35,36 The following therapeutic classes were selected: antiretroviral drugs, disease-modifying antirheumatic drugs (DMARDs), antineoplastic drugs, hematopoietic agents, interferons, and immunosuppressive agents. When comparing the overall 340B drug price and the WAC price, we excluded certain drug classes based on a lesser therapeutic purpose, for example, dental agents, medical devices, diagnostic agents, pharmaceutical aids, serums/toxoids/vaccines, and vitamins. The AHFS codes used in the analysis are listed in the Appendix (available in online article). To illustrate the trend of specialty drug price change relative to the general drug price, we used prescription drug data from the Consumer Price Index to depict the general U.S. drug price inflation rate between 2006 and 2016.37 The t-test was applied to test the null hypothesis at 0.1 and 0.05 levels for whether the price inflation rates were the same between the WAC and 340B prices. Microsoft Excel (Microsoft, Redmond, WA) and SAS version 9.3 (SAS Institute, Cary, NC) were used for data preparation and analysis process.
Results
All Drug Price Comparison
We found no significant difference in the average price inflation between the WAC and 340B price values for all drug classes across the 10-year study period (14.7% vs. 10.3%, P = 0.39; Table 1). For brand-name drugs, WAC and 340B price values had a similar inflation trend, and both inflation rates were higher than the general inflation rate, except for the years 2009, 2012, and 2014. For generic drugs, the price inflation trends were similar between WAC and 340B price values after 2007. WAC and 340B price inflation rates were lower than the general inflation rates between 2008 and 2010 for generic drugs.
TABLE 1.
Overall Price Inflation Rate Comparison
| Drug Class | Average WAC (Weighted) % | Average 340B (Weighted) % | Difference % | WAC Difference, Weighted and Unweighted % | 340B Difference, Weighted and Unweighted % | Brand Name | Generic | ||||
|---|---|---|---|---|---|---|---|---|---|---|---|
| Average WAC % | Average 340B % | Difference % | Average WAC % | Average 340B % | Difference % | ||||||
| Overall, all drugs | 14.7 | 10.3 | 4.5 | -1.3 | -0.1 | 23.2 | 15.0 | 8.2 | 10.4 | 5.1 | 5.3 |
| Overall, specialty drugs only | 14.1 | 6.4 | 7.8 | 1.5 | -0.5 | 14.5 | 7.8 | 6.7 | 19.6 | 22.9 | -3.3 |
| Antiretrovirals | 4.5 | -1.4 | 5.9a | -1.1 | -0.1 | 7.1 | 2.4 | 4.7 | 23.2 | 38.3 | -15.0 |
| Antineoplastics | 21.1 | 21.0 | 0.1 | 1.2 | -0.3 | 32.7 | 33.0 | -0.2 | 18.2 | 33.1 | -14.9 |
| DMARDs | 19.1 | -3.2 | 22.3 | 7.8 | 5.4 | 21.7 | -1.2 | 22.9 | b | b | b |
| Hematopoietic agents | 12.3 | 3.3 | 9.0 | 4.5 | -1.3 | 12.3 | 3.3 | 9.0 | b | b | b |
| Interferons | -11.0 | -11.5 | 0.5 | 0.6 | 0.0 | -11.0 | -11.4 | 0.5 | b | b | b |
| Immunosuppressive agents | 95.0 | 111.0 | -16.0 | -55.4 | -10.9 | 28.7 | -19.1 | 47.8 | 99.0 | 169.4 | -70.4 |
aP < 0.10.
bNo purchasing records found in dataset.
340B = 340B Drug Discount Program; DMARD = disease-modifying antirheumatic drug; WAC = wholesale acquisition cost.
Overall Specialty Drug Price Comparison
The WAC price had a higher average inflation rate than the 340B price (14.1% vs. 6.4%, P = 0.48; Table 1) over time for overall specialty drugs. For brand-name drugs, the WAC price value showed a higher average inflation rate than the 340B price value, although the difference was not significant (14.5% vs. 7.8%, P = 0.54; Table 1). Inflation change patterns were similar between WAC and the 340B price values for brandname specialty drugs (Figure 1). We found that for generic specialty drugs, the average 340B price inflation rate was higher than the average WAC price inflation rate (22.9% vs. 19.6%, P = 0.88; (Table 1). Generic specialty drugs had higher inflation rates than brand-name specialty drugs in WAC and 340B price values. Moreover, we observed significant price inflation peaks in generic specialty drugs across time, especially in 2008 and 2011 (Figure 1).
FIGURE 1.
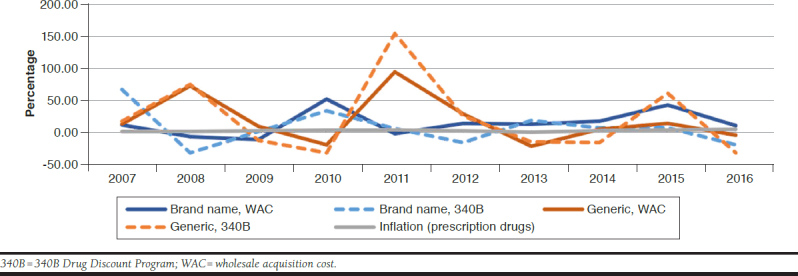
Specialty Drug Price Inflation Rate Comparison
Antineoplastic Drugs
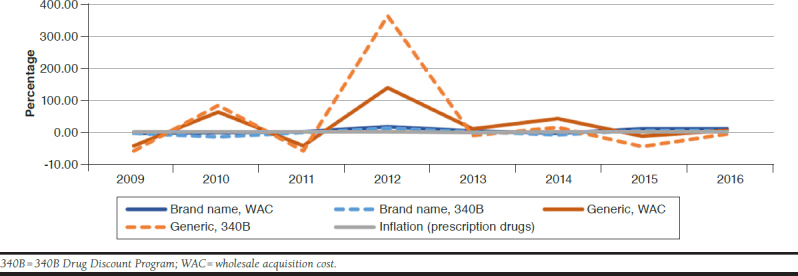
No statistically significant difference was found between the price inflation rates of WAC and 340B values across time (21.6% vs. 21.0%, P = 0.99; Table 1). For brand-name antineoplastic drugs, the average price inflation rates were the same between WAC and 340B price values. Generic antineoplastic drugs, however, showed different average inflation rates between WAC and 340B price values, although the difference was insignificant (Table 1). Inflation patterns of WAC and 340B price values were similar for brand-name and generic antineoplastic drugs. We also observed a time-lagged association between brand-name and generic drug price inflation rates in WAC and 340B price values (Figure 2).
FIGURE 2.

Antineoplastic Drug Price Inflation Rate Comparison
Antiretroviral Drugs
The average WAC price growth rate was significantly higher than the average 340B price growth rate across the target years (4.5% vs. -1.4%, P = 0.05), regardless of brand-name status (Table 1). For brand-name antiretroviral drugs, WAC and 340B price inflation rates were more stable than generic drugs (Figure 3). Maximum price inflation rates were approximately 20% for brand-name antiretroviral drugs compared with 350% for generic drugs. The WAC price value had a slightly higher average inflation rate than the 340B price value for brand-name products. The average inflation rate of the 340B price value was higher than that of the WAC price value for generic products (Table 1). Average 340B and WAC prices for generic products experienced a price peak in 2012 (Figure 3). Within both price values, we noted that generic antiretroviral drugs had a higher average inflation rate than brand-name products over the 10-year time frame (Table 1 and Figure 3), while brand-name products experienced relatively stable price inflation rates overall. Such higher average inflation rates could have resulted from the drug price peaks in 2010, 2012, and 2014.
FIGURE 3.
Antiretroviral Drug Price Inflation Rate Comparison
Discussion
The medication purchases processed through the federal 340B program has increased exponentially over the past 20 years, from $3.4 billion in 2006 to $16.2 billion in 2016.38-40 This spending growth can be caused by such factors as the rising number of covered entities, contracted pharmacies, increasing use of expensive specialty drugs, and inflation of 340B drug prices. From 2006 to 2016, the number of covered entities increased from 15,765 to 50,741, while the number of contracted pharmacies rose from 1,104 to 35,181, respectively.41 According to a 2016 IMS report, 58% of outpatient drug spending is driven by specialty drugs.42 Studies also have predicted a 40% annual increase in specialty drug purchases among outpatient drugs.43 Since most 340B price-eligible drugs are outpatient drugs, the swift increase of specialty drug spending in the 340B program is inevitable.
In this study, we analyzed specialty drug price inflation in WAC and 340B price values for the following therapeutic classes: antiretroviral drugs, antineoplastic drugs, disease-modifying antirheumatic drugs, hematopoietic agents, interferons, and immunosuppressive agents, and then categorized the price inflation rates by brand-name status. These selected drug classes include the majority of commonly prescribed specialty drugs in the U.S. drug market.1 Therefore, we believe our analysis represents the overall specialty drug price trend in the U.S. health care system.
To document drug price inflation over time, we used purchasing quantity-weighted drug prices in WAC and 340B price values. Using the quantity-weighted price can reduce potential bias from the rarely obtained drugs and make drug price trends more comparable with experience from real-world pharmacy management. We carried out a sensitivity analysis by using unweighted WAC and 340B price values and found no significant difference between the weighted and unweighted results among most of the drug classes (Table 1).
In general, the 340B price had a lower inflation rate than the WAC price across the 10 years included in this study. We did not observe significantly different price inflation patterns between WAC and 340B prices. Contrary to common belief, our analysis revealed that brand-name products did not always link to higher price inflation rates. For instance, generic antiretroviral drugs and generic immunosuppressive agents possessed higher price inflation rates in WAC and 340B prices when compared with their brand-name counterparts. In the overall analysis of specialty drugs, we also observed higher inflation rates for generic products than brand-name products in WAC and 340B price values. Such an effect could be attributed to the marketing strategy of brand-name product manufacturers, which would use the 340B price values to compete with the generic products once the latter became available on the market. For instance, we observed a decrease in the 340B price inflation rates among brand antiretroviral drugs after generics such as abacavir and nevirapine began to emerge on the market in 2013.44,45 Alternatively, rather than merely representing a health care policy tool, the 340B program could also be used by manufacturers to increase market share in therapeutic areas with multiple comparative products.
Among the subclasses of the specialty drugs we analyzed, some of the drug classes, such as the antineoplastic agents, demonstrated a time-lagged relationship for inflation rates among the brand-name and generic products. The pattern usually started with an inflation peak in the brand-name products, followed by the generic products. This observation implies that brand-name manufacturers maintained their role as the drug pricing leader in the antineoplastic drug market over the 10-year study period.
Finally, we found that WAC and 340B price inflation rates were higher than the prescription drug prices reported by the Consumer Price Index The prescription drug components of the Consumer Price Index may not adequately represent the drug prices faced by health care entities. Based on the methodology document from the U.S. Bureau of Labor Statistics,46 drug prices were sampled from all sites providing health care services, including hospitals, pharmacies, and physician clinics, but prices were estimated only on a consumer out-of-pocket cost basis. The drug prices analyzed in our study, however, were from a pharmacy perspective. Since patients perceive drug costs differently than providers,47 the substantial gap between the drug price inflation rates reported in our analysis and the rates reported in the prescription drug components of the Consumer Price Index is expected. Yet, this finding also suggests that the current price index system does not reflect the purchase cost and the market price inflation for specialty drugs. A separate price index reporting system for U.S. specialty drugs is thus recommended for health policy stakeholders and researchers in the drug policy analysis field.
Limitations
This analysis has several limitations. First, our analysis did not encompass all specialty drugs on the market. Because of the lack of consensus on the definition of specialty drugs, we identified specialty drugs from therapeutic classes commonly cited in specialty drug studies. In general, these therapeutic classes include most of the specialty drugs that are high cost, require monitoring, are injection/infusion drugs,1,6,21 and are distributed by specialty pharmacies.9,42,48-50 Also, some specialty drug products may have been missed because of purchasing record availability (Table 1).
Second, to select the specialty drugs used in this analysis and to broaden the view of drug price composition under different drug pricing systems, we used the AHFS Pharmacologic-Therapeutic Classification codes in the purchase records to categorize drug prices. Since different drug classification systems may have different definitions for therapeutic classes, our analysis results might not be generalizable to other therapeutic classification systems, such as the Medi-Span Generic Product Identifier or the Anatomical Therapeutic Chemical Classification System.51,52
Third, while some drugs might have different drug class codes in different years, our analysis did not trace the code modification across time. Therefore, some of the average drug price inflation estimates may not be accurate. Therapeutic class mixed with nonspecialty drugs could bias the result, as well. We used therapeutic class to group specialty drugs rather than apply a handpicked drug list for the analysis. Some therapeutic classes, such as DMARDs and antineoplastics, are mixtures of expensive biological agents and traditional small molecule agents. The price inflation estimate in such drug classes could be skewed as a result.
Finally, the pricing database that we used was based on drug purchasing records of 340B-covered entities. We limited our analysis to real-world drug purchasing decisions, rather than to the total drug catalog files of wholesalers, to reflect the real-world market situation of specialty drugs. In addition, covered entities are bound to the scope of their HRSA grants, patient population mix, and 340B patient eligibility. Some drugs might not have been included in the analysis, which may have biased the result.
Further analysis is required to evaluate whether the 340B program affects patient and provider behavior regarding specialty drug use (e.g., medication adherence and treatment selection). In addition, it is pertinent to investigate whether the 340B program affects overall health care utilization and access for the disadvantaged population and fulfills the intent of the 340B program. We also suggest a nationwide 340B program database that features covered entities and includes medical claims and pharmacy claims so that future researchers can investigate the health outcomes associated with the 340B program.
Conclusions
Our analysis presents the price trend of specialty drugs from 2006 to 2016 using the WAC and federal 340B Drug Discount Program. The results suggest above-normal price inflation among specialty drugs during this time frame. The inconsistent price inflation patterns between the prescription drug components of the Consumer Price Index and specialty drugs also showed the need for a specified drug price index to reflect specialty drug price trends in the United States. The inconsistent price inflation patterns between the prescription drug components of the Consumer Price Index and specialty drugs also showed the need for a specified drug price index to reflect specialty drug price trends in the U.S. Our analysis also showed that 340B price values had a similar trending pattern as the WAC price values during the time frame of this analysis in specialty drug categories. Brand-name status, therapeutic class, and marketing strategy potentially affect price trends of U.S. specialty drugs. Consequently, a national 340B entity dataset, including medical and pharmacy claims, is recommended for facilitating more comprehensive analyses regarding the health outcomes of the 340B program. This study provides an insight into drug price trends for specialty drugs for specialty drug management stakeholders. With the high and increasing costs of specialty pharmacy drugs, understanding price trends will help the U.S. health care system allocate resources more efficiently.
APPENDIX. AHFS Codes for Drug Class Inclusion/Exclusion
| Inclusion Codes | Exclusion Codes |
|---|---|
| Antineoplastic agents | Dental agents |
| 10000000 | 34000000 |
| Antiretrovirals | Devices |
| 81808000 | 94000000 |
| 81808080 | Diagnostic agents |
| 81808160 | 36040000 |
| 81808200 | 36260000 |
| Disease-modifying antirheumatics | 36580000 |
| 92360000 | 36600000 |
| Hematopoietic agents | 36840000 |
| 20160000 | 36882400 |
| Interferons | Pharmaceutical aids |
| 81820000 | 96000000 |
| Immunosuppressive agents | Serums, toxoids, and vaccines |
| 92440000 | 80040000 |
| 80080000 | |
| 80120000 | |
| Vitamins | |
| 88040000 | |
| 88080000 | |
| 88120000 | |
| 88160000 | |
| 88200000 | |
| 88240000 | |
| 88280000 |
AHFS = American Hospital Formulary Service Pharmacologic-Therapeutic Classification.
References
- 1.Penington R, Stubbings JA. Evaluation of specialty drug price trends using data from retrospective pharmacy sales transactions. J Manag Care Spec Pharm. 2016;22(9):1010-17. Available at: https://www.jmcp.org/doi/10.18553/jmcp.2016.22.9.1010. [DOI] [PMC free article] [PubMed] [Google Scholar]
- 2.Schondelmeyer S, Purvis L. Trends in retail prices of brand name prescription drugs widely used by older Americans, 2006 to 2015. Rx Price Watch Report. December 2016. Available at: https://www.aarp.org/content/dam/aarp/ppi/2016-12/trends-in-retail-prices-dec-2016.pdf. Accessed November 13, 2018.
- 3.Diplomat Clinical Services . Specialty drug approvals: 2016 highlights & 2017 projections. 2017. Available at: https://issuu.com/diplomatrx/docs/2016pipelinerecapfinal_web?e=15248128/42785885. Accessed November 14, 2018.
- 4.Lotvin A. What’s special about specialty? CVS Health. Available at: https://cvshealth.com/thought-leadership/whats-special-about-specialty. Accessed November 14, 2018.
- 5.Gleason PP, Alexander GC, Starner CI, et al. Health plan utilization and costs of specialty drugs within 4 chronic conditions. J Manag Care Pharm. 2013;19(7):542-48. Available at: https://www.jmcp.org/doi/10.18553/jmcp.2013.19.7.542. [DOI] [PMC free article] [PubMed] [Google Scholar]
- 6.Sullivan SD. The promise of specialty pharmaceuticals: are they worth the price? J Manag Care Pharm. 2008;14(4 Suppl A): S3-S6. Available at: https://www.jmcp.org/doi/abs/10.18553/jmcp.2008.14.S4-A.3. [DOI] [PMC free article] [PubMed] [Google Scholar]
- 7.EMD Serono . EMD Serono Specialty Digest, 9th edition. Managed care strategies for specialty pharmaceuticals. 2013. Available at: http://www. amcp.org/EMDSeronoSpecialtyDigest9th.pdf. Accessed November 14, 2018.
- 8.Spatz I. Health Policy Brief: specialty pharmaceuticals. Health Affairs. November 25, 2013. Available at: http://www.healthaffairs.org/healthpolicy-briefs/brief.php?brief_id=103. Accessed November 14, 2018.
- 9.Schondelmeyer SW, Purvis L. Trends in retail prices of specialty prescription drugs widely used by older Americans, 2006 to 2015. Rx Price Watch Report. September 2017. Available at: https://www.aarp.org/content/dam/aarp/ppi/2017/11/full-report-trends-in-retail-prices-of-specialty-prescription-drugs-widely-used-by-older-americans.pdf. Accessed December 13, 2018.
- 10.PwC Health Research Institute . Medical cost trend: behind the numbers 2016. June 2015. Available at: https://www.achp.org/wp-content/uploads/pwc-hri-medical-cost-trend-2016.pdf. Accessed November 14, 2018.
- 11.CVS Health . Specialty pharmacy pipeline. Drugs to watch: anticipated launches Q1 2018-Q2 2018. 2018. Available at: https://payorsolutions.cvshealth.com/sites/default/files/cvs-health-payor-solutions-specialty-pharmacy-pipeline-drugs-to-watch-q1-q2-2018.pdf. Accessed November 14, 2018.
- 12.CVS Health . Specialty pharmacy pipeline. Drugs to watch: anticipated launches Q3 2018-Q4 2018. Available at: https://payorsolutions.cvshealth.com/sites/default/files/cvs-health-payor-solutions-specialty-pharmacy-pipe-line-drugs-to-watch-q3-q4-2018.pdf. Accessed December 13, 2018.
- 13.U.S. Food and Drug Administration. Novel drug approvals for 2018. Updated December 13, 2018. Available at: https://www.fda.gov/Drugs/DevelopmentApprovalProcess/DrugInnovation/ucm592464.htm. Accessed December 13, 2018.
- 14.IMS Institute . Medicines use and spending in the U.S. A review of 2015 and outlook to 2020. April 2016. Available at: https://morningconsult.com/wp-content/uploads/2016/04/IMS-Institute-US-Drug-Spending-2015.pdf. Accessed November 14, 2018.
- 15.IMS Institute for Healthcare Informatics . Medicines use and spending shifts in 2014. April 2015. Available at: https://www.iqvia.com/-/media/iqvia/pdfs/institute-reports/medicines-use-and-spending-shifts-in-the-us-in-2014.pdf?la=en&hash=049AAB32FCE0987B85D4357140624F2E8925A6B1&_=1542224369850. Accessed December 10, 2018.
- 16.UnitedHealth Center for Health Reform & Modernization . The growth of specialty pharmacy: current trends and future opportunities. Issue Brief. April 2014. Available at: http://www.unitedhealthgroup.com/~/media/uhg/pdf/2014/unh-the-growth-of-specialty-pharmacy.ashx. Accessed November 14, 2018.
- 17.Truven Health Analytics. Specialty pharmacy trends . Health Leader’s Fact File. October 2016. Available at: https://truvenhealth.com/Portals/0/assets/provider/201610-truven-health-fact-files.pdf. Accessed November 14, 2018.
- 18.Dolgin E. Big pharma moves from “blockbusters” to “niche busters.” Nat Med. 2010;16(8):837. [DOI] [PubMed] [Google Scholar]
- 19.Kumar Kakkar A, Dahiya N. The evolving drug development landscape: from blockbusters to niche busters in the orphan drug space. Drug Dev Res. 2014;75(4):231-34. [DOI] [PubMed] [Google Scholar]
- 20.Song CH, Han JW. Patent cliff and strategic switch: exploring strategic design possibilities in the pharmaceutical industry. Springerplus. 2016;5(1):692. Available at: https://www.ncbi.nlm.nih.gov/pmc/articles/PMC4899342/. Accessed November 14, 2018. [DOI] [PMC free article] [PubMed] [Google Scholar]
- 21.Goldman DP, Joyce GF, Lawless G, Crown WH, Willey V. Benefit design and specialty drug use. Health Aff (Millwood). 2006;25(5):1319-31. Available at: https://www.healthaffairs.org/doi/full/10.1377/hlthaff.25.5.1319?url_ver=Z39.88-2003&rfr_id=ori%3Arid%3Acrossref.org&rfr_dat=cr_ pub%3Dpubmed. Accessed November 14, 2018. [DOI] [PMC free article] [PubMed] [Google Scholar]
- 22.Gencarelli DM. Average wholesale price for prescription drugs: is there a more appropriate pricing mechanism? NHPF Issue Brief. 2002;(775):1-19. [PubMed] [Google Scholar]
- 23.Curtiss FR, Lettrich P, Fairman KA. What is the price benchmark to replace average wholesale price (AWP)? J Manag Care Pharm. 2010;16(7):492-501. Available at: https://www.jmcp.org/doi/10.18553/jmcp.2010.16.7.492. [DOI] [PMC free article] [PubMed] [Google Scholar]
- 24.Salter M. Reference pricing: an effective model for the U.S. pharmaceutical industry? Northwest J Int Law Bus. 2015;35(2):413-38. Available at: https://scholarlycommons.law.northwestern.edu/cgi/viewcontent. cgi?article=1785&context=njilb. Accessed November 14, 2018. [Google Scholar]
- 25.U.S. Department of Health and Human Services, Office of Inspector General . Average sales prices: manufacturer reporting and CMS oversight. OEI-03-08-00480. February 2010. Available at: https://oig.hhs.gov/oei/reports/oei-03-08-00480.pdf. Accessed November 14, 2018.
- 26.U.S. Department of Health and Human Services, Office of Inspector General . Calculation of volume-weighted average sales price for Medicare Part B prescription drugs. OEI-03-05-00310. February 2006. Available at: https://oig.hhs.gov/oei/reports/oei-03-05-00310.pdf. Accessed November 14, 2018.
- 27.U.S. Department of Health and Human Services, Office of Inspector General . Medicaid drug price comparisons: average manufacturer price to published prices. OEI-05-05-00240. June 2005. Available at: https://www. oig.hhs.gov/oei/reports/oei-05-05-00240.pdf. Accessed November 14, 2018.
- 28.Health Resources and Services Administration . 340B drug pricing program. Updated November 2018. Available at: https://www.hrsa.gov/opa/index.html. Accessed November 15, 2018.
- 29.Mulcahy AW, Armstrong C, Lewis J, Mattke S. The 340B prescription drug discount program: origins, implementation, and post-reform future. Rand Corporation. PE-121-SDS. 2014. Available at: http://www.rand.org/pubs/perspectives/PE121.html. Accessed November 15, 2018.
- 30.Ruggeri K, Nolte E. Pharmaceutical pricing: the use of external reference pricing. RAND Corporation. RR-240-DH. 2013. Available at: https://www.rand.org/pubs/research_reports/RR240.html. Accessed November 15, 2018. [PMC free article] [PubMed] [Google Scholar]
- 31.Health Resources and Services Administration . 340B drug pricing program ceiling price and manufacturer civil monetary penalties regulation. Fed Regist. 2017;82(3):1210-30. Available at: https://www.gpo.gov/fdsys/pkg/FR-2017-01-05/pdf/2016-31935.pdf. Accessed November 15, 2018. [PubMed] [Google Scholar]
- 32.Stern D, Reissman D. Specialty pharmacy cost management strategies of private health care payers. J Manag Care Pharm. 2006;12(9):736-44. Available at: https://www.ncbi.nlm.nih.gov/pubmed/17249906. [DOI] [PMC free article] [PubMed] [Google Scholar]
- 33.Trish E, Joyce G, Goldman DP. Specialty drug spending trends among Medicare and Medicare Advantage enrollees, 2007-11. Health Aff (Millwood). 2014;33(11):2018-24. Available at: https://www.ncbi.nlm.nih.gov/pmc/articles/PMC4250050/. Accessed November 15, 2018. [DOI] [PMC free article] [PubMed] [Google Scholar]
- 34.American Hospital Formulary Service . AHFS Pharmacologic-Therapeutic Classification. 2017. Available at: http://www.ahfsdruginformation.com/ahfs-pharmacologic-therapeutic-classification/. Accessed November 15, 2018.
- 35.Kirchhoff SM. Specialty drugs: background and policy concerns. Congressional Research Service. August 3, 2015. Available at: https://fas.org/sgp/crs/misc/R44132.pdf. Accessed November 15, 2018.
- 36.Hirsch BR, Balu S, Schulman KA. The impact of specialty pharmaceuticals as drivers of health care costs. Health Aff (Millwood). 2014;33(10):1714-20. Available at: https://www.healthaffairs.org/doi/full/10.1377/hlthaff.2014.0558?url_ver=Z39.88-2003&rfr_id=ori%3Arid%3Acrossref.org&rfr_dat=cr_pub%3Dpubmed. Accessed November 15, 2018. [DOI] [PubMed] [Google Scholar]
- 37.U.S. Bureau of Labor Statistics . Consumer Price Index. 2017. Available at: https://www.bls.gov/cpi/data.htm. Accessed November 15, 2018.
- 38.Fein AJ. Exclusive: the 340B program hits $16.2 billion in 2016; now 5% of U.S. drug market. Drug Channels. May 18, 2017. Available at: http://www.drugchannels.net/2017/05/exclusive-340b-program-hits-162-billion.html. Accessed November 15, 2018.
- 39.Fein AJ. 340B purchases hit $12 billion in 2015—and almost half of the hospital market. Drug Channels. February 23, 2016. Available at: http://www.drugchannels.net/2016/02/340b-purchases-hit-12-billion-in.html. Accessed November 15, 2018.
- 40.Vandervelde A, Blalock E. 340B program sales forecast: 2016-2021. Berkeley Research Group. 2016. Available at: http://340breform.org/userfiles/December%202016%20BRG%20Growth%20Study.pdf. Accessed November 15, 2018.
- 41.Health Resources and Services Administration, Office of Pharmacy Affairs . 340B OPAIS. Database. 2017. Available at: https://340bopais.hrsa.gov. Accessed December 13, 2018.
- 42.IQVIA Institute for Human Data Science . Medicines use and spending in the U.S.: a review of 2016 and outlook to 2021. May 4, 2017. Available at: https://www.iqvia.com/institute/reports/medicines-use-and-spending-in-the-us-a-review-of-2016. Accessed December 13, 2018.
- 43.Express Scripts . 2016 drug trend report. 2017. Available at: http://lab.express-scripts.com/lab/drug-trend-report/previous-reports. Accessed November 15, 2018.
- 44.QuintilesIMS . Drug in focus: abacavir. Market Insights. October 4, 2014. Available at: http://162.44.221.25/es_PE/solution-areas/healthcare-market-insights/generics-pipeline-patent-intelligence/abacavir. Accessed November 15, 2018.
- 45.QuintilesIMS . Drug in focus: nevirapine. Market Insights. April 13, 2013. Available at: http://162.44.221.25/es_PE/solution-areas/healthcare-market-insights/generics-pipeline-patent-intelligence/nevirapine. Accessed November 15, 2018.
- 46.U.S. Bureau of Labor Statistics . BLS Handbook of Methods. Chapter 17: The Consumer Price Index (updated 2-14-2018). Available at: http://www.bls.gov/opub/hom/pdf/homch17.pdf. Accessed November 15, 2018.
- 47.Reinhardt UE. The pricing of U.S. hospital services: chaos behind a veil of secrecy. Health Aff (Millwood). 2006;25(1):57-69. Available at: https://www.healthaffairs.org/doi/full/10.1377/hlthaff.25.1.57?url_ver=Z39.88-2003&rfr_id=ori%3Arid%3Acrossref.org&rfr_dat=cr_pub%3Dpubmed. Accessed November 15, 2018. [DOI] [PubMed] [Google Scholar]
- 48.Express Scripts . 2017 drug trend report. 2018. Available at: http://lab.express-scripts.com/lab/drug-trend-report/2017-dtr. Accessed November 15, 2018.
- 49.Magellan Rx Management . Medical pharmacy trend report. 2017 eighth edition. 2018. Available at: https://www1.magellanrx.com/media/722153/2017_mrx_medical-pharmacy-trend-report.pdf. Accessed November 15, 2018.
- 50.EMD Serono . EMD Serono specialty digest, 14th edition. 2018. Available at: http://specialtydigest.emdserono.com/Default.aspx. Accessed November 15, 2018.
- 51.Agency for Healthcare Research and Quality, United States Health Information Knowledgebase . Product code qualifier. National Council for Prescription Drug Programs. 2014. Available at: https://ushik.ahrq.gov/ViewItemDetails?itemKey=201111000&system=sdo. Accessed November 15, 2018.
- 52.WHO Collaborating Center for Drug Statistics Methodology . Anatomical Therapeutic Chemical Classification System. Structure and principles. 2018. Available at: https://www.whocc.no/atc/structure_and_principles/. Accessed November 15, 2018.