

Abstract
BACKGROUND:
Although treatment for osteoporosis is recommended by U.S. clinical guidelines, a lack of diagnosis and treatment is common among patients with osteoporotic fractures.
OBJECTIVE:
To determine the rates of osteoporosis diagnosis and treatment before and after various types of fractures.
METHODS:
This was a retrospective claims analysis using data from the Humana Medicare Advantage claims (Medicare group) and Optum Insight Clinformatics Data Mart commercial claims (Commercial group). Patients included in the study had a claim for a qualifying fracture occurring between January 2008 and December 2013 (the index fracture), were continuously enrolled in the health plan for ≥ 1 year before and after the index fracture, and were aged ≥ 65 years in the Medicare group or ≥ 50 years in the Commercial group at the time of the index fracture. Fragility fractures and osteoporosis diagnoses were identified from ICD-9-CM codes. Treatment for osteoporosis included oral and injectable therapies identified by National Drug Code numbers and Healthcare Common Procedure Coding System codes. Diagnosis and treatment rates were assessed during the 1-year periods before and after the index fracture. All analyses were conducted by fracture type (vertebral, hip, nonhip/nonvertebral [NHNV], and multiple), with stratification by age and sex. No comparisons were made between the Medicare and Commercial groups; rather, McNemar tests were used to compare prefracture versus postfracture diagnosis and treatment rates within each group.
RESULTS:
For inclusion in the Medicare group, 45,603 patients were identified, and 54,145 patients were identified for the Commercial group. In the prefracture period, the osteoporosis diagnosis rates ranged from 12.0% (NHNV) to 21.5% (vertebral) in the Medicare group and from 5.3% (NHNV) to 12.1% (vertebral) in the Commercial group. In the postfracture period, diagnosis rates significantly increased (P < 0.001)—and nearly doubled—for all fracture types but did not exceed 42.1% (vertebral) in the Medicare group and 27.7% (vertebral) in the Commercial group. Pre-index treatment rates were similarly low, ranging from 9.4% (hip) to 16.6% (vertebral) among Medicare patients, and 7.5% (NHNV) to 14.4% (vertebral) in Commercial patients. Osteoporosis treatment rates improved significantly in the postfracture year, ranging from 12.5% (NHNV) to 26.5% (vertebral) among Medicare patients, and 8.3% (NHNV) to 21.4% (vertebral) in Commercial patients. Larger increases in diagnosis rates and smaller increases in treatment rates were observed in stratified analyses of men and women and of different age groups, with women and older patients having higher overall rates of diagnosis and treatment before and after fracture.
CONCLUSIONS:
In men and women, osteoporosis diagnosis rates were low before the index fracture and improved substantially after the fracture, yet still remained low overall (under 50%). Osteoporosis treatment rates among patients experiencing a fracture were low before the index fracture and improved only minimally afterwards.
What is already known about this subject
A lack of diagnosis and treatment is common among patients with osteoporotic fractures.
Osteoporosis diagnosis and treatment rates increase after a fracture.
What this study adds
Among all of the patients included in this analysis, diagnosis and treatment rates increased significantly from the prefracture to the postfracture period for all fracture types.
Before and after a fracture, women were diagnosed and treated more frequently than men.
Prefracture and postfracture diagnosis and treatment rates increased with age, with some leveling off observed in the oldest age groups.
Osteoporosis is described by the National Osteoporosis Foundation (NOF) as low bone mass that leads to decreased bone strength and an increased risk of low-trauma fractures.1 Data from the National Health and Nutrition Examination Surveys (NHANES) of 2005-2010 show that 54 million Americans aged 50 years or older have osteoporosis or osteopenia.2 Among those identified with osteoporosis or osteopenia in NHANES, 66% were women and 34% were men.2 An estimated 50% of women and 20% of men in the United States will sustain an osteoporotic fracture in their lifetime.1
Osteoporosis can be diagnosed by bone mineral density (BMD) testing before a fracture occurs.1 The World Health Organization has defined osteoporosis as having BMD equal to or more than 2.5 standard deviations below the mean BMD of a young adult reference population (i.e., T-score ≤ -2.5).3 However, many low-trauma fractures occur in people with T-scores > -2.5.4-6 Thus, a clinical diagnosis of osteoporosis may also be given based on the occurrence of low-trauma fracture, defined as fractures due to falls from standing height or less,7 as described in the NOF guidelines and recommended by the National Bone Health Alliance.1,8 The NOF recommends pharmacologic treatment for patients with T-score ≤ -2.5 at the lumbar spine, total hip, or femoral neck; with a T-score between -1.0 and -2.5 and high 10-year probability of fracture; or with hip or vertebral fracture.1
In U.S. clinical practice, diagnosis and treatment rates fall well below the standard set by the NOF guidelines.9 More specifically, among 118 adult patients admitted to a university hospital in Colorado with a low-trauma hip fracture, only 26% had received a formal diagnosis of osteoporosis in the subsequent year.10 Similarly, of 93 patients aged ≥ 65 years, who were hospitalized with a fragility fracture in Hawaii, just 24% received a diagnosis of osteoporosis within 6 months.11 Reported postfracture treatment rates of U.S. patients range from < 1% to 10% in men10,12-14 and 4% to 45% in women.10,12,14-21 Studies reporting pre- and postfracture rates of diagnosis13,20,22 and treatment10,15,20,22-25 have shown that both rates increase after a fracture. However, very few of these studies tested the statistical significance of the increase, causing uncertainty regarding whether it is due to chance.
Based on the differences in cost,22,26 mortality,27,28 and quality of life29 among patients with the common types of osteoporotic fracture, we hypothesized that diagnosis and treatment rates would differ by fracture type. The objective of this study was to compare the prevalence of diagnosis and treatment of osteoporosis before and after fractures of the vertebrae, hip, and nonhip/nonvertebral (NHNV) sites. Analyses were further stratified by sex and age of the patients.
Methods
Data Source and Study Design
This was a retrospective claims analysis using data from 2 large administrative claims databases in the United States. Both databases contain medical and pharmacy claims and laboratory test results. The Humana database includes patients with Medicare Advantage plans. The Optum Insight Clinformatics Data Mart is a nationwide database containing demographic, medical, and pharmacy data on commercially insured patients. All data were de-identified; therefore, patient informed consent and institutional review were not required.
The study period began on January 1, 2007, and ended on December 31, 2014. The index date was defined as the date of the first claim for a qualifying fracture (vertebral, hip, or NHNV) between January 1, 2008, and December 31, 2013 (the index period). The 12-month period immediately preceding the index date was defined as the prefracture period, and the 12-month period following the index date was defined as the postfracture period. Diagnosis and treatment rates were assessed in the prefracture and postfracture periods.
Study Sample
Patients in the Humana database constituted the Medicare group, and those in the Optum database made up the Commercial group. Eligible patients were aged ≥ 65 years in the Medicare group and aged ≥ 50 years in the Commercial group on the index date. Patients are not eligible for Medicare coverage until the age of 65; however, individuals aged 50 years and older have been identified as being at risk for osteoporosis, so patients aged 50 years and older were included in the Commercial group. All patients had a claim for a fracture during the index period. Patients were required to be continuously enrolled in a health plan during the pre- and postfracture periods.
Patients were excluded from the study if there was a diagnosis of metastatic cancer, bone cancer, multiple myeloma, osteomalacia, hypophosphatasia, osteogenesis imperfecta, benign bone tumors, primary or secondary hyperparathyroidism, or vitamin D deficiency during the prefracture period. Patients with medical claims for Paget’s disease, drug-induced osteoporosis, or a fracture in the prefracture period at the same site (i.e., with the same diagnostic code) as the index fracture were also excluded.
Study Variables and Outcomes
Qualifying fractures were identified by International Classification of Diseases, Ninth Revision, Clinical Modification (ICD-9-CM) codes. All fractures were closed fractures. Vertebral and hip fractures were defined as fractures of the spine (ICD-9-CM codes 733.13, 805.2x, 805.4x, 805.6x, 805.8x) and upper femur (733.14, 820.0x, 820.2x, 820.8x), respectively. NHNV fractures were those of the ankle or foot (824.0x, 824.2x, 824.4x, 924.6x, 824.8x, 825.25, 733.94); clavicle (810.0x); femur (733.15, 821.0x, 820.22, and 733.15); tibia or fibula (733.16, 733.93, 823.0x, 823.2x, 823.8x, 733.93); wrist, hand, forearm (radius and ulna 733.12, 813.0x, 813.2x, 813.4x, 813.8x, 814.0x, 815.02); humerus (733.11, 812.0x, 812.2x, 812.4x); patella (822.0x); pelvis (808.0x, 808.2x, 808.4x, 808.8x); scapula (811.00, 811.01, 811.02, 811.03, 811.09); or ribs (807.01, 807.02, 807.09). Multiple fractures were defined as those that occurred on the same date at more than 1 of the previously mentioned fracture sites.
An osteoporosis diagnosis was determined by the ICD-9-CM code 733.0x in the primary or secondary position on the claim. Osteoporosis treatment included oral and injectable forms of therapy determined by the presence of Healthcare Common Procedure Coding System (HCPCS) codes and National Drug Code (NDC) numbers as appropriate. Oral therapies included alendronate, risedronate, ibandronate, raloxifene, and teriparatide. Injectable therapies included ibandronate (J1740 plus NDC numbers), zoledronic acid (J3488, Q2051 plus NDC numbers), and denosumab (C9272, J0897 plus NDC numbers). All NDC numbers are available on the NDC website.30 Osteoporosis treatment was not identified by prescription dispensing data.
Other patient characteristics assessed during the prefracture period were pain-related medication use (i.e., analgesics including acetaminophen, nonsteroidal anti-inflammatory agents [NSAIDs], and opioids); falls; gastrointestinal events; and use of gastroprotective agents. A history of falls was identified by ICD-9-CM code V15.88. Gastrointestinal events were identified by ICD-9-CM and Current Procedural Terminology codes and included nausea/vomiting, dysphagia, and esophagitis; gastroesophageal reflux disease; ulcer, stricture, perforation, or hemorrhage of the esophagus; gastric, duodenal, or peptic ulcers; acute gastritis; duodenitis; and gastrointestinal hemorrhage. Gastroprotective agents included proton pump inhibitors, H2 receptor antagonists, and cytoprotectants. Comorbidities commonly observed in osteoporosis patients were identified by ICD-9-CM codes and included hypertension, arthritis, musculoskeletal pain, respiratory diseases, Alzheimer’s disease, dementia, depression, anxiety, sleep disorders, diabetes, cardiovascular diseases, and hypothyroidism. The Charlson Comorbidity Index score was calculated using a subset of 17 comorbidities as described by Deyo et al. (1992).31
Statistical Analysis
This study was primarily descriptive in nature, and no comparisons were made between the Medicare group and the Commercial group. Descriptive statistics, such as frequencies and percentages for baseline characteristics and comorbidities, were calculated. Rates of diagnosis and treatment were determined by dividing the number of patients who were diagnosed or treated in the pre- and postfracture periods by the total sample size. The statistical significance of the differences in the percentages of patients diagnosed or treated in the prefracture period versus the postfracture period (overall and by fracture type) was determined using McNemar tests. The statistical tests were repeated after stratification of the results by patient sex and age. P values < 0.05 were considered statistically significant.
Results
Characteristics of the Study Population
The Medicare group consisted of 45,603 patients with a mean age of 78.1 years (Appendix A, available in online article). A plurality of patients (42.8%) were aged 70-79 years, and 28.1% were male. Approximately one fifth of the Medicare group had used fracture-related medications (18.2%), NSAIDs (21.8%), and glucocorticoids (20.4%) in the pre-index period. The most frequent comorbidities were hypertension (71.8% of patients) and arthritis (50.0%).
The mean age of the 54,145 patients in the Commercial group was 61.8 years (Appendix A). About half of this group (49.8%) was aged 50-59 years, and 37.9% of the patients were male. Fracture-related medications, NSAIDs, and glucocorticoids were used by 19.8%, 23.1%, and 17.7% of patients, respectively, in the pre-index period. Similar to the Medicare group, the most frequent comorbidities were hypertension (45.4% of patients) and arthritis (37.0%).
Diagnosis of Osteoporosis Before and After Fracture
In the Medicare group, overall osteoporosis diagnosis rates were 14.3% before fracture and 26.3% after fracture (Figure 1A). In the Commercial group, diagnosis rates increased from 6.3% in the prefracture period to 11.1% in the postfracture period (P < 0.001; Figure 1B). In both groups, diagnosis rates increased significantly from the prefracture to the postfracture periods for all fracture types (P < 0.001), with the largest increases observed for vertebral fracture patients (Figure 1A-B). Descriptively, prefracture and postfracture diagnosis rates were highest in patients with vertebral fractures: 21.5% and 42.1%, respectively, in the Medicare group (Figure 1A), and 12.1% and 27.7%, respectively, in the Commercial group (Figure 1B).
FIGURE 1.

Diagnosis Rates by Fracture Type in Medicare and Commercial Groups
When the patients were stratified by sex, it was immediately apparent that women were numerically more frequently diagnosed with osteoporosis than men across all fracture types, before and after fracture (Figure 2). In the Medicare group (Figure 2A), women’s overall prefracture and postfracture diagnosis rates were 18.8% and 33.2%, compared with 3.0% and 8.9%, respectively, among men (P < 0.001 for the increase in men). In the Commercial group (Figure 2B), the overall prefracture and postfracture diagnosis rates increased from 9.5% to 16.0% in women and from 1.1% to 3.1% in men (P < 0.001 for both increases). Similar to the combined study population, there was a significant increase in the diagnosis rate from the prefracture to the postfracture period for all fracture types (P < 0.001; Figure 2A-B). Descriptively, an osteoporosis diagnosis was most common in men and women with vertebral versus other types of fractures. For corresponding fracture types, the prefracture to postfracture increases in diagnosis rates were numerically larger in women than in men (i.e., women gained more percentage points). Among men in both groups, the largest prefracture to postfracture increase in diagnosis rates was observed in patients with vertebral fractures (16.1 percentage points in the Medicare group, 8.6 in the Commercial group; Figure 2A-B). The largest prefracture to postfracture increases in women were observed in those with hip fractures in the Medicare group (23.0 percentage points; Figure 2A) and those with vertebral fractures in the Commercial group (20.4 percentage points; Figure 2B).
FIGURE 2.

Diagnosis Rates in Medicare and Commercial Groups, Stratified by Sex
When the patients were stratified by age, a trend towards higher diagnosis rates for older patients, before and after fracture, was readily observed (Figure 3). Prefracture and postfracture diagnosis rates were, respectively, 9.8% and 17.8% for ages 65-69 years and 19.4% and 37.1% for ages ≥ 90 years in the Medicare group (Figure 3A) and 3.4% and 6.3% for ages 50-59 years and 16.8% and 31.2% for ages 80-89 years in the Commercial group (Figure 3B). For all age strata in both groups, there was a significant increase in osteoporosis diagnosis rates between the prefracture and postfracture periods (P < 0.001). Descriptively, the increases became larger with older age: the differentials between prefracture and postfracture diagnosis rates were 8.0, 10.8, 14.9, and 17.7 percentage points for ages 65-69, 70-79, 80-90, and ≥ 90 years in the Medicare group (Figure 3A) and 2.9, 4.2, 5.3, 8.2, and 14.4 percentage points for ages 50-59, 60-64, 65-69, 70-79, and 80-89 years in the Commercial group (Figure 3B). Across all age strata in both groups, prefracture and postfracture diagnosis rates were highest in patients with vertebral fractures, and with the exception of patients aged ≥ 90 years in the Medicare group, the prefracture to postfracture increase in diagnosis rates was greatest in patients with vertebral fractures (Appendix B, available in online article).
FIGURE 3.

Diagnosis and Treatment Rates for All Fracture Types Combined in Medicare and Commercial Groups, Stratified by Age
Treatment of Osteoporosis Before and After Fracture
In the Medicare group, overall osteoporosis treatment rates increased from 11.7% in the prefracture period to 15.8% in the postfracture period (P < 0.001; Figure 4A). In the Commercial group, treatment rates increased from 8.5% in the prefracture period to 10.1% in the postfracture period (P < 0.001; Figure 4B). In both groups, treatment rates increased significantly from the prefracture to postfracture periods for all fracture types (P < 0.001; Figure 4A-B). Descriptively, prefracture and postfracture treatment rates were highest in patients with vertebral fractures: 16.6% and 26.5%, respectively, in the Medicare group (Figure 4A) and 14.4% and 21.4%, respectively, in the Commercial group (Figure 4B). Also, the largest prefracture to postfracture increases were observed for vertebral fracture patients.
FIGURE 4.
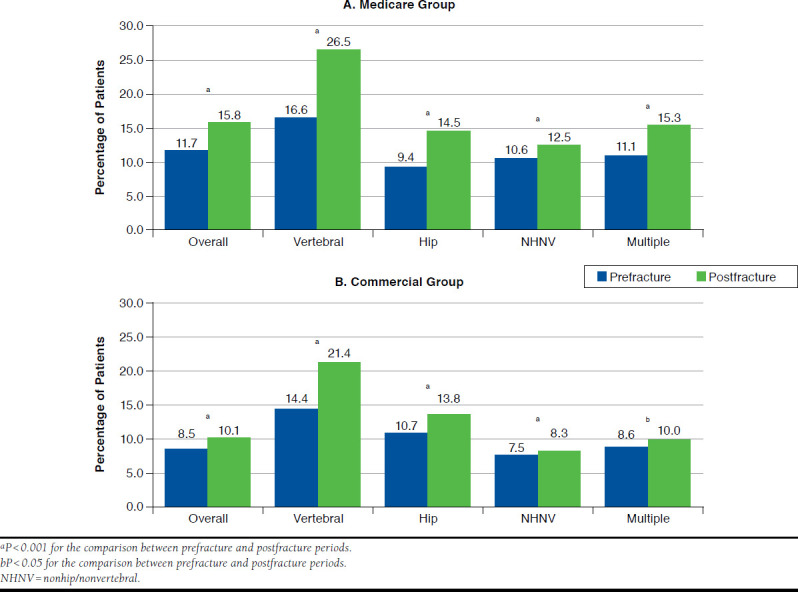
Treatment Rates by Fracture Type in Medicare and Commercial Groups
When patients were stratified by sex, treatment for osteoporosis was found to be more frequent in women than men across all fracture types, before and after fracture (Figure 5). In the Medicare group (Figure 5A), women’s overall treatment rates increased from 15.7% to 20.5% (P < 0.001) versus from 1.5% to 3.9% in men (P < 0.001). In the Commercial group (Figure 5B), the overall prefracture and postfracture treatment rates were 13.0% and 15.1%, respectively, in women and 1.0% and 1.8%, respectively, in men (P < 0.001 for both increases). In men and women, there was a significant increase in the treatment rate from the prefracture to postfracture periods for all fracture types (with the exception of men with multiple fractures in the Commercial group; P < 0.001; Figure 5A-B). Descriptively, treatment for osteoporosis in men and women was most common in those with vertebral fractures. In both study groups, patients with vertebral fractures had the largest increases in the prefracture to postfracture treatment rates, and the increases were larger for women than for men (i.e., women gained more percentage points; Figure 5A-B).
FIGURE 5.

Treatment Rates in Medicare and Commercial Groups, Stratified by Sex
Stratification of treatment rates by age revealed a slight upward trend in prefracture and postfracture treatment rates with age in the Medicare group (Figure 3C) and a stronger trend in the Commercial group (Figure 3D). For all age strata in both groups, there was a significant increase in osteoporosis treatment rates between the prefracture and postfracture periods (P < 0.001). Descriptively, the largest prefracture to postfracture increases were observed in Medicare patients aged 80-89 years (14.1% prefracture to 18.8% postfracture; Figure 3C) and Commercial patients aged 70-79 years (16.5% prefracture to 19.3% postfracture; Figure 3D). Across all age strata in both groups, treatment rates were highest in patients with vertebral fractures, and the prefracture to postfracture increase in diagnosis rates was greatest in patients with vertebral fractures (Appendix B). In the Commercial group, only patients with vertebral fractures exhibited a significant increase in treatment rates across all age strata (Appendix B).
Discussion
Study Summary
This parallel analysis of commercially insured and Medicare cohorts of older men and women demonstrated that rates of diagnosis and treatment of osteoporosis increase significantly after a fracture. The amount of increase was greater for diagnosis than for treatment and was found to depend on the type of fracture and the sex and age of the patient. Diagnosis and treatment rates were highest in patients with vertebral fracture and in older patients before and after the fracture. Furthermore, our descriptive analysis showed that diagnosis and treatment rates were higher in women compared with men before and after the fracture.
Diagnosis Rates
Several previous U.S. studies have reported rates of osteoporosis diagnosis before and after a fracture. Shepherd et al. (2012) assessed the medical claims of 17,700 U.S. men aged ≥ 65 years with an incident osteoporotic fracture and found ICD-9-CM diagnosis codes for osteoporosis in 2.7% before the fracture and 19.9% after the fracture.13 Among 147 women aged 50-84 years treated at a Massachusetts medical center for hip or wrist fractures, self-reported rates of osteoporosis diagnoses were 22% before the fracture and 29% after the fracture.20 In an analysis of administrative claims of 46,600 men and women aged ≥ 45 years with an index fracture between June 2002 and June 2006, diagnosis rates in commercially insured subjects increased from 7%-14% before the fracture to 11%-30% after the fracture, depending on fracture type.22 The corresponding diagnosis rates among Medicare beneficiaries were 15%-30% before and 26%-55% after the fracture.22 Patients with vertebral fractures versus hip or NHNV fractures were the most likely to have an osteoporosis diagnosis before and after the fracture.22 Our results are consistent with these previous findings, but they also showed descriptively that women are diagnosed with osteoporosis more frequently than men, in agreement with another U.S. study showing that, in the year after hospitalization for a low-trauma fracture, 36% of women versus just 7% of men received an osteoporosis diagnosis.10 The implications of an osteoporosis diagnosis for postfracture treatment are discussed in more detail below.
Treatment by Fracture Type
Several large studies of U.S. patients have shown that postfracture treatment for osteoporosis is most common among patients with a vertebral fracture. In the study by Shepherd et al., treatment rates in the year after the fracture were 17% in men with a vertebral fracture, 7% in men with a hip fracture, and 5% in men with fractures at other sites.13 Vertebral and hip fractures were predictive of treatment in multivariate logistic regression analyses (odds ratios [ORs] = 2.2 and 1.6, respectively).13 Among 3,500 U.S. women aged ≥ 60 years with an inpatient or outpatient diagnosis for a fracture of the vertebrae, hip, or wrist, postfracture treatment rates were 44%, 21%, and 23%, respectively.15 In adjusted regression analyses, the odds of treatment were greater for women with vertebral fractures versus hip fractures (OR = 2.61).15 In the Global Longitudinal Study of Osteoporosis in Women, 17% of the 1,100 women aged ≥ 55 years with an incident fracture in the first year after the baseline assessment reported receiving treatment for osteoporosis.32 Patient-reported treatment rates were highest in those with vertebral fractures (42%), followed by multiplesite fractures (35%), hip fractures (26%), other nonvertebral fractures (17%), and wrist fractures (14%).32 Compared with NHNV fractures, the occurrence of vertebral, multiple-site, and hip fractures increased the odds of osteoporosis treatment by 6.6-fold, 3.8-fold, and 2.6-fold respectively.32
Finally, in a claims analysis of 131,000 U.S. women and men experiencing an incident fragility fracture between 2001 and 2009, initiation of treatment in the year after fracture was most common in patients with vertebral fractures (32% of women, 17% of men), followed by hip (20% of women, 9% of men), wrist (11% of women, 2% of men), and humeral fractures (11% of women, 3% of men).14 The time to treatment initiation was 45 days in patients with vertebral fractures, compared with 88 days in patients with hip fractures, and 110 and 112 days, respectively, in those with wrist and humeral fractures.14
We observed an increase in postfracture treatment rates in patients with all fractures types, with no instances of decreased treatment rates after fracture. This finding is consistent with most previous studies in the United States. In 2 studies of U.S. women with a fracture, treatment rates increased from 13% before the fracture to 24% after the fracture based on analyses of medical claims and from 28% before the fracture to 42% after the fracture based on patient reports.15,20 In 2 other studies of mixed male and female populations hospitalized with hip fractures, treatment rates increased from 17.2%25 and 19%10 before hospitalization to 24.0% and 26%, respectively, in the year after the fracture. In the parallel Medicare and commercial analysis cited previously, prefracture and postfracture treatment rates were 10%-14% and 13%-25%, respectively, in the Medicare cohort and 8%-14% and 11%-23%, respectively, in the commercial cohort (depending on fracture type).22
Treatment by Sex and Age
To our knowledge, our study is unique in reporting pre- and postfracture treatment rates separately in men and women. Previous U.S. studies comparing pre- and postfracture treatment rates were carried out in women only or in mixed populations.10,15,20-25 We found that, before and after a fracture, women were treated more frequently than men and that postfracture increases in treatment were larger in women. Based on the reported prevalence of osteoporosis in U.S. men and women,33 a lower treatment rate before fracture in men is justified. In addition, previous studies have reported that treatment rates vary by gender, with women having higher odds of treatment compared with men.34,35 However, based on the fact that a first fracture increases the risk of a subsequent fracture, postfracture treatment is recommended by the NOF for men and women.1 Consequently, our findings highlight a gap in clinical practice with regard to men with fractures.
Our study is also unique in reporting pre- and postfracture diagnosis and treatment rates by age group. Prefracture and postfracture diagnosis and treatment rates increased with age, with some leveling off observed in the oldest age groups. This finding differs markedly from the findings of Freedman et al. (2000) in their analysis of claims data from women aged ≥ 55 years who sustained a distal radial fracture in 1994-1997.19 In their study, the highest postfracture treatment rate was seen in patients aged 55-59 years (36.0%), with progressive declines among those aged 60-64 (28.5%), 65-69 (24.3%), 70-74 (21.4%), and 75-79 (21.4%) years. Treatment rates peaked again for those aged 80-84 years (25.7%) and declined thereafter in patients aged 85-89 (9.1%), 90-94 (4.2%), and ≥ 95 (4.7%) years. The Freedman et al. study differs from ours in the type of fracture assessed, and since our data suggest that the type of fracture can influence treatment rates, the study results may not be directly comparable.
Our findings are consistent with the many previous studies that have found older age to be predictive of treatment for osteoporosis in patients with fractures.12-17,21 Although our study was not designed to make comparisons between the cohorts, the older age of the Medicare group likely affected the rates of diagnosis and treatment, producing higher overall diagnosis and treatment rates in this group that are consistent with our findings across age strata.
Limitations
This study has some limitations to consider. First, because of the study design treatment was not assessed in the subset of patients with a coded osteoporosis diagnosis. On the assumption that treatment would follow from diagnosis, and given the finding of several groups that a diagnosis of osteoporosis is significantly predictive of treatment,13,21,32 it would be of interest to compare treatment rates in patients with and without a diagnosis as a function of sex and age.
Second, this analysis was limited in its generalizability to patients with fractures. Third, the use of ICD-9-CM codes in medical and pharmacy claims to identify diagnosis and treatment of osteoporosis is limiting because of variations, errors, or omissions in coding. The use of ICD-9-CM codes to select patients with a fracture is subject to limitations in accurately identifying fragility fractures. However, this methodology has been used in other previously published observational studies.10,13,20,22 Finally, to minimize potential error due to coding, we limited this analysis to closed fractures and fracture sites most commonly associated with osteoporosis.36
Conclusions
This descriptive analysis of U.S. men and women who sustained fractures showed that diagnosis and treatment rates were low before the fractures occurred and increased significantly after the fractures, yet still remained below the levels recommended by national guidelines. Diagnosis and treatment were most common in patients with vertebral fractures, although NHNV fractures were the most numerous. These findings identify unmet needs in the diagnosis and management of patients at high risk for fracture and highlight the need for strategies to improve the care of patients with osteoporosis and reduce the burden of osteoporotic fractures.
APPENDIX A. Characteristics of Patients in Medicare and Commercial Groups
| Medicare Group | |||||
|---|---|---|---|---|---|
| Overall (N = 45,603) | Vertebral (n = 9,465) | Hip (n = 5,024) | NHNV (n = 27,657) | Multiple (n = 3,457) | |
| Index age, mean (SD) years | 78.1 (10.6) | 79.7 (10.7) | 82.7 (11.6) | 76.5 (9.9) | 79.8 (11.3) |
| Age group, years, n (%) | |||||
| 50-59 | – | – | – | – | – |
| 60-64 | – | – | – | – | – |
| 65-69 | 10,292 (22.6) | 1,582 (16.7) | 586 (11.7) | 7,442 (26.9) | 682 (19.7) |
| 70-79 | 19,498 (42.8) | 3,932 (41.5) | 1,739 (34.6) | 12,505 (45.2) | 1,322 (38.2) |
| 80-89 | 9,281 (20.4) | 2,336 (24.7) | 1,390 (27.7) | 4,750 (17.2) | 805 (23.3) |
| ≥ 90 | 6,532 (14.3) | 1,615 (17.1) | 1,309 (26.1) | 2,960 (10.7) | 648 (18.7) |
| Sex, n (%) | |||||
| Male | 12,828 (28.1) | 2,702 (28.6) | 1,334 (26.6) | 7,793 (28.2) | 999 (28.9) |
| Female | 32,775 (71.9) | 6,763 (71.5) | 3,690 (73.5) | 19,864 (71.8) | 2,458 (71.1) |
| Pre-index medication use, n (%) | |||||
| Pain-related medication use | 8,317 (18.2) | 2,075 (21.9) | 838 (16.7) | 4,886 (17.7) | 518 (15.0) |
| Gastroprotective agents | |||||
| PPI | 9,603 (21.1) | 2,269 (24.0) | 962 (19.2) | 5,719 (20.7) | 653 (18.9) |
| H2 receptor antagonist | 2,179 (4.8) | 541 (5.7) | 275 (5.5) | 1,215 (4.4) | 148 (4.3) |
| Cytoprotectant | 523 (1.2) | 158 (1.7) | 64 (1.3) | 263 (1.0) | 38 (1.1) |
| NSAIDs | 9,931 (21.8) | 2,433 (25.7) | 1,000 (19.9) | 5,876 (21.3) | 622 (18.0) |
| Glucocorticoids | 9,300 (20.4) | 2,404 (25.4) | 905 (18.0) | 5,382 (19.5) | 609 (17.6) |
| Estrogens | 939 (2.1) | 185 (2.0) | 75 (1.5) | 637 (2.3) | 42 (1.2) |
| Gastrointestinal events | 15,868 (34.8) | 3,922 (41.4) | 1,736 (34.6) | 9,075 (32.8) | 1,135 (32.8) |
| History of falls | 3,493 (7.7) | 785 (8.3) | 402 (8.0) | 2,097 (7.6) | 209 (6.1) |
| Charlson Comorbidity Index, mean (SD) score | 0.64 (1.21) | 0.71 (1.24) | 0.76 (1.32) | 0.60 (1.17) | 0.63 (1.25) |
| Common osteoporosis-related comorbidities,a n (%) | |||||
| Hypertension | 32,751 (71.8) | 7,022 (74.2) | 3,660 (72.9) | 19,672 (71.1) | 2,397 (69.3) |
| Arthritis | 22,816 (50.0) | 5,305 (56.0) | 2,616 (52.1) | 13,352 (48.3) | 1,543 (44.6) |
| Musculoskeletal pain | 16,867 (37.0) | 5,812 (61.4) | 1,531 (30.5) | 8,548 (30.9) | 976 (28.2) |
| Respiratory diseases | 14,801 (32.5) | 3,570 (37.7) | 1,560 (31.1) | 8,629 (31.2) | 1,042 (30.1) |
| Alzheimer’s disease, dementia, depression, anxiety, sleep disorders | 13,742 (30.1) | 3,012 (31.8) | 1,741 (34.7) | 7,999 (28.9) | 990 (28.6) |
| Diabetes | 12,958 (28.4) | 2,529 (26.7) | 1,320 (26.3) | 8,132 (29.4) | 977 (28.3) |
| Cardiovascular diseases | 10,661 (23.4) | 2,538 (26.8) | 1,214 (24.2) | 6,109 (22.1) | 800 (23.1) |
| Hypothyroidism | 9,388 (20.6) | 2,159 (22.8) | 1,049 (20.9) | 5,489 (19.9) | 691 (20.0) |
| Commercial Group | |||||
| Overall (N = 54,145) | Vertebral (n = 5,799) | Hip (n = 2,385) | NHNV (n = 42,666) | Multiple (n = 3,295) | |
| Index age, mean (SD) years | 61.8 (8.9) | 66.1 (10.9) | 70.8 (11.5) | 60.7 (7.8) | 63.0 (9.9) |
| Age group, years, n (%) | |||||
| 50-59 | 26,968 (49.8) | 2,045 (35.3) | 527 (22.1) | 22,828 (53.5) | 1,568 (47.6) |
| 60-64 | 14,077 (26.0) | 1,321 (22.8) | 440 (18.5) | 11,519 (27.0) | 797 (24.2) |
| 65-69 | 4,258 (7.9) | 503 (8.7) | 186 (7.8) | 3,342 (7.8) | 227 (6.9) |
| 70-79 | 4,212 (7.8) | 775 (13.4) | 380 (15.9) | 2,774 (6.5) | 283 (8.6) |
| 80-89 | 4,630 (8.6) | 1,155 (19.9) | 852 (35.7) | 2,203 (5.2) | 420 (12.8) |
| ≥ 90 | 0 (0.0) | 0 (0.0) | 0 (0.0) | 0 (0.0) | 0 (0.0) |
| Sex, n (%) | |||||
| Male | 20,496 (37.9) | 2,370 (40.9) | 829 (34.8) | 15,700 (36.8) | 1,597 (48.5) |
| Female | 33,647 (62.1) | 3,427 (59.1) | 1,556 (65.2) | 26,966 (63.2) | 1,698 (51.5) |
| Pre-index medication use, n (%) | |||||
| Pain-related medication use | 10,709 (19.8) | 1,492 (25.7) | 466 (19.5) | 8,221 (19.3) | 530 (16.1) |
| Gastroprotective agents | |||||
| PPI | 7,875 (14.5) | 1,123 (19.4) | 395 (16.6) | 5,924 (13.9) | 433 (13.1) |
| H2 receptor antagonist | 360 (0.7) | 57 (1.0) | 22 (0.9) | 260 (0.6) | 21 (0.6) |
| Cytoprotectant | 566 (1.1) | 78 (1.4) | 31 (1.3) | 425 (1.0) | 32 (1.0) |
| NSAIDs | 12,531 (23.1) | 1,676 (28.9) | 523 (21.9) | 9,713 (22.8) | 619 (18.8) |
| Glucocorticoids | 9,602 (17.7) | 1,454 (25.1) | 411 (17.2) | 7,224 (16.9) | 513 (15.6) |
| Estrogens | 2,569 (4.7) | 279 (4.8) | 77 (3.2) | 2,102 (4.9) | 111 (3.4) |
| Gastrointestinal events | 13,238 (24.5) | 1,948 (33.6) | 705 (29.6) | 9,879 (23.2) | 706 (21.4) |
| History of falls | 2,402 (4.4) | 338 (5.8) | 153 (6.4) | 1,776 (4.2) | 135 (4.1) |
| Charlson Comorbidity Index, mean (SD) score | 0.71 (1.26) | 0.99 (1.47) | 1.24 (1.65) | 0.64 (1.19) | 0.73 (1.29) |
| Common osteoporosis-related comorbidities,a n (%) | |||||
| Hypertension | 24,592 (45.4) | 3,205 (55.3) | 1,402 (58.8) | 18,469 (43.3) | 1,516 (46.0) |
| Arthritis | 20,026 (37.0) | 2,785 (48.0) | 1,152 (48.3) | 15,080 (35.3) | 1,009 (30.6) |
| Musculoskeletal pain | 15,434 (28.5) | 3,354 (57.8) | 732 (30.7) | 10,578 (24.8) | 770 (23.4) |
| Respiratory diseases | 12,505 (23.1) | 1,733 (29.9) | 575 (24.1) | 9,525 (22.3) | 672 (20.4) |
| Alzheimer’s disease, dementia, depression, anxiety, sleep disorders | 11,139 (20.6) | 1,453 (25.1) | 679 (28.5) | 8,326 (19.5) | 681 (20.7) |
| Diabetes | – | – | – | – | – |
| Cardiovascular diseases | – | – | – | – | – |
| Hypothyroidism | – | – | – | – | – |
aOnly comorbidities present in > 20% of patients are listed.
NHNV = nonhip/nonvertebral; NSAID = nonsteroidal anti-inflammatory drug; PPI = proton pump inhibitor; SD = standard deviation.
APPENDIX B. Rate of Diagnosis and Treatment in Medicare and Commercial Groups, Stratified by Age
| Index Group | N | Medicare Group | |||||
|---|---|---|---|---|---|---|---|
| Rate of Diagnosis | Rate of Treatment | ||||||
| Prefracture n (%) | Postfracture n (%) | P Value | Prefracture n (%) | Postfracture n (%) | P Value | ||
| 50-59 years | |||||||
| Vertebral | – | – | – | – | – | – | – |
| Hip | – | – | – | – | – | – | – |
| NHNV | – | – | – | – | – | – | – |
| Multiple | – | – | – | – | – | – | – |
| 60-64 years | |||||||
| Vertebral | – | – | – | – | – | – | – |
| Hip | – | – | – | – | – | – | – |
| NHNV | – | – | – | – | – | – | – |
| Multiple | – | – | – | – | – | – | – |
| 65-69 years | |||||||
| Vertebral | 1,582 | 236 (14.9) | 511 (32.3) | < 0.001 | 185 (11.7) | 337 (21.3) | < 0.001 |
| Hip | 586 | 59 (10.1) | 157 (26.8) | < 0.001 | 51 (8.7) | 87 (14.8) | < 0.001 |
| NHNV | 7,442 | 654 (8.8) | 1,040 (14.0) | < 0.001 | 650 (8.7) | 768 (10.3) | < 0.001 |
| Multiple | 682 | 60 (8.8) | 121 (17.7) | < 0.001 | 51 (7.5) | 71 (10.4) | 0.0045 |
| 70-79 years | |||||||
| Vertebral | 3,932 | 789 (20.1) | 1,566 (39.8) | < 0.001 | 615 (15.6) | 1,027 (26.1) | < 0.001 |
| Hip | 1,739 | 213 (12.2) | 469 (27.0) | < 0.001 | 154 (8.9) | 242 (13.9) | < 0.001 |
| NHNV | 12,505 | 1,441 (11.5) | 2,343 (18.7) | < 0.001 | 1,271 (10.2) | 1,530 (12.2) | < 0.001 |
| Multiple | 1,322 | 180 (13.6) | 364 (27.5) | < 0.001 | 152 (11.5) | 207 (15.7) | < 0.001 |
| 80-89 years | |||||||
| Vertebral | 2,336 | 566 (24.2) | 1,108 (47.4) | < 0.001 | 446 (19.1) | 675 (28.9) | < 0.001 |
| Hip | 1,390 | 203 (14.6) | 473 (34.0) | < 0.001 | 132 (9.5) | 196 (14.1) | < 0.001 |
| NHNV | 4,750 | 711 (15.0) | 1,130 (23.8) | < 0.001 | 630 (13.3) | 735 (15.5) | < 0.001 |
| Multiple | 805 | 155 (19.3) | 304 (37.8) | < 0.001 | 99 (12.3) | 142 (17.6) | < 0.001 |
| ≥ 90 yearsa | |||||||
| Vertebral | 1,615 | 447 (27.7) | 797 (49.3) | < 0.001 | 325 (20.1) | 465 (28.8) | < 0.001 |
| Hip | 1,309 | 189 (14.4) | 526 (40.2) | < 0.001 | 133 (10.2) | 205 (15.7) | < 0.001 |
| NHNV | 2,960 | 503 (17.0) | 828 (28.0) | < 0.001 | 376 (12.7) | 428 (14.5) | < 0.001 |
| Multiple | 648 | 130 (20.1) | 275 (42.4) | < 0.001 | 80 (12.3) | 110 (17.0) | < 0.001 |
| Index Group | Commercial Group | ||||||
| N | Rate of Diagnosis | Rate of Treatment | |||||
| Prefracture n (%) | Postfracture n (%) | P Value | Prefracture n (%) | Postfracture n (%) | P Value | ||
| 50-59 years | |||||||
| Vertebral | 2,045 | 116 (5.7) | 328 (16.0) | < 0.001 | 130 (6.4) | 251 (12.3) | < 0.001 |
| Hip | 527 | 28 (5.3) | 71 (13.5) | < 0.001 | 32 (6.1) | 55 (10.4) | < 0.001 |
| NHNV | 22,828 | 727 (3.2) | 1,195 (5.2) | < 0.001 | 1,048 (4.6) | 1,248 (5.5) | < 0.001 |
| Multiple | 1,568 | 40 (2.6) | 111 (7.1) | < 0.001 | 54 (3.4) | 75 (4.8) | 0.0038 |
| 60-64 years | |||||||
| Vertebral | 1,321 | 121 (9.2) | 279 (21.1) | < 0.001 | 144 (10.9) | 225 (17.0) | < 0.001 |
| Hip | 440 | 34 (7.7) | 82 (18.6) | < 0.001 | 38 (8.6) | 48 (10.9) | 0.0872 |
| NHNV | 11,519 | 641 (5.6) | 975 (8.5) | < 0.001 | 982 (8.5) | 1,089 (9.5) | < 0.001 |
| Multiple | 797 | 41 (5.1) | 88 (11.0) | < 0.001 | 67 (8.4) | 78 (9.8) | 0.169 |
| 65-69 years | |||||||
| Vertebral | 503 | 64 (12.7) | 149 (29.6) | < 0.001 | 78 (15.5) | 116 (23.1) | < 0.001 |
| Hip | 186 | 14 (7.5) | 34 (18.3) | < 0.001 | 22 (11.8) | 22 (11.8) | 1.000 |
| NHNV | 3,342 | 235 (7.0) | 338 (10.1) | < 0.001 | 347 (10.4) | 367 (11.0) | 0.123 |
| Multiple | 227 | 16 (7.0) | 34 (15.0) | 0.0014 | 22 (9.7) | 29 (12.8) | 0.1435 |
| 70-79 years | |||||||
| Vertebral | 775 | 137 (17.7) | 299 (38.6) | < 0.001 | 177 (22.8) | 252 (32.5) | < 0.001 |
| Hip | 380 | 55 (14.5) | 99 (26.1) | < 0.001 | 59 (15.5) | 73 (19.2) | 0.0385 |
| NHNV | 2774 | 328 (11.8) | 437 (15.8) | < 0.001 | 408 (14.7) | 425 (15.3) | 0.2567 |
| Multiple | 283 | 35 (12.4) | 68 (24.0) | < 0.001 | 49 (17.3) | 62 (21.9) | 0.0351 |
| 80-89 years | |||||||
| Vertebral | 1,155 | 261 (22.6) | 550 (47.6) | < 0.001 | 308 (26.7) | 399 (34.5) | < 0.001 |
| Hip | 852 | 106 (12.4) | 244 (28.6) | < 0.001 | 104 (12.2) | 131 (15.4) | 0.005 |
| NHNV | 2,203 | 330 (15.0) | 516 (23.4) | < 0.001 | 419 (19.0) | 426 (19.3) | 0.6575 |
| Multiple | 420 | 83 (19.8) | 133 (31.7) | < 0.001 | 93 (22.1) | 85 (20.2) | 0.280 |
| ≥ 90 years | |||||||
| Vertebral | – | – | – | – | – | – | – |
| Hip | – | – | – | – | – | – | – |
| NHNV | – | – | – | – | – | – | – |
| Multiple | – | – | – | – | – | – | – |
aFor all age strata except this one in the Medicare group, the prefracture to postfracture increase in diagnosis rate is greatest for vertebral fracture. In this age group, hip fracture had the greatest differential.
NHNV = nonhip/nonvertebral.
REFERENCES
- 1.Cosman F, de Beur SJ, LeBoff MS, et al. Clinician’s Guide to Prevention and Treatment of Osteoporosis. Osteoporos Int. 2014;25(10):2359-81. [DOI] [PMC free article] [PubMed] [Google Scholar]
- 2.Wright NC, Looker AC, Saag KG, et al. The recent prevalence of osteoporosis and low bone mass in the United States based on bone mineral density at the femoral neck or lumbar spine. J Bone Miner Res. 2014;29(11):2520-26. [DOI] [PMC free article] [PubMed] [Google Scholar]
- 3.Kanis JA; World Health Organization Scientific Group. Assessment of osteoporosis at the primary health-care level. Technical report. World Health Organization Collaborating Centre for Metabolic Bone Diseases. University of Sheffield, UK. 2007. Available at: https://www.sheffield.ac.uk/FRAX/pdfs/WHO_Technical_Report.pdf. Accessed June 10, 2017. [Google Scholar]
- 4.Siris ES, Chen YT, Abbott TA, et al. Bone mineral density thresholds for pharmacological intervention to prevent fractures. Arch Intern Med. 2004;164(10):1108-12. [DOI] [PubMed] [Google Scholar]
- 5.Schuit SC, van der Klift M, Weel AE, et al. Fracture incidence and association with bone mineral density in elderly men and women: the Rotterdam Study. Bone. 2004;34(1):195-202. [DOI] [PubMed] [Google Scholar]
- 6.Wainwright SA, Marshall LM, Ensrud KE, et al. Hip fracture in women without osteoporosis. J Clin Endocrinol Metab. 2005;90(5):2787-93. [DOI] [PubMed] [Google Scholar]
- 7.Warriner AH, Patkar NM, Yun H, Delzell E.. Minor, major, low-trauma, and high-trauma fractures: what are the subsequent fracture risks and how do they vary? Curr Osteoporos Rep. 2011;9(3):122-28. [DOI] [PubMed] [Google Scholar]
- 8.Siris ES, Adler R, Bilezikian J, et al. The clinical diagnosis of osteoporosis: a position statement from the National Bone Health Alliance Working Group. Osteoporos Int. 2014;25(5):1439-43. [DOI] [PMC free article] [PubMed] [Google Scholar]
- 9.Elliot-Gibson V, Bogoch ER, Jamal SA, Beaton DE.. Practice patterns in the diagnosis and treatment of osteoporosis after a fragility fracture: a systematic review. Osteoporos Int. 2004;15(10):767-78. [DOI] [PubMed] [Google Scholar]
- 10.Follin SL, Black JN, McDermott MT.. Lack of diagnosis and treatment of osteoporosis in men and women after hip fracture. Pharmacotherapy. 2003;23(2):190-98. [DOI] [PubMed] [Google Scholar]
- 11.Aboyoussef M, Vierkoetter KR.. Underdiagnosis and under-treatment of osteoporosis following fragility fracture. Hawaii Med J. 2007;66(7):185-87. [PubMed] [Google Scholar]
- 12.Curtis JR, McClure LA, Delzell E, et al. Population-based fracture risk assessment and osteoporosis treatment disparities by race and gender. J Gen Intern Med. 2009;24(8):956-62. [DOI] [PMC free article] [PubMed] [Google Scholar]
- 13.Shepherd AJ, Cass AR, Ray LA, Tan A, Wilkinson GS.. Treatment for older men with fractures. Osteoporos Int. 2012;23(3):1041-51. [DOI] [PubMed] [Google Scholar]
- 14.Balasubramanian A, Tosi LL, Lane JM, et al. Declining rates of osteoporosis management following fragility fractures in the U.S., 2000 through 2009. J Bone Joint Surg Am. 2014;96(7):e52. [DOI] [PubMed] [Google Scholar]
- 15.Andrade SE, Majumdar SR, Chan KA, et al. Low frequency of treatment of osteoporosis among postmenopausal women following a fracture. Arch Intern Med. 2003;163(17):2052-57. [DOI] [PubMed] [Google Scholar]
- 16.Asche C, Nelson R, McAdam-Marx C, Jhaveri M, Ye X.. Predictors of oral bisphosphonate prescriptions in post-menopausal women with osteoporosis in a real-world setting in the USA. Osteoporos Int. 2010;21(8):1427-36. [DOI] [PMC free article] [PubMed] [Google Scholar]
- 17.Block AE, Solomon DH, Cadarette SM, Mogun H, Choudhry NK.. Patient and physician predictors of post-fracture osteoporosis management. J Gen Intern Med. 2008;23(9):1447-51. [DOI] [PMC free article] [PubMed] [Google Scholar]
- 18.Feldstein AC, Nichols GA, Elmer PJ, et al. Older women with fractures: patients falling through the cracks of guideline-recommended osteoporosis screening and treatment. J Bone Joint Surg Am. 2003;85-A(12):2294-302. [PubMed] [Google Scholar]
- 19.Freedman KB, Kaplan FS, Bilker WB, Strom BL, Lowe RA.. Treatment of osteoporosis: are physicians missing an opportunity? J Bone Joint Surg Am. 2000;82-A(8):1063-70. [DOI] [PubMed] [Google Scholar]
- 20.Hooven F, Gehlbach SH, Pekow P, Bertone E, Benjamin E.. Follow-up treatment for osteoporosis after fracture. Osteoporos Int. 2005;16(3):296-301. [DOI] [PubMed] [Google Scholar]
- 21.Wilk A, Sajjan S, Modi A, Fan CP, Mavros P.. Post-fracture pharmacotherapy for women with osteoporotic fracture: analysis of a managed care population in the USA. Osteoporos Int. 2014;25(12):2777-86. [DOI] [PMC free article] [PubMed] [Google Scholar]
- 22.Christensen L, Iqbal S, Macarios D, Badamgarav E, Harley C.. Cost of fractures commonly associated with osteoporosis in a managed-care population. J Med Econ. 2010;13(2):302-13. [DOI] [PubMed] [Google Scholar]
- 23.Cadarette SM, Katz JN, Brookhart MA, et al. Trends in drug prescribing for osteoporosis after hip fracture, 1995-2004. J Rheumatol. 2008;35(2):319-26. [PMC free article] [PubMed] [Google Scholar]
- 24.Gardner MJ, Flik KR, Mooar P, Lane JM.. Improvement in the under-treatment of osteoporosis following hip fracture. J Bone Joint Surg Am. 2002;84-A(8):1342-48. [DOI] [PubMed] [Google Scholar]
- 25.Solomon DH, Johnston SS, Boytsov NN, et al. Osteoporosis medication use after hip fracture in U.S. patients between 2002 and 2011. J Bone Miner Res. 2014;29(9):1929-37. [DOI] [PMC free article] [PubMed] [Google Scholar]
- 26.Viswanathan HN, Curtis JR, Yu J, et al. Direct healthcare costs of osteoporosis-related fractures in managed care patients receiving pharmacological osteoporosis therapy. Appl Health Econ Health Policy. 2012;10(3):163-73. [DOI] [PubMed] [Google Scholar]
- 27.Abrahamsen B, van Staa T, Ariely R, Olson M, Cooper C.. Excess mortality following hip fracture: a systematic epidemiological review. Osteoporos Int. 2009;20(10):1633-50. [DOI] [PubMed] [Google Scholar]
- 28.Bliuc D, Nguyen ND, Milch VE, et al. Mortality risk associated with low-trauma osteoporotic fracture and subsequent fracture in men and women. JAMA. 2009;301(5):513-21. [DOI] [PubMed] [Google Scholar]
- 29.Borgstrom F, Lekander I, Ivergard M, et al. The International Costs and Utilities Related to Osteoporotic Fractures Study (ICUROS)—quality of life during the first 4 months after fracture. Osteoporos Int. 2013;24(3):811-23. [DOI] [PubMed] [Google Scholar]
- 30.U.S. Food and Drug Administration. National Drug Code Directory. Available at: http://www.fda.gov/Drugs/InformationOnDrugs/ucm142438.htm. Accessed June 10, 2017.
- 31.Deyo RA, Cherkin DC, Ciol MA.. Adapting a clinical comorbidity index for use with ICD-9-CM administrative databases. J Clin Epidemiol. 1992;45(6):613-19. [DOI] [PubMed] [Google Scholar]
- 32.Greenspan SL, Wyman A, Hooven FH, et al. Predictors of treatment with osteoporosis medications after recent fragility fractures in a multinational cohort of postmenopausal women. J Am Geriatr Soc. 2012;60(3):455-61. [DOI] [PMC free article] [PubMed] [Google Scholar]
- 33.Looker AC, Borrud LG, Dawson-Hughes B, Shepherd JA, Wright NC.. Osteoporosis or low bone mass at the femur neck or lumbar spine in older adults: United States, 2005-2008. NCHS Data Brief. 2012;(93):1-8. [PubMed] [Google Scholar]
- 34.Shibli-Rahhal A, Vaughan-Sarrazin MS, Richardson K, Cram P.. Testing and treatment for osteoporosis following hip fracture in an integrated U.S. healthcare delivery system. Osteoporos Int. 2011;22(12):2973-80. [DOI] [PubMed] [Google Scholar]
- 35.Teschemaker A, Lee E, Xue Z, Wutoh AK.. Osteoporosis pharmacotherapy and counseling services in US ambulatory care clinics: opportunities for multidisciplinary interventions. Am J Geriatr Pharmacother. 2008;6(5):240-48. [DOI] [PubMed] [Google Scholar]
- 36.Warriner AH, Patkar NM, Curtis JR, et al. Which fractures are most attributable to osteoporosis? J Clin Epidemiol. 2011;64(1):46-53. [DOI] [PMC free article] [PubMed] [Google Scholar]