

Abstract
BACKGROUND:
Nontuberculous mycobacterial lung disease (NTMLD) is an important public health concern that has been increasing in prevalence.
OBJECTIVES:
To (a) describe hospitalizations and health care expenditures among patients with newly diagnosed NTMLD and (b) estimate attributable hospitalizations and expenditures to NTMLD in the United States.
METHODS:
In this matched cohort study, patients and controls were identified from a large U.S. national managed care insurance database containing aggregated health claims of up to 18 million fully covered members annually. NTMLD was defined based on diagnostic claims for NTMLD on ≥ 2 separate occasions ≥ 30 days apart between 2007 and 2016. Thirty-six months of continuous enrollment (12 months before and 24 months after the first diagnostic claim) was required. Health care utilization and standardized health care expenditures were summarized over 12 months before NTMLD diagnosis and for 2 subsequent years. The percentage of patients that were hospitalized in years 1 and 2 was evaluated using a generalized mixed effects model with adjustment for baseline hospitalizations, Charlson Comorbidity Index, and baseline diseases. A general estimating equation model was used to evaluate health care expenditures.
RESULTS:
There were 1,039 patients in the NTMLD cohort and 2,078 in the control cohort. NTMLD patients had a 55.0% risk of hospitalization in year 1 (95% CI = 45.4-64.3) and a 38.8% risk in year 2 (95% CI = 30.0-48.4). The adjusted risk of hospitalization was significantly higher in the NTMLD group compared with the control group in year 1 (OR = 4.64; 95% CI = 3.74-5.76; P < 0.001) and year 2 (OR = 2.26; 95% CI = 1.78-2.87; P < 0.001). Year 1 adjusted mean health care expenditures for the total NTMLD patient population were $72,475 (95% CI = $58,510-$86,440) and for the matched control population were $28,405 (95% CI = $8,859-$47,950), with a difference of $44,070 (95% CI = $27,132-$61,008; P < 0.001). Year 2 adjusted mean expenditures for the overall NTMLD patient group were $48,114 (95% CI = $31,722-$64,507) and for the matched control group were $28,990 (95% CI = $9,429-$48,552), with a difference of $19,124 (95% CI = $7,865-$30,383; P < 0.001).
CONCLUSIONS:
Patients with NTMLD have a significantly greater risk of hospitalization and higher total health care expenditures than matched control patients without NTMLD.
What is already known about this subject
The prevalence of nontuberculous mycobacterial lung disease (NTMLD) in the United States has increased in recent years.
NTMLD has been associated with increased hospitalizations and health care expenditures; however, data are limited.
What this study adds
Hospitalizations and health care expenditures were significantly higher in patients with NTMLD compared with matched controls in this sample of commercially insured and Medicare Advantage plan patients.
The risk of hospitalization was significantly higher in the NTMLD group compared with matched controls, with an odds ratio of 4.64 for year 1 and 2.26 at year 2 (both, P < 0.001).
Health care expenditures were 155% and 66% greater in the NTMLD group than in the control group at year 1 ($72,475 vs. $28,405) and in year 2 ($48,114 vs. $28,990), respectively.
Nontuberculous mycobacterial lung disease (NTMLD) is gaining recognition as an important public health concern due to its increasing prevalence in recent decades. The annual increase in NTMLD prevalence in recent years has been reported to be over 8% in the United States,1,2 and the 5-year-period prevalence in the entire population of Ontario, Canada, was observed to increase from 29.3 per 100,000 in 1998-2002 to 41.3 per 100,000 in 2006-2010.3 NTMLD-associated morbidity such as decline in lung function and quality of life, high attributable mortality, and rising population mortality create a substantial burden on patients, the health care system, and financial resources.4-11 Factors such as its chronic and progressive nature, a treatment success rate of only ~60%, and high recurrence rates (30% at 14 months and 48% at 42 months) likely all contribute to significant health care expenditures.9-17
Despite increasing awareness of NTMLD, reports on the economic impact, including health care utilization and health care expenditures, are limited. In Germany, NTMLD was associated with a 3-fold increase in hospitalizations and a large attributable health care cost.18 In the United States, antibiotic costs of over $5,000 per patient were identified in 1 cohort and prescription drug costs of $617 million per year overall have been estimated at the national level.9,10 We sought to describe health care utilization (hospitalizations in particular) and health care expenditures among patients with newly diagnosed NTMLD and to estimate attributable hospitalizations and expenditures to NTMLD in the United States using a large national managed care claims database.
Methods
Data and Study Cohorts
In this matched cohort study, patients and controls were identified from a large U.S. national managed care insurance database (Clinformatics Data Mart from Optum). The population is geographically diverse, with data for members in all 50 states, and representative of a managed care insured population, including beneficiaries aged < 65 years (commercially insured members) and Medicare Advantage (i.e., Part C) beneficiaries. The database contains aggregated health claims covering up to 18 million fully covered members annually; Medicare Advantage members are included with increasing numbers in recent years (approximately 3.5 million in 2015).
NTMLD was defined as patients having at least 2 physician claims for NTMLD (International Classification of Diseases, Ninth Revision, Clinical Modification [ICD-9-CM] code 031.0 or Tenth Revision [ICD-10-CM] code A31.0) on separate occasions at least 30 days apart between 2007 and 2016. Patients were required to have 36 months of continuous enrollment beginning 12 months before the first diagnostic claim of NTMLD and continuing for 24 months after the claim. Thus, we only included patients whose first medical claim for NTMLD occurred in the time frame of 2008-2013.
Control patients were randomly selected from a 5% random sample of the general health plan population, excluding patients with any NTMLD diagnosis. Controls were matched 2:1 to NTMLD patients based on age, sex, and insurance coverage period. The NTMLD diagnosis date of a given patient served as the index date for their matched control for the assessment of health care utilization and expenditure in years 1 and 2 after the index date.
Comparison of health care utilization was focused on hospitalizations, and the comparison of health care expenditures was focused on total health care expenditures; all other utilization/expenditure measures were tabulated without statistical testing.
Study Variables and Descriptive Statistics
Health care utilization and standardized health care expenditures were summarized over 12 months (baseline) before NTMLD diagnosis and for 2 subsequent years. Values were standardized using the Resource-Based Relative Value Scale, which is broadly used by managed care and Medicare organizations to make reimbursement decisions for physician claims.19 Expenditure values were adjusted to 2015 U.S. dollars according to Consumer Price Index inflation rates. Health care utilization was assessed by measuring the proportion of patients hospitalized, number of hospitalizations, lengths of stay, emergency department (ED) visits, outpatient visits, and number of ancillary care claims. Ancillary care was any use of medical equipment, home health/hospice visits, services and supplies, and transportation services. Mean and median total health care expenditures were tabulated for medical claims for expenditures associated with inpatient hospitalizations, ED visits, outpatient/office visits, and ancillary care services and for pharmacy dispensing claims. Health care utilization and expenditures were also tabulated separately for commercially insured and Medicare Advantage members. NTMLD-related health care utilization and expenditures according to the NTMLD-specific diagnostic code in the linked claim were measured in NTMLD patients during follow-up years 1 and 2.
Comorbid conditions and tobacco use present at baseline were identified utilizing ICD-9/10-CM codes (Appendix A, available in online article) from inpatient and outpatient medical claims. The Charlson Comorbidity Index (CCI) was constructed from baseline disease and health conditions to characterize the overall patient health burden and was used in the statistical analysis to adjust for health care utilization and expenditure estimation.20,21 We identified the use of immunosuppressant agents that are administered chronically and cause either significant systemic immunosuppression or local infections (i.e., systemic corticosteroids, intra-articular corticosteroids, inhaled corticosteroids, methotrexate, tumor necrosis factor blockers, hydroxychloroquine sulfate, leflunomide, and azathioprine) according to pharmacy dispensing claims.
To contextualize the significance of expenditures for NTMLD, we sought to make comparisons with other serious and/or chronic respiratory system diseases. We selected chronic obstructive pulmonary disease (COPD), idiopathic pulmonary fibrosis (IPF), and lung cancer to benchmark disease-specific expenditures. From a 5% random sample of the entire database, we identified all patients with an incident diagnosis of any of the benchmark diseases (with ≥ 12 months of coverage before and after diagnosis. This selection process yielded 3 nonexclusive patient groups, wherein a patient with lung cancer, for example, may also be represented in the group with COPD. This approach constructed “real-life” cohorts of patients with these diseases. For these patients with benchmark diseases, we measured total health care expenditures in the first year after diagnosis and compared the analogous data from patients with NTMLD
Statistical Analysis with Multivariable Adjustment
The risk for hospitalization in years 1 and 2 was evaluated using a generalized mixed effects model with adjustment for demographic characteristics at the index date, hospitalizations and total health care expenditures within the year before the index date, all comorbid illnesses identified within the year before index and retained in the model, and CCI. A hierarchical covariance structure was examined (using SAS PROC GLIMMIX) in which individual patients were clustered within U.S. states to account for potential variations in hospitalization risk across regions. A general estimating equation (GEE) model (using SAS GENMOD) was used to evaluate health care expenditure during years 1 and 2 following NTMLD diagnosis, as a GEE model is more robust for analysis of skewed data such as health care expenditures.22 In addition, the analysis was adjusted for patients with presumed M. abscessus since this organism has been associated with resistance and different treatment approaches that could confound health care utilization and estimation of health care expenditures in NTMLD patients.11,23 There are no NTMLD species-specific ICD codes; therefore, we used drugs typically reserved for treatment of M. abscessus (imipenem, meropenem, tigecycline, cefoxitin) to identify patients whose NTMLD may have been caused by this organism, if such treatments were recorded either at or 6 months before baseline or within year 1 follow-up from initial NTMLD diagnosis.
When estimating the outcomes of hospitalization rates and total health care expenditures between the 2 cohorts, baseline patient hospitalizations and total health care expenditures were adjusted in addition to other baseline patient characteristics. The final statistical analysis retained only those baseline covariates that had a P value ≤ 0.05, with exception for variables believed to potentially skew estimation (e.g., cystic fibrosis [CF] and M. abscessus were retained in the model for estimation of utilization and expenditure). Statistical analysis was conducted with SAS version 9.4 (SAS Institute, Cary, NC).
Sensitivity Analyses
Sensitivity analyses examined health care expenditures and hospitalization rates by removing patients with CF, human immunodeficiency virus (HIV), and presumed M. abscessus, since these populations may disproportionately affect hospitalizations and expenditures. In order to more completely control for patient differences, we conducted a sensitivity analysis using the propensity score (PS) method for analysis of hospitalizations, a core component of health care utilization and expenditures and critical factor for health care decision making. With the cohort of NTMLD patients and their 2:1 age-, sex-, and insurance-period-matched controls, we used the nonrespiratory comorbidities to generate a PS for NTMLD and matched NTMLD patients and controls using a caliper width of 0.01. Using the resulting PS-matched patients, we generated odds ratios (ORs) for hospitalizations. In addition, multivariable adjustment for comparisons of median health care expenditures between the NTMLD and control groups was conducted using quantile regression.
Results
Study Cohorts
The study definition of NTMLD diagnosis was met by 9,476 individuals. Of these, 5,642 were excluded because their first medical claim for NTMLD was outside the time window (2008-2013). After removing patients without 12 months of insurance coverage before their first NTMLD medical claim (n = 2,484), 1,350 patients were retained. Another 311 patients were excluded (8 due to death; 303 due to insurance disenrollment). Thus, 1,039 patients were included in the NTMLD cohort and 2,078 in the control cohort. Demographic characteristics were comparable across cohorts, with an average age of 68 years and the majority (67%) being female (Table 1). Patients with NTMLD had a higher CCI score and more comorbidities (2.0 [±2.2]) than controls (0.5 [±1.3]) at baseline. Compared with the control population, the NTMLD population had a higher prevalence of respiratory disorders (COPD: 50.0% vs. 6.0%; pneumonia: 41.6% vs. 1.4%; bronchiectasis: 36.7% vs. 0.3%; asthma: 20.6% vs. 3.5%; tuberculosis: 7.8% vs. 0.0%; CF: 2.0% vs. 0.0%), greater use of immunosuppressant drugs (systemic corticosteroids: 42.0% vs. 10.7%; inhaled corticosteroids: 31.0% vs. 4.0%; other immunosuppressants: 6.6% vs. 0.8%), and fewer medical claims for tobacco use (19.5% vs. 27.0%). Almost 80% of the NTMLD cohort had ≥ 1 medical claim for a pulmonary disorder compared with < 10% of patients in the control cohort. NTMLD patients also more often had cardiovascular, neoplastic, and autoimmune conditions (Table 1). Although we adjusted for a presumptive diagnosis of M. abscessus, based on the antibiotics prescribed, the number of cases identified was so small that it did not affect our results.
TABLE 1.
Demographics and Baselinea Patient Health Characteristics
| Patients with NTMLD (n = 1,039) | Controls (n = 2,078) | P Valueb | |
|---|---|---|---|
| Age, mean (SD) | 68 (14.1) | 68 (14.1) | |
| Female, % (n) | 67 (699) | 67 (1,392) | |
| CCI score, mean (SD) | 2.0 (2.16) | 0.5 (1.25) | < 0.001 |
| Baseline conditions, % (n) | |||
| Arrhythmia | 21.6 (224) | 6.3 (130) | < 0.001 |
| Aspergillosis | 3.2 (33) | 0.0 (0) | < 0.001 |
| Asthma | 20.6 (214) | 3.5 (73) | < 0.001 |
| Atherosclerosis | 6.8 (71) | 2.0 (41) | < 0.001 |
| Bronchiectasis | 36.7 (381) | 0.3 (7) | < 0.001 |
| Cancer | 17.4 (181) | 5.3 (110) | < 0.001 |
| COPD | 50.0 (519) | 6.0 (124) | < 0.001 |
| Colitis | 4.1 (43) | 0.8 (16) | < 0.001 |
| Congestive heart failure | 11.2 (116) | 4.1 (85) | < 0.001 |
| Coronary artery disease | 17.8 (185) | 7.0 (146) | < 0.001 |
| Crohn’s disease | 0.7 (7) | 0.1 (2) | 0.005 |
| Cystic fibrosis (pulmonary) | 2.0 (21) | 0.0 (0) | < 0.001 |
| Dementia | 0.8 (8) | 0.9 (19) | 0.682 |
| Depression | 9.4 (98) | 3.5 (72) | < 0.001 |
| Diabetes | 14.5 (151) | 10.8 (224) | 0.002 |
| Gastroesophageal reflux disease | 23.1 (240) | 7.4 (154) | < 0.001 |
| Heart valve disorder | 14.9 (155) | 4.0 (82) | < 0.001 |
| HIV | 1.9 (20) | 0 (0) | < 0.001 |
| Hyperlipidemia | 46.0 (478) | 27.9 (579) | < 0.001 |
| Hypertension | 46.9 (487) | 29.4 (611) | < 0.001 |
| Idiopathic pulmonary fibrosis | 1.4 (15) | 0 (1) | < 0.001 |
| Immune deficiency | 6.7 (70) | 0.5 (10) | < 0.001 |
| Lung cancer | 5.4 (56) | 0.2 (5) | < 0.001 |
| Lupus | 0.6 (6) | 0.1 (3) | 0.034 |
| Mental disorder | 16.3 (169) | 7.4 (154) | < 0.001 |
| Metastatic carcinoma | 2.2 (23) | 0.6 (13) | < 0.001 |
| Moderate or severe liver disease | 0.7 (7) | 0.2 (5) | 0.066 |
| Multiple sclerosis | 0.2 (2) | 0.4 (8) | 0.370 |
| Myocardial infarction | 4.2 (44) | 1.4 (29) | < 0.001 |
| Obesity | 3.4 (35) | 3.4 (70) | 1.000 |
| Organ transplant | 1.3 (14) | 0.1 (2) | < 0.001 |
| Pectus excavatum | 0.0 (0) | 0.0 (0) | – |
| Pneumonia | 41.6 (432) | 1.4 (29) | < 0.001 |
| Psoriasis | 1.7 (18) | 0.6 (13) | 0.003 |
| Pulmonary arterial hypertension | 1.7 (18) | 0.2 (4) | < 0.001 |
| Pulmonary diseasec | 78.8 (819) | 9.2 (191) | < 0.001 |
| Rheumatoid disease | 5.9 (61) | 1.0 (21) | < 0.001 |
| Sjögren’s syndrome | 0.6 (6) | 0.1 (2) | 0.012 |
| Tobacco use | 19.5 (203) | 27.0 (75) | < 0.001 |
| Tuberculosis | 7.8 (81) | 0.0 (0) | < 0.001 |
| Immunosuppressant drug use, % (n)d | 52.6 (546) | 13.0 (271) | < 0.001 |
| Systemic corticosteroids | 42.0 (436) | 10.7 (222) | < 0.001 |
| Inhaled corticosteroids | 31.0 (322) | 4.0 (82) | < 0.001 |
| Other | 6.6 (69) | 0.8 (16) | < 0.001 |
| Treated for M. abscessus,e % (n) | 1.4 (15) | 0 (0.0) | 0.005 |
aBaseline indicates the 12 months immediately preceding the incident diagnosis of NTMLD.
bChi-square test for comorbid conditions; t-test for CCI.
cPulmonary disease included the following: aspergillosis, asthma, bronchiectasis, COPD, cystic fibrosis, idiopathic pulmonary fibrosis, tuberculous, pulmonary arterial hypertension, and pneumonia.
dOther immunosuppressant drugs comprise methotrexate, tumor necrosis factor antagonists, azathioprine, leflunomide, and hydroxychloroquine sulfate.
eTreatment for M. abscessus was defined according to the use of imipenem, meropenem, tigecycline, and cefoxitin, either at or 6 months before baseline or within year 1 follow-up from NTMLD diagnosis to account for the possibility of treatment being claimed before NTMLD diagnosis was recorded.
CCI = Charlson Comorbidity Index; COPD = chronic obstructive pulmonary disease; HIV = human immunodeficiency virus; NTMLD = nontuberculous mycobacterial lung disease; SD = standard deviation.
Observed Health Care Utilization and Expenditures
Patients with NTMLD had higher rates of all health care utilization measures compared with controls at baseline and at each follow-up year (Table 2). Health care utilization in the NTMLD group increased from baseline in year 1 of follow-up but returned to near baseline levels in year 2. In the NTMLD cohort, the mean length of hospitalization was approximately doubled from 3.2 days at baseline to 6.5 days in year 1, returning to near baseline (3.6 days) in year 2. The number of outpatient visits among NTMLD patients increased from 39 at baseline to 49 in year 1 but decreased to below baseline in year 2. Health care utilization measures in the control group were generally stable over the follow-up period. NTMLD-related health care utilization and expenditures, according to the NTMLD-specific diagnostic code in the linked claim, were higher in year 1 than in year 2 (Appendix B, available in online article).
TABLE 2.
Observed Overall Health Care Utilization by Group at Baseline and During Follow-up
| Baselinea | Follow-up Year 1 | Follow-up Year 2 | ||||
|---|---|---|---|---|---|---|
| Patients with NTMLD (n = 1,039) | Controls (n = 2,078) | Patients with NTMLD (n = 1,039) | Controls (n = 2,078) | Patients with NTMLD (n = 1,039) | Controls (n = 2,078) | |
| Hospitalized, n (%) | 317 (30.5) | 125 (6.0) | 365 (35.1) | 143 (6.9) | 239 (23.0) | 151 (7.3) |
| Number of hospitalizations in hospitalized patients | 1.7 (1.6) | 1.5 (0.9) | 2.2 (1.8) | 1.8 (1.4) | 2.0 (1.7) | 1.8 (1.3) |
| Length of hospital stay in hospitalized patients (days) | 10.7 ± 15.6 | 9.6 ± 13.0 | 18.6 ± 32.1 | 13.4 ± 17.9 | 15.5 ± 25.2 | 15.1 ± 23.2 |
| Number of hospitalizations | 0.5 ± 1.2 | 0.1 ± 0.4 | 0.8 ± 1.5 | 0.1 ± 0.6 | 0.5 ± 1.2 | 0.1 ± 0.6 |
| Length of hospital stay (days) | 3.2 ± 9.9 | 0.6 ± 3.9 | 6.5 ± 21.0 | 0.9 ± 5.8 | 3.6 ± 13.7 | 1.1 ± 7.4 |
| Number of ED visits | 1.1 ± 2.4 | 0.3 ± 1.1 | 1.3 ± 2.5 | 0.4 ± 1.6 | 0.9 ± 2.0 | 0.4 ± 1.4 |
| Number of outpatient visitsb | 38.6 ± 33.7 | 9.5 ± 15.9 | 48.6 ± 36.6 | 10.6 ± 17.5 | 34.7 ± 33.4 | 11.4 ± 18.2 |
| Number of ancillary care servicesc | 1.3 ± 6.5 | 0.2 ± 2.0 | 3.0 ± 12.5 | 0.2 ± 1.6 | 1.6 ± 7.8 | 0.2 ± 1.6 |
Note: All values are mean ± standard deviation unless otherwise noted.
aBaseline refers to the year before diagnosis.
bOutpatient includes facility (e.g., laboratory, radiology) and professional services (e.g., pathology, immunizations and injections, rehabilitation).
cAncillary care include services for medical equipment, home health/hospice visits, services and supplies, and transportation services.
ED = emergency department; NTMLD = nontuberculous mycobacterial lung disease.
Total observed annual health care expenditures, including medical and pharmacy insurance expenditures, were higher in patients with NTMLD than in controls at baseline and at each follow-up year (Table 3). Each of the health care expenditure measures in the NTMLD group increased from baseline in year 1 of follow-up but returned to near baseline levels in year 2. In the NTMLD group, the mean (median) total observed health care expenditures were $35,573 ($15,627) at baseline, $47,713 ($18,964) in year 1, and $29,226 ($11,453) in year 2. For controls, the mean (median) total observed health care expenditures were relatively stable: $5,750 ($605), $6,761 ($770), and $7,231 ($836) at baseline, year 1 and year 2, respectively.
TABLE 3.
Observed Mean and Median (Q1, Q3) Direct Health Care Expenditures per Plan Member
| Health Care Expenditures, $ | Baselinea | Follow-up Year 1 | Follow-up Year 2 | |||
|---|---|---|---|---|---|---|
| Patients with NTMLD (n = 1,039) | Controls (n = 2,078) | Patients with NTMLD (n = 1,039) | Controls (n = 2,078) | Patients with NTMLD (n = 1,039) | Controls (n = 2,078) | |
| Total health care expendituresb | ||||||
| Mean (SD) | 35,573 ± 61,967 | 5,750 ± 16,964 | 47,713 ± 95,421 | 6,761 ± 20,293 | 29,226 ± 52,141 | 7,231 ± 23,135 |
| Median (Q1, Q3) | 15,627 (6,467, 37,306) | 605 (0, 4,108) | 18,964 (8,170, 53,102) | 770 (0, 5,169) | 11,453 (3,161, 31,600) | 836 (0, 5,147) |
| Pharmacy | ||||||
| Mean (SD) | 8,947 ± 24,294 | 1,380 ± 4,436 | 12,204 ± 26,503 | 1,513 ± 5,821 | 9,191 ± 22746 | 1,743 ± 7,546 |
| Median (Q1, Q3) | 2,354 (593, 6,583) | 22 (0, 1,149) | 4,174 (1,566, 10,594) | 48 (0, 1,219) | 2,430 (175, 7,527) | 58 (0, 1,345) |
| Drug administrationc | ||||||
| Mean (SD) | 3,279 ± 20,075 | 184 ± 1,633 | 4,280 ± 20,785 | 313 ± 2,929 | 2,964 ± 17,252 | 513 ± 5,370 |
| Median (Q1, Q3) | 9 (0, 389) | 0 (0, 0) | 16 (0, 593) | 0 (0, 0) | 0 (0, 192) | 0 (0, 0) |
| Medicalb | ||||||
| Mean (SD) | 26,626 ± 48,461 | 4,370 ± 15,261 | 35,508 ± 86,679 | 5,248 ± 18,195 | 20,036 ± 39,061 | 5,488 ± 19,150 |
| Median (Q1, Q3) | 11,701 (3,821, 27,843) | 209 (0, 2,258) | 12,416 (4,704, 37,141) | 288 (0, 3,029) | 6,715 (1,770, 20,558) | 400 (0, 2,972) |
| Hospitalization | ||||||
| Mean (SD) | 11,505 ± 34,492 | 1,383 ± 9,952 | 18,479 ± 77,387 | 1,995 ± 14,052 | 8,437 ± 26,697 | 1,940 ± 12,030 |
| Median (Q1, Q3) | 0 (0, 8,056) | 0 (0, 0) | 0 (0, 13,494) | 0 (0, 0) | 0 (0, 0) | 0 (0, 0) |
| ED | ||||||
| Mean (SD) | 1,070 ± 2,812 | 234 ± 1,130 | 1,273 ± 3,072 | 288 ± 1,379 | 911 ± 2,861 | 308 ± 1,367 |
| Median (Q1, Q3) | 0 (0, 1,063) | 0 (0, 0) | 0 (0, 1,287) | 0 (0, 0) | 0 (0, 498) | 0 (0, 0) |
| Outpatientd | ||||||
| Mean (SD) | 13,574 ± 25,880 | 2,637 ± 8,586 | 14,504 ± 24,785 | 2,845 ± 7,883 | 10,006 ± 19,692 | 3,091 ± 11,929 |
| Median (Q1, Q3) | 7,199 (2,800, 14,864) | 194 (0, 1,929) | 7,701 (3,699, 15,709) | 255 (0, 2,352) | 4,878 (1,402, 11,433) | 372 (0, 2,466) |
| Ancillarye | ||||||
| Mean (SD) | 476 ± 1,946 | 116 ± 787 | 1,252 ± 6,021 | 119 ± 865 | 681± 3,122 | 149 ± 1,023 |
| Median (Q1, Q3) | 0 (0, 0) | 0 (0, 0) | 0 (0, 68) | 0 (0, 0) | 0 (0, 0) | 0 (0, 0) |
aBaseline refers to the year before diagnosis.
bTotal health care expenditure = pharmacy expenditure + medical expenditure; medical expenditure = inpatient hospitalization expenditure + ED expenditure + outpatient/office visit expenditure + ancillary care expenditure.
cDrug administration includes outpatient medical claims by clinicians for clinic-based or office-based drug delivery.
dOutpatient includes facility (e.g., laboratory, radiology) and professional services (e.g., pathology, immunizations and injections, rehabilitation).
eAncillary care includes services for medical equipment, home health/hospice visits, services and supplies, and transportation services.
ED = emergency department; NTMLD = nontuberculous mycobacterial lung disease; Q1 = first quartile; Q3 = third quartile; SD = standard deviation.
Descriptive Report of Hospitalizations and Expenditures in Commercial and Medicare Beneficiary Populations
In the NTMLD cohort, the proportion of patients hospitalized during the baseline period was approximately 30% in the commercial and Medicare beneficiary populations. At year 1, the proportion hospitalized increased to 37.7% in the Medicare group but appeared unchanged in the commercial group, perhaps related to the differences in mean (standard deviation [SD]) age between commercial and Medicare populations, which were 59.0 (16.1) versus 73.4 (8.7) years, respectively. Gender was comparable between groups (69.6% female in the commercial group and 65.7% female in the Medicare group). At year 2, the proportion hospitalized appeared comparable between groups (both < 25%).
Total baseline health care expenditures in the NTMLD cohort were higher in the commercial group ($42,416) than in the Medicare group ($30,912). At year 1, total health care expenditures remained higher in the commercial group ($50,272) than in the Medicare group ($45,970). At year 2, costs in both NTMLD insurance plan groups generally returned to near or below baseline levels ($37,600 and $23,522 for commercial and Medicare groups, respectively).
Descriptive Report of Health Care Expenditures Among Selected Benchmark Pulmonary Diseases
A separate analysis compared total health care expenditures in the first year after NTMLD diagnosis (n = 1,642) with expenditures after diagnosis of other severe respiratory diseases, including COPD (n = 903), IPF (n = 29), and lung cancer (n = 97), in patients with 24-month continuous enrollment. Year 1 mean health care expenditures per patient with NTMLD were $48,539; for COPD, IPF, and lung cancer, corresponding values were $23,053, $44,414, and $69,224, respectively.
Among newly diagnosed NTMLD patients with any of these other lung diseases at baseline, observed year 1 health care expenditures were even more pronounced: COPD plus NTMLD (n = 903; $55,471), IPF plus NTMLD (n = 29; $211,362), and lung cancer plus NTMLD (n = 97; $80,802).
Adjusted Hospitalization Rates and Health Care Expenditures
The final model for hospitalization included patient cohort, presence of hospitalization at baseline, year, interaction of cohort by year, CCI, hypertension, diabetes, M. abscessus, and CF. The final model for total health care expenditures included patient cohort, total health care expenditures at baseline, year, age, interaction of cohort by age and by year, CCI, hypertension, mental health, CF, and use of inhaled corticosteroids.
Adjusted risks of hospitalization in NTMLD patients were significantly greater than in matched controls in years 1 and 2 (Figure 1). Rates fell from year 1 to year 2 among NTMLD patients but were stable among controls.
FIGURE 1.
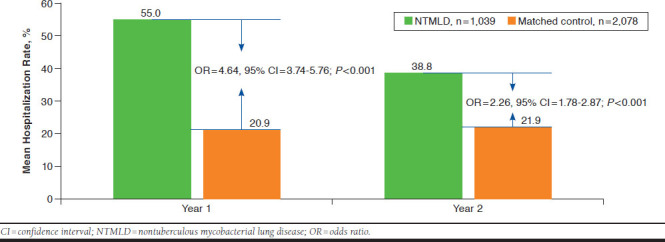
Adjusted Mean Hospitalization Rates for Follow-up Years 1 and 2
Adjusted total direct health care expenditures in NTMLD patients were significantly higher than in matched controls in years 1 and 2 (Figure 2). Expenditures fell from year 1 to year 2 among NTMLD patients but were stable among controls.
FIGURE 2.
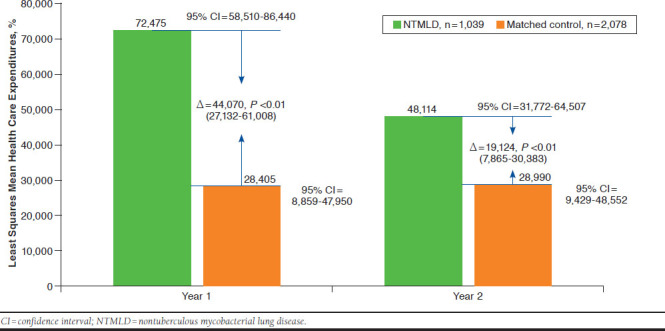
Adjusted Total Direct Health Care Expenditures for NTMLD and Control Cohorts Across Years 1 and 2
Sensitivity Analyses
After removal of CF patients from the analysis, adjusted hospitalization rates in the NTMLD group were 30.3% and 18.5% in year 1 and year 2, respectively; adjusted hospitalization rates in control patients were 8.6% and 9.1% in year 1 and year 2, respectively. The OR for hospitalization in patients without CF was significantly higher in the NTMLD group versus controls: 4.62 (95% CI = 3.73-5.74; P < 0.001) in year 1 and 2.27 (95% CI = 1.79-2.88; P < 0.001) in year 2. Excluding CF patients, the difference in adjusted health care expenditures between the NTMLD and matched control group was $48,699 (95% CI = $21,361-$76,038; P < 0.001) in year 1 and $14,016 (95% CI = $5,478-$22,555; P < 0.01) in year 2. From year 1 to year 2, total adjusted health care expenditures for NTMLD patients decreased by $34,098 (55.8%) when CF patients were removed. Additional analysis with removal of both HIV and CF patients did not change these findings. Findings after removing patients with presumed M. abscessus were also consistent: OR for hospitalization in the NTMLD group versus controls was 2.27 (95% CI = 1.79-2.88; P < 0.001) and the difference between the NTMLD and control groups in adjusted health care expenditure in year 2 was $19,110 (95% CI = $7,859-$30,361; P < 0.001).
Propensity score-matched comparisons in hospitalizations led to a loss of nearly 36% of the sample (666 vs. 1,039 in the covariate-adjusted model), with improved matching of baseline covariates. ORs for hospitalization in the propensity scorematched analysis were consistent with our primary analysis, with somewhat attenuated point estimates (data not shown). The comparison of median total health care expenditures using quantile regression showed a $5,296 (95% CI = $4,593-$5,998) higher expenditure in the NTMLD group compared with the matched control group when averaging the 2 years (P < 0.001; Table 3). Overall, the sensitivity analysis findings are consistent with the findings from the main analysis, with lower observed total health care expenditures in year 2 than in year 1.
Discussion
Health care utilization and expenditures were higher in patients with NTMLD compared with controls across the 36-month observation period in our sample of commercially insured and Medicare Advantage plan patients. The adjusted risk of hospitalization was significantly higher in the NTMLD group compared with matched controls, with an OR of 4.64 at year 1 and 2.26 at year 2 (both P < 0.001). Health care expenditures, compared with age- and sex-matched controls and adjusted for all comorbidities that were retained in the model, were 155% and 65% greater in the NTMLD group than in the control group at year 1 ($72,475 vs. $28,405) and year 2 ($48,114 vs. $28,990), respectively. As expected around the time of a new diagnosis of an important illness, a pattern of increased health care utilization and expenditures from baseline to year 1, followed by a decrease from year 1 to year 2, was observed in the NTMLD cohort, but not in the control cohort. In contrast to increasing hospitalization rates and health care expenditures observed among controls from baseline to year 2, in the NTMLD cohort, year 2 levels fell to below baseline levels; we speculate that successful NTMLD treatment may have contributed to these declines, and the effect of treatment is the subject of a separate investigation.
In a separate descriptive analysis of total health care expenditures in the year after diagnosis with NTMLD or other lung diseases, year 1 mean health care expenditures per patient diagnosed with NTMLD ($48,538) appeared comparable with year 1 mean health care expenditures in populations with IPF, greater than in COPD, and less than in lung cancer. Although antifibrotic agents would be expected to substantially increase expenditures in IPF patients, these drugs were recently introduced to the United States and so would only affect the last 3 years of our 10-year study period. Further, it may be expected that a minority of IPF patients would receive antifibrotic therapy, since many patients are of very advanced age and likely more susceptible to adverse effects and many would have disease that is either too severe or too mild to qualify. Among patients newly diagnosed with NTMLD who had any of these other lung diseases at baseline, year 1 health care expenditures were even higher.
While health care utilization and expenditure data for NTMLD in the United States are limited, there are several published estimates that can be considered.9,10,16 Treatment costs of NTMLD were estimated in an analysis of 27 adult HIV-seronegative patients participating in a U.S. NTMLD natural history study who met American Thoracic Society/Infectious Diseases Society of America diagnostic criteria for NTMLD at initial diagnosis.10 Over a median follow-up period of > 4 years, the cost of antibiotic treatment for NTMLD was projected to be approximately $20,000, with an average monthly cost > $500. Another U.S.-based study evaluated data from 3 large health insurance claims databases to estimate inpatient and outpatient cost per episode of selected waterborne diseases (including pulmonary NTMLD infection) in the privately insured, Medicare-, and Medicaid-eligible populations.16 The national estimate for mean total cost per hospitalization for NTMLD was $25,409; the proportion of patients hospitalized and number of hospitalizations per year were substantially higher in Medicare relative to commercial plan patients, and the total cost estimate in Medicare patients was almost double that of commercial plan patients.16 Consistent with these findings, our descriptive data suggest that in year 1 after NTMLD diagnosis, the increase from baseline in hospitalization and total health care expenditure was more pronounced among Medicare patients than commercial plan patients. This is not unexpected because Medicare patients were on average 14 years older than commercial plan patients.
Strollo et al. (2015) generated annual estimates of national and state-specific NTMLD case numbers and associated costs based on published literature on national prevalence and cost estimates for NTMLD in the United States.9 The prevalence and cost estimates were adjusted for potential ICD-9-CM undercoding, based on previous data that showed that only 27% of microbiologically confirmed cases are coded for NTMLD (i.e., final estimates were based on increasing case estimates by 73%).24 Their 2010 estimates for NTMLD cases and total costs were 86,244 NTMLD cases with an associated total cost of $815 million, attributing 76% of the direct cost burden to prescription medication costs.9 Another study using Healthcare Cost and Utilization Project data showed that the aggregated hospital charges for NTMLD had an increasing trend, with a total cost of more than $9,000,000 from 2002 through 2012.17
Estimates of NTMLD economic burden beyond the United States reveal high health care utilization and expenditures. A German claims-based study reported that the mean direct expenditure per NTMLD patient was nearly 4-fold (3.95; 95% CI = 3.73-4.19) that of matched controls. Hospitalizations were 3 times higher in NTMLD patients, accounting for 63% of the total costs.18 A Canadian-based retrospective cohort of 91 patients with pulmonary NTMLD infections reported an average monthly treatment cost of approximately $500 (CAD). Higher treatment costs were associated with use of intravenous antibiotics and presence of M. abscessus or M. xenopi. Multivariable modeling found that parenteral therapy independently increased the monthly treatment cost by approximately $700 (CAD).11 The current analysis did not investigate specific treatments or NTM pathogens.
Limitations
This study has some limitations to consider. Notwithstanding the statistical adjustment, the NTMLD and matched control cohorts were substantially imbalanced with regard to preexisting comorbidity burden at baseline. Some residual effects of these baseline patient characteristics may persist despite multivariable statistical adjustment and require cautionary interpretation of our findings. Further addressing baseline patient differences using propensity score methods in a sensitivity analysis for hospitalization generated results consistent with our primary analysis, with somewhat attenuated ORs.
Our estimates of NTMLD-related utilization and expenditures may be underestimated to some extent given the difficulty in diagnosing NTMLD, which has been shown to be delayed from symptom onset by an average of 5.2 years.25 We think that it is likely that some of the baseline year utilization and expenditures include those associated with the diagnostic process related to misdiagnosis, which would effectively dampen the measured effect of NTMLD seen in years 1 and 2 when making comparisons to baseline.
Overall health care utilization and expenditures in our study may be underestimated due to an overall tendency of underdiagnosis and undercoding for NTMLD in clinical practice.24 On the other hand, a recent study reported that > 20% of patients given an ICD-9-CM code for NTMLD were wrongly diagnosed or classified based on medical records review (e.g., patients either had latent tuberculosis or no microbiological data to support an NTMLD diagnosis).26 Thus, the potential for undercoding and/or miscoding is an important limitation.
Another limitation is that we could not assess patient out-of-pocket expenditures or potential indirect health care costs (e.g., due to loss of productivity); therefore, total health care expenditures may be higher than currently reported. Additional factors that may influence health care utilization and expenditure estimates that could not be assessed in our analysis include underlying NTMLD pathogen and NTMLD treatment regimen. Anticipating that patients with NTMLD due to M. abscessus would incur greater health care utilization and expenditures, we attempted to adjust for this pathogen based on antibiotic claims; however, NTMLD attributed to M. abscessus was likely not fully captured. Although the current study did not evaluate the impact of NTMLD treatment on economic outcomes, we hypothesize that observed declines in total expenditures at year 2 may possibly be related to benefits of treatment received during year 1; this hypothesis is the subject of a separate investigation.
We only included patients with 36 months of continuous insurance coverage (i.e., 12 months before and 24 months following an initial NTMLD claim), which could result in selection bias in estimating health care utilization and expenditures; however, the average (SD) insurance enrollment duration in all patients with NTMLD was 6.2 (2.3) years compared with 2.6 (2.5) years in the 5% sample of the general population from which control patients were drawn. Thus, we believe our analysis offers a reliable estimation of health care utilization and expenditures for the NTMLD cohort.
Conclusions
Patients with NTMLD have a significantly greater risk of hospitalization and greater total health care expenditures than matched control patients without NTMLD. Our findings underscore the economic burden of NTMLD in the United States.
APPENDIX A. Listing of ICD Codes for Baseline Diseases
| Baseline Variables | ICD-9-CM | ICD-10-CM |
|---|---|---|
| Aspergillosis | 117.3x, 484.6x, 518.6x | B44.x |
| Asthma | 493.x | J45.x |
| Atherosclerosis | 440.x | I70.x |
| Bronchiectasis | 4940, 4941, 74861, 0115 | J479, J471, J470 |
| CAD | 414.0x | I25.1x |
| Cancer | 140.x-172.x, 174.x-195.8, 200.x-208.x, 238.6 | C00.x-C26.x, C30.x-C34.x, C37.x-C41.x, C43.x, C45.x-C58.x, C60.x-C76.x, C81.x-C85.x, C88.x, C90.x-C97.x |
| CHF | 398.91, 402.01, 402.11, 402.91, 404.01, 404.03, 404.11, 404.13, 404.91, 404.93, 425.4-425.9, 428.x | I09.9, I11.0, I13.0, I13.2, I25.5, I42.0, I42.5-I42.9, I43.x, I50.x, P29.0 |
| Colitis | 556.x, 558.9 | K52.x |
| COPD | 490.x, 491.x, 492.x, 496.x | J20.x, J21.x, J40.x, J41.x, J42.x, J43.x, J44.x |
| Cystic fibrosis | 277.02 | E84.0 |
| Crohn’s disease | 555.x | K50.x |
| Depression | 311.x, 296.3 | F33.x, F32.x |
| Diabetes | 250.0-250.3, 250.4-250.7, 250.8, 250.9 | E10.0, E10.1, E10.6, E10.8, E10.9, E11.0, E11.1, E11.6, E11.8, E11.9, E12.0, E12.1, E12.6, E12.8, E12.9, E13.0, E13.1, E13.6, E13.8, E13.9, E14.0, E14.1, E14.6, E14.8, E14.9, E10.2-E10.5, E10.7, E11.2-E11.5, E11.7, E12.2-E12.5, E12.7, E13.2-E13.5, E13.7, E14.2-E14.5, E14.7 |
| GERD | 530.81, 530.84, 530.85 | K210, K219 |
| HIV | 042.x-044.x | B20.x-B22.x, B24.x |
| Hyperlipidemia | 272.0, 272.1, 272.2, 272.3, 272.4 | E78.x |
| Hypertension | 401.x | I10.x, I11.x, I12.x, I13.x, I15.x |
| Immune deficiency | 042.x, 279.x, 204.x, 202.4 | D80, D80.x, D81, D81.x, D83, D83.x, D84, D84.x, D89, D89.x, D89.xx |
| Mental disorder | 290-319 | F00-F79 |
| Metastatic carcinoma | 196.x-199.x | C77.x-C80.x |
| Multiple sclerosis | 340.x | G35.x |
| Moderate or severe liver disease | 456.0-456.2, 572.2-572.8 | I85.0, I85.9, I86.4, I98.2, K70.4, K71.1, K72.1, K72.9, K76.5, K76.6, K76.7 |
| Myocardial infarction | 410.x, 412.x | I21.x, I22.x, I25.2 |
| Obesity | 278.x | E66.x |
| Organ transplant | V42.0, V42.1, V42.6, V42.7 | Z94 |
| Pectus excavatum | 738.3, 754.81 | Q67.6, M95.4 |
| Pneumonia | 480, 481, 482, 483, 484, 485, 486 | J12, J12.x, J13, J14, J15, J15.x, J15.xx, J15.xxx, J16, J16.x, J17, J18 |
| Rheumatoid disease | 446.5, 710.0-710.4, 714.0-714.2, 714.8, 725.x | M05.x, M06.x, M31.5, M32.x-M34.x, M35.1, M35.3, M36.0 |
| Tobacco use | 305.1x, 6490.x, 989.84 | Z72.0, F17.2, 099.33 |
| Tuberculosis | 011.x | A15.x |
CAD = coronary artery disease; CHF = congestive heart failure; COPD = chronic obstructive pulmonary disease; GERD = gastroesophageal reflux disease; HIV = human immunodeficiency virus; ICD-9/10-CM = International Classification of Diseases, Ninth/Tenth Revision, Clinical Modification.
APPENDIX B. Mean Observed NTMLD-Related Health Care Utilization and Expenditures as Indicated by NTMLD-Specific Diagnostic Coding in Linked Claims
| Follow-up Year 1 | Follow-up Year 2 | |
|---|---|---|
| NTMLD (n = 1,039) | NTMLD (n = 1,039) | |
| Hospitalization, n (%) | 164 (15.8) | 41 (3.9) |
| Number of hospitalizations (among hospitalized patients) | 1.4 ± 0.87 | 1.39 ± 0.80 |
| Length of hospital stay (among hospitalized patients) | 12.0 ± 18.65 | 8.39 ± 8.73 |
| Number of hospitalizations | 0.22 ± 0.61 | 0.05 ± 0.31 |
| Length of hospital stay | 1.89 ± 8.59 | 0.33 ± 2.37 |
| Number of ED visits | 0.16 ± 0.53 | 0.03 ± 0.2 |
| Number of outpatient visitsa | 6.19 ± 7.35 | 2.4 ± 4.87 |
| Number of ancillary care servicesb | 0.38 ± 3.8 | 0.2 ± 2.13 |
| Total health care expenditures ($)c | ||
| Mean ± SD | 12,505 ± 28,357 | 5,504 ± 19,369 |
| Median (Q1, Q3) | 2,888 (880, 10,319) | 452 (9, 3,019) |
| Pharmacy | ||
| Mean ± SD | 5,869 ± 21,065 | 3,675 ± 17,395 |
| Median (Q1, Q3) | 1,207 (88, 3,599) | 110 (0, 1,653) |
| Drug administration | ||
| Mean ± SD | 4,280 ± 20,785 | 2,964 ± 17,252 |
| Median (Q1, Q3) | 16 (0, 593) | 0 (0, 192) |
| Medical | ||
| Mean ± SD | 6,636 ± 17,955 | 1,829 ± 8,022 |
| Median (Q1, Q3) | 756 (340, 3,348) | 77 (0, 501) |
| Hospitalization | ||
| Mean ± SD | 4,645 ± 16,870 | 1,071 ± 6,925 |
| Median (Q1, Q3) | 0 (0, 0) | 0 (0, 0) |
| ED | ||
| Mean ± SD | 211 ± 854 | 50 ± 355 |
| Median (Q1, Q3) | 0 (0, 0) | 0 (0, 0) |
| Outpatient | ||
| Mean ± SD | 1,590 ± 4,310 | 609 ± 2,150 |
| Median (Q1, Q3) | 517 (225, 1,246) | 0 (0, 394) |
| Ancillary | ||
| Mean ± SD | 189 ± 2,182 | 100 ± 1,268 |
| Median (Q1, Q3) | 0 (0, 0) | 0 (0, 0) |
Note: All values are mean ± standard deviation unless otherwise noted.
aOutpatient includes facility (e.g., laboratory, radiology) and professional services (e.g., pathology, immunizations and injections, rehabilitation).
bAncillary care include services for medical equipment, home health/hospice visits, services and supplies, and transportation services.
cTotal health care expenditure = pharmacy expenditure + medical expenditure; medical expenditure = inpatient hospitalization expenditure + emergency room expenditure + outpatient/office visit expenditure + ancillary care expenditure.
ED = emergency department; NTMLD = nontuberculous mycobacterial lung disease; Q1 = first quartile; Q3 = third quartile; SD = standard deviation.
References
- 1.Adjemian J, Frankland TB, Daida YG, et al. Epidemiology of nontuberculous mycobacterial lung disease and tuberculosis, Hawaii, USA. Emerg Infect Dis. 2017;23(3):439-47. [DOI] [PMC free article] [PubMed] [Google Scholar]
- 2.Winthrop K, Eagle G, Li X, Zhang R, Zhang Q.. Population-based incidence and prevalence of nontuberculous mycobacterial lung disease in a large US managed care health plan, 2008-2015. Presented at: ATS 2017 International Conference; May 19-24, 2017; Washington, DC. [Google Scholar]
- 3.Marras TK, Mendelson D, Marchand-Austin A, May K, Jamieson FB.. Pulmonary nontuberculous mycobacterial disease, Ontario, Canada, 1998-2010. Emerg Infect Dis. 2013;19(11):1889-91. [DOI] [PMC free article] [PubMed] [Google Scholar]
- 4.Park HY, Jeong BH, Chon HR, Jeon K, Daley CL, Koh WJ.. Lung function decline according to clinical course in nontuberculous mycobacterial lung disease. Chest. 2016;150(6):1222-32. [DOI] [PubMed] [Google Scholar]
- 5.Mehta M, Marras TK.. Impaired health-related quality of life in pulmonary nontuberculous mycobacterial disease. Respir Med. 2011;105(11):1718-25. [DOI] [PubMed] [Google Scholar]
- 6.Marras TK, Campitelli MA, Lu H, et al. Pulmonary nontuberculous mycobacteria-associated deaths, Ontario, Canada, 2001-2013. Emerg Infect Dis. 2017;23(3):468-76. [DOI] [PMC free article] [PubMed] [Google Scholar]
- 7.Vinnard C, Longworth S, Mezochow A, Patrawalla A, Kreiswirth BN, Hamilton K.. Deaths related to nontuberculous mycobacterial infections in the United States, 1999-2014. Ann Am Thorac Soc. 2016;13(11):1951-55. [DOI] [PMC free article] [PubMed] [Google Scholar]
- 8.Mirsaeidi M, Machado RF, Garcia JG, Schraufnagel DE.. Nontuberculous mycobacterial disease mortality in the United States, 1999-2010: a population-based comparative study. PLoS One. 2014;9(3):e91879. [DOI] [PMC free article] [PubMed] [Google Scholar]
- 9.Strollo SE, Adjemian J, Adjemian MK, Prevots DR.. The burden of pulmonary nontuberculous mycobacterial disease in the United States. Ann Am Thorac Soc. 2015;12(10):1458-64. [DOI] [PMC free article] [PubMed] [Google Scholar]
- 10.Ballarino GJ, Olivier KN, Claypool RJ, Holland SM, Prevots DR.. Pulmonary nontuberculous mycobacterial infections: antibiotic treatment and associated costs. Respir Med. 2009;103(10):1448-55. [DOI] [PMC free article] [PubMed] [Google Scholar]
- 11.Leber A, Marras TK.. The cost of medical management of pulmonary nontuberculous mycobacterial disease in Ontario, Canada. Eur Respir J. 2011;37(5):1158-65. [DOI] [PubMed] [Google Scholar]
- 12.Griffith DE, Aksamit T, Brown-Elliot BA, et al. ;. ATS Mycobacterial Diseases Subcommittee. An official ATS/IDSA statement: diagnosis, treatment, and prevention of nontuberculous mycobacterial diseases. Am J Respir Crit Care Med. 2007;175(4):367-416. [DOI] [PubMed] [Google Scholar]
- 13.Kwak N, Park J, Kim E, Lee CH, Han SK, Yim JJ.. Treatment outcomes of mycobacterium avium complex lung disease: a systematic review and meta-analysis. Clin Infect Dis. June 3, 2017 [Epub ahead of print]. Available at: https://academic.oup.com/cid/article-lookup/doi/10.1093/cid/cix517. Accessed June 28, 2018. [DOI] [PubMed] [Google Scholar]
- 14.Koh WJ, Moon SM, Kim SY, et al. Outcomes of mycobacterium avium complex lung disease based on clinical phenotype. Eur Respir J. 2017;50(3). pii: 1602503. Available at: http://erj.ersjournals.com/content/50/3/1602503.long. Accessed June 28, 2018. [DOI] [PubMed] [Google Scholar]
- 15.Wallace RJ Jr, Brown-Elliott BA, McNulty S, et al. Macrolide/Azalide therapy for nodular/bronchiectatic mycobacterium avium complex lung disease. Chest. 2014;146(2):276-82. [DOI] [PMC free article] [PubMed] [Google Scholar]
- 16.Collier SA, Stockman LJ, Hicks LA, Garrison LE, Zhou FJ, Beach MJ.. Direct health care costs of selected diseases primarily or partially transmitted by water. Epidemiol Infect. 2012;140(11):2003-13. [DOI] [PMC free article] [PubMed] [Google Scholar]
- 17.Mirsaeidi M, Allen MB, Ebrahimi G, Schraufnagel D.. Hospital costs in the US for pulmonary mycobacterial diseases. Int J Mycobacteriol. 2015;4(3):217-21. [DOI] [PMC free article] [PubMed] [Google Scholar]
- 18.Diel R, Jacob J, Lampenius N, et al. Burden of non-tuberculous mycobacterial pulmonary disease in Germany. Eur Respir J. 2017;49(4). [DOI] [PubMed] [Google Scholar]
- 19.Laugesen MJ. The resource-based relative value scale and physician reimbursement policy. Chest. 2014;146(5):1413-19. [DOI] [PubMed] [Google Scholar]
- 20.Quan H, Sundararajan V, Halfon P, et al. Coding algorithms for defining comorbidities in ICD-9-CM and ICD-10 administrative data. Med Care. 2005;43(11):1130-39. [DOI] [PubMed] [Google Scholar]
- 21.Sundararajan V, Quan H, Halfon P, et al. International Methodology Consortium for Coded Health Information (IMECCHI). Cross-national comparative performance of three versions of the ICD-10 Charlson Index. Med Care. 2007;45(12):1210-15. [DOI] [PubMed] [Google Scholar]
- 22.Hanley JA, Negassa A, Edwardes MD, Forrester JE.. Statistical analysis of correlated data using generalized estimating equations: an orientation. Am J Epidemiol. 2003;157(4):364-75. [DOI] [PubMed] [Google Scholar]
- 23.Lee MR, Sheng WH, Hung CC, Yu CJ, Lee LN, Hsueh PR.. Mycobacterium abscessus complex infections in humans. Emerg Infect Dis. 2015;21(9):1638-46. [DOI] [PMC free article] [PubMed] [Google Scholar]
- 24.Prevots DR, Marras TK.. Epidemiology of human pulmonary infection with non-tuberculous mycobacteria: a review. Clin Chest Med. 2015;36(1):13-34. [DOI] [PMC free article] [PubMed] [Google Scholar]
- 25.Kim RD, Greenberg DE, Ehrmantraut ME, et al. Pulmonary nontuberculous mycobacterial disease: prospective study of a distinct preexisting syndrome. Am J Respir Crit Care Med. 2008;178(10):1066-74. [DOI] [PMC free article] [PubMed] [Google Scholar]
- 26.Schweitzer MD, Salamo O, Campos M, Schraufnagel DE, Sadikot R, Mirsaeidi M.. Body habitus in patients with and without bronchiectasis and non-tuberculous mycobacteria. PLoS One. 2017;12(9):e0185095. [DOI] [PMC free article] [PubMed] [Google Scholar]