

Abstract
Hypoxia can occur in pancreatic β‐cells in type 2 diabetes. Although hypoxia exerts deleterious effects on β‐cell function, the associated mechanisms are largely unknown. Here, we show that the transcriptional repressor basic helix–loop–helix family member e40 (BHLHE40) is highly induced in hypoxic mouse and human β‐cells and suppresses insulin secretion. Conversely, BHLHE40 deficiency in hypoxic MIN6 cells or β‐cells of ob/ob mice reverses defects in insulin secretion. Mechanistically, BHLHE40 represses the expression of Mafa, encoding the transcription factor musculoaponeurotic fibrosarcoma oncogene family A (MAFA), by attenuating the binding of pancreas/duodenum homeobox protein 1 (PDX1) to its enhancer region. Impaired insulin secretion in hypoxic β‐cells was recovered by MAFA re‐expression. Collectively, our work identifies BHLHE40 as a key hypoxia‐induced transcriptional repressor in β‐cells that inhibit insulin secretion by suppressing MAFA expression.
Keywords: BHLHE40, hypoxia, insulin secretion, pancreatic β‐cells, transcriptional repressor
Subject Categories: Molecular Biology of Disease
Hypoxia inhibits insulin secretion in pancreatic β‐cells, but the associated mechanism is unclear. This study shows that hypoxia induces the expression of the transcriptional repressor BHLHE40 in β‐cells and that BHLHE40 inhibits insulin secretion through transcriptional repression of Mafa.
Introduction
Glucose metabolism is regulated by crosstalk between pancreatic β‐cells and insulin‐sensitive tissues. In case of insulin resistance, β‐cells increase insulin secretion to maintain normal glucose tolerance. However, when β‐cells are incapable of this task, plasma concentrations of glucose increase. Prolonged exposure to hyperglycaemia has deleterious effects on β‐cell function through various mechanisms, including oxidative stress, endoplasmic reticulum (ER) stress, and inflammation and contributes to the development and progression of type 2 diabetes (Prentki & Nolan, 2006; Kahn et al, 2014; Hudish et al, 2019). Because β‐cells are highly dependent on oxidative phosphorylation for adenosine triphosphate (ATP) production and insulin secretion, high‐glucose conditions generate relative hypoxia in β‐cells because these cells consume large amounts of oxygen (Sato et al, 2011; Bensellam et al, 2012, 2018; Ilegems et al, 2022). Importantly, hypoxia was shown to occur in vivo in islets in animal models of type 2 diabetes (Sato et al, 2011; Bensellam et al, 2012; Zheng et al, 2012; Ilegems et al, 2022). Like oxidative and ER stress, hypoxia leads to β‐cell dysfunction and loss of β‐cells, supporting the idea that hypoxia is another mechanism leading to β‐cell failure in type 2 diabetes (Kitamura, 2013; Sato et al, 2014; Gerber & Rutter, 2017; Catrina & Zheng, 2021).
Hypoxia‐inducible factor (HIF), a heterodimeric transcription factor consisting of an oxygen‐sensitive HIF‐α subunit and a constitutively expressed HIF‐1β subunit, plays critical roles in the cellular responses to hypoxia (Gunton, 2020; Lee et al, 2020). HIF induces the expression of a number of genes necessary for adaptation to hypoxia, including those involved in glycolysis, erythropoiesis, and angiogenesis. However, hyperactivation of HIF in β‐cells by von Hippel–Lindau deletion impairs insulin secretion by switching glucose metabolism from aerobic oxidative phosphorylation to anaerobic glycolysis (Zehetner et al, 2008; Cantley et al, 2009; Puri et al, 2009), suggesting that unregulated overactivation of HIF may cause β‐cell dysfunction (Gunton, 2020; Catrina & Zheng, 2021). Besides gene induction, transcriptional repression of genes also occurs in response to hypoxia and was found to involve several transcription repressors, such as RE1 silencing transcription factor (REST), BTB and CNC homology 1 (BACH1), zinc finger E‐box binding homeobox 1 (ZEB1), and inhibitor of DNA binding 2 (ID2; Cavadas et al, 2017). Previously, we reported that hypoxia causes the downregulation of a number of β‐cell genes involved in insulin secretion in mouse islets and MIN6 β‐cells (Sato et al, 2014). However, the mechanisms of hypoxia‐induced transcriptional repression in β‐cells and the contribution of gene repression to β‐cell dysfunction are largely unknown.
In the present study, we identified the transcriptional repressor basic helix–loop–helix family member e40 (BHLHE40) as being highly induced in β‐cells under hypoxic conditions and found that it inhibits glucose‐stimulated insulin secretion by suppressing the transcription of Mafa, which encodes musculoaponeurotic fibrosarcoma oncogene family A (MAFA), a transcription factor that plays critical roles in insulin secretion. We also showed that BHLHE40 deficiency reversed decreased insulin secretion by hypoxic β‐cells in vitro and in vivo. Our findings present a new scenario in which hypoxia impairs β‐cell function through activation of the transcriptional repressor BHLHE40.
Results
Global gene expression in hypoxic β‐cells and islets
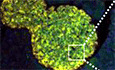
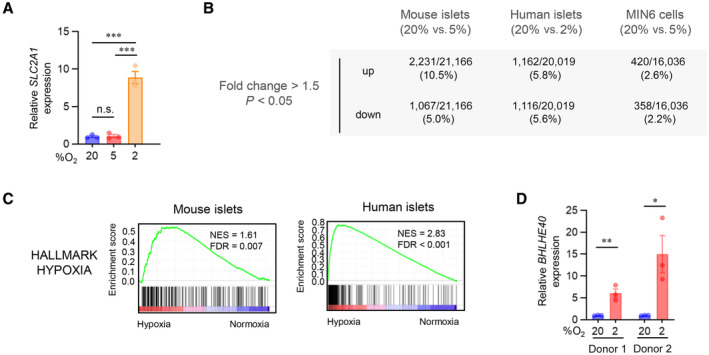
To assess the impact of hypoxia on the global gene expression of β‐cells, we first performed RNA sequencing (RNA‐seq) on both mouse and human islets cultured under normal and low oxygen conditions. We previously reported that hypoxic responses occur at 5–7% oxygen tension in MIN6 cells and mouse islets and that 3% hypoxia for 24 h markedly increases MIN6 cell death (Sato et al, 2011, 2014). On the other hand, in human islets, a hypoxic response (induction of SLC2A1 expression) was induced by exposure to 2% but not 5% oxygen tension (Fig EV1A) without apparent cell death. Therefore, for the hypoxic experiments, we used 5% oxygen in MIN6 cells and mouse islets and 2% oxygen in human islets. Approximately 5% of expressed mRNAs were significantly downregulated at least 1.5‐fold in hypoxic compared with nonhypoxic islets (mouse, 20 vs. 5%, respectively; human, 20 vs. 2%, respectively; Fig EV1B). Consistent with our previous findings (Sato et al, 2014), under hypoxic conditions the expression of a number of β‐cell genes with important roles in insulin secretion was decreased in islets (Fig 1A). Gene set enrichment analysis (GSEA) revealed that two hallmark gene sets (pancreas beta cells and oxidative phosphorylation) were significantly downregulated in both mouse and human islets in hypoxia and one hallmark gene set (hypoxia) was significantly upregulated (Figs 1B and EV1C). We hypothesized that transcriptional repressors are involved in the suppression of β‐cell genes under hypoxic conditions. To identify the hypoxia‐sensitive repressors in β‐cells, we compared the RNA‐seq–based data of hypoxia‐induced genes in mouse islets, human islets, and MIN6 cells and found that 25 genes were elevated (Fig 1C). By analyzing the gene ontology of these genes, we discovered that activating transcription factor 3 (ATF3) and BHLHE40 are associated with transcriptional repression (Fig 1C). In addition, BHLHE41, REST, BACH1, ID1, ID2, ZEB1/ZEB2, and SNAI1 were reported elsewhere to function as hypoxia‐induced transcriptional repressors (Cavadas et al, 2017). Among all these repressor genes, in our study, Bhlhe40 mRNA was the most significantly increased in hypoxic mouse islets, human islets, and MIN6 cells (Fig 1D–F). Hypoxia‐induced upregulation of BHLHE40 was also detected in human islets from an independent donor (donor 2; Fig EV1D). BHLHE40 (also referred to as DEC1/SHARP2/STRA13) is a member of the basic helix–loop–helix (bHLH) family and functions primarily as a transcriptional repressor by binding to DNA at class B E‐box motifs (St‐Pierre et al, 2002). It plays pivotal roles in many biological processes, including cellular differentiation, cell growth, growth arrest, circadian rhythm, immunological response, and hypoxia, but its biological function in β‐cells is unknown. Accordingly, we focused on the role of BHLHE40 in hypoxic β‐cells.
Figure EV1. Hypoxia caused extensive transcriptional upregulation and repression in β‐cells.
- qRT–PCR analysis of SLC2A1 expression in human islets cultured under the indicated oxygen concentrations for 24 h (n = 3 biological replicates from donor 1 sample).
- The number and the ratio of the genes that were significantly upregulated or downregulated (fold change > 1.5, P < 0.05) by hypoxia in mouse islets (20 vs. 5% O2 for 24 h, n = 3 mice/group), human islets (20% [n = 2 biological replicates from donor 1 sample] vs. 2% [n = 3 biological replicates from donor 1 sample] O2 for 24 h), and MIN6 cells (20 vs. 5% O2 for 6 h, n = 3 biological replicates).
- Gene set enrichment analysis of RNA‐seq data showed that the hypoxia gene set was significantly upregulated in both hypoxic mouse and human islets.
- qRT–PCR analysis of BHLHE40 expression in human islets from two donors (donor 1 and donor 2) cultured under 20 or 2% oxygen concentrations for 24 h (n = 3 biological replicates).
Data information: Data are mean ± SEM; *P < 0.05, **P < 0.01, and ***P < 0.001 by unpaired two‐tailed Student's t‐test. n.s.—not significant.
Source data are available online for this figure.
Figure 1. Global gene expression in hypoxic β‐cells and islets.
-
AHeatmap of β‐cell genes in mouse islets (20% vs. 5% O2 for 24 h; n = 3 mice/group) and human islets (20% [n = 2 biological replicates from donor 1 sample] or 2% [n = 3 biological replicates from donor 1 sample] O2 for 24 h).
-
BGene set enrichment analysis of mouse islets (20% vs. 5% O2 for 24 h; n = 3 mice/group) and human islets (20% [n = 2 biological replicates from donor 1 sample] or 2% [n = 3 biological replicates from donor 1 sample] O2 for 24 h).
-
CRNA‐seq data of hypoxia‐induced genes in mouse islets (20% vs. 5% O2 for 24 h; n = 3 mice/group), human islets (20% [n = 2 biological replicates from donor 1 sample] vs. 2% [n = 3 biological replicates from donor 1 sample] O2 for 24 h), and MIN6 cells (20% vs. 5% O2 for 6 h; n = 3 biological replicates). The Venn diagram shows the coordinated elevation of 25 genes, two of which (Atf3 and Bhlhe40) are associated with transcriptional repression.
-
D–FVolcano plots showing RNA‐seq data in mouse islets (20% vs. 5% O2 for 24 h; n = 3 mice/group; D), human islets (20% [n = 2 biological replicates from donor 1 sample] vs. 2% [n = 3 biological replicates from donor 1 sample] O2 for 24 h; E), and MIN6 cells (20% vs. 5% O2 for 6 h; n = 3 biological replicates; F). Atf3, Bhlhe40, and other reported hypoxia‐inducible transcriptional repressor genes (Cavadas et al, 2017) are shown (red, significantly upregulated genes).
Regulation of Bhlhe40 expression in hypoxic β‐cells and islets
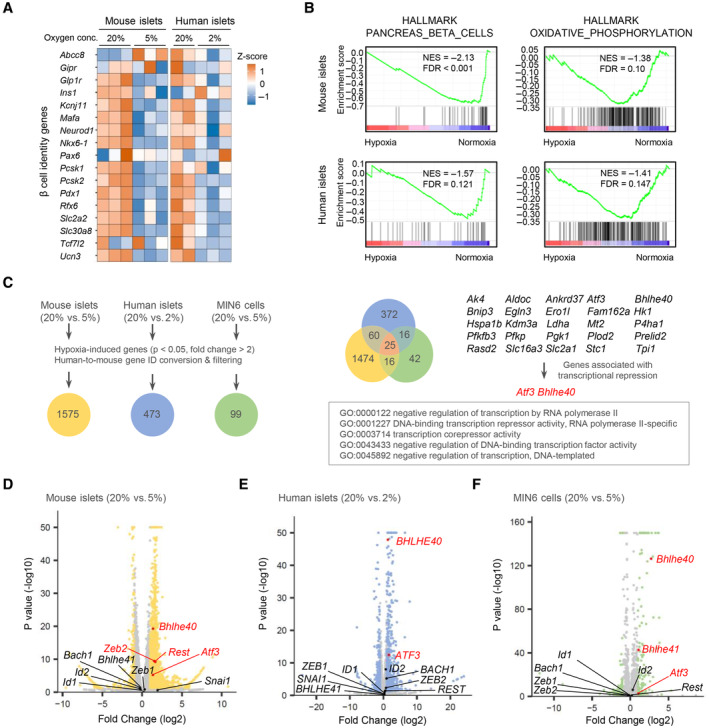
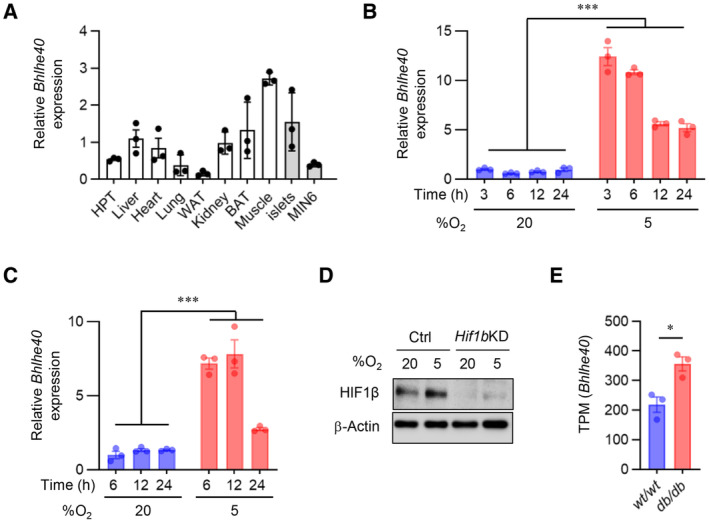
BHLHE40 was expressed ubiquitously in adult mouse tissues, including pancreatic islets and MIN6 cells (Figs 2A and EV2A). Hypoxia rapidly increased the expression of Bhlhe40 mRNA, that is, within 3 h, but a marked upregulation of BHLHE40 protein was noted at 12 h and this upregulation persisted at 24 h in MIN6 cells (Figs 2B and EV2B). Increased BHLHE40 expression in hypoxia was also detected in mouse islets (Figs 2C and EV2C).
Figure 2. BHLHE40 expression and its regulation in hypoxic β‐cells and islets.
-
A–CWestern blots of BHLHE40 expression across tissues (A), BHLHE40 expression in MIN6 cells cultured under 20 or 5% O2 for the indicated time (B) and the quantification of B (n = 3 biological replicates), and BHLHE40 expression in mouse islets cultured under 20 or 5% O2 for 24 h (C).
-
D–FThe effect of oxidative stress, endoplasmic reticulum stress, and energy stress on BHLHE40 expression. qRT–PCR analysis of Bhlhe40 in MIN6 cells incubated with 10 μM H2O2 (n = 3 biological replicates; D), 2 μM thapsigargin (Thap) or 5 μg/ml tunicamycin (Tun) (n = 7 biological replicates; E), or 2 mM metformin (Met) for 24 h (n = 3 biological replicates; F).
-
GThe effect of short‐hairpin RNA‐mediated Hif1β knockdown (KD) on BHLHE40 expression in MIN6 cells cultured under 20 or 5% O2 for 24 h (n = 3 biological replicates).
-
H–KBHLHE40 expression in islets from diabetic mice. BHLHE40 expression was analyzed in ob/ob mouse islets by qRT–PCR (n = 4 biological replicates; H) and Western blotting (I) and in db/db mouse islets by Western blotting (J). Subcellular localization of BHLHE40 in ob/ob mice islets by immunohistochemical analysis (K).
Data information: Data are mean ± SEM; *P < 0.05, **P < 0.01, and ***P < 0.001 by unpaired two‐tailed Student's t‐test. Glyceraldehyde‐3‐phosphate dehydrogenase (GAPDH) or β‐actin was used as a loading control. Scale bar, 100 μm. HPT—hypothalamus; Ctrl—control; n.s.—not significant.
Source data are available online for this figure.
Figure EV2. Elevated BHLHE40 expression in hypoxic and diabetic β‐cells.
-
ABhlhe40 expression across tissues by qRT–PCR (n = 3 biological replicates).
-
B, CBhlhe40 expression in MIN6 cells (n = 3 biological replicates; B) and mouse islets (n = 3 biological replicates; C) cultured under 20 or 5% O2 for the indicated time assessed by qRT–PCR.
-
DMIN6 cells expressing shRNA against a nontargeting Ctrl or Hif1β were cultured under 20 or 5% O2 for 6 h, and then the protein samples were collected. Knockdown (KD) of Hif1β was confirmed by Western blotting.
-
EThe reanalysis of previously published RNA‐seq data of db/db mouse islets showed significant upregulation of Bhlhe40 (n = 3 mice).
Data information: Data are mean ± SEM; *P < 0.05 and ***P < 0.001 by unpaired two‐tailed Student's t‐test. Ctrl—control. HPT—hypothalamus.
Source data are available online for this figure.
Hypoxia induces oxidative and ER stress and activation of AMP‐activated protein kinase (AMPK; Zheng et al, 2012; Görlach et al, 2015; Sato et al, 2017). However, in our study, oxidative stress (caused by treatment with H2O2), ER stress (caused by treatment with thapsigargin or tunicamycin), and AMPK activation (caused by treatment with metformin) did not increase expression of Bhlhe40 mRNA in MIN6 cells (Fig 2D–F), suggesting that these processes are not involved in the induction of Bhlhe40. Previous studies showed that HIF‐1 is involved in hypoxia‐induced Bhlhe40 expression (Miyazaki et al, 2002; Yun et al, 2002). Consistent with this finding, hypoxia‐induced Bhlhe40 mRNA expression was partially inhibited by the suppression of HIF‐1β (Figs 2G and EV2D), indicating that hypoxia‐induced Bhlhe40 expression is partially HIF dependent in β‐cells. We and others demonstrated that hypoxia occurs in islets in animal models of type 2 diabetes (Sato et al, 2011; Bensellam et al, 2012; Zheng et al, 2012). Consistent with this finding, levels of Bhlhe40 mRNA and BHLHE40 were significantly elevated (2.3‐fold and 4.5‐fold, respectively) in islets of ob/ob mice (Fig 2H and I). Upregulation of BHLHE40 was detected also in islets of db/db mice (Figs 2J and EV2E). Intracellular localization of BHLHE40 varies by cells (Ivanova et al, 2005). Immunohistochemical analysis revealed strong BHLHE40 immunoreactivity in the cytoplasm of islets in ob/ob mice, but BHLHE40 staining was clearly detected also in the nucleus of islets (Fig 2K). The nuclear localization of BHLHE40 supports its function as a transcriptional repressor.
BHLHE40 controls insulin secretion in β‐cells
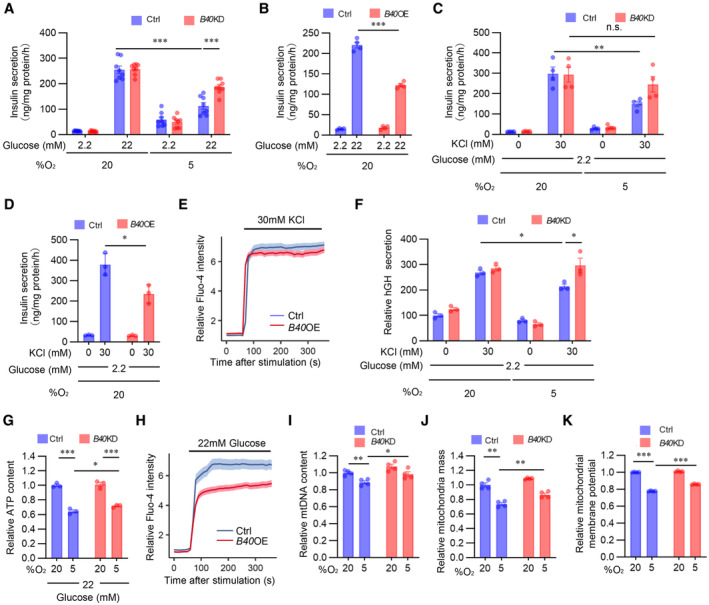
To explore the role of BHLHE40 in β‐cells, we generated Bhlhe40 knockdown (KD) MIN6 cells. Bhlhe40 deletion efficiency was 73.5% in MIN6 cells (Fig EV3A). Although BHLHE40 is reported to be involved in cell cycle and apoptosis regulation (Sato et al, 2016), hypoxia‐induced growth inhibition (Fig EV3B) and cell death (Fig EV3C and D) were not restored in Bhlhe40 KD MIN6 cells. Next, we investigated the impact of Bhlhe40 KD on glucose‐stimulated insulin secretion. As described previously (Sato et al, 2014), insulin secretion by high glucose was significantly decreased under hypoxic conditions without affecting insulin content (Figs 3A and EV3E). Of note, Bhlhe40 KD significantly restored hypoxia‐related decreased insulin secretion (Fig 3A), and conversely, Bhlhe40 overexpression significantly attenuated insulin secretion without affecting the insulin content (Figs 3B and EV3F and G). These results indicate that BHLHE40 is involved in suppressing the glucose‐stimulated insulin secretion. Glucose‐stimulated insulin secretion occurs after the generation of ATP through the metabolism of glucose. The increase of the ATP/ADP ratio leads to the closure of ATP‐sensitive K+ channels, membrane depolarization, an increase of cytosolic [Ca2+]i via activation of voltage‐dependent Ca2+ channels, and eventually the exocytosis of insulin‐containing secretory granules (Rorsman & Renström, 2003).
Figure EV3. BHLHE40 functions in MIN6 cells.
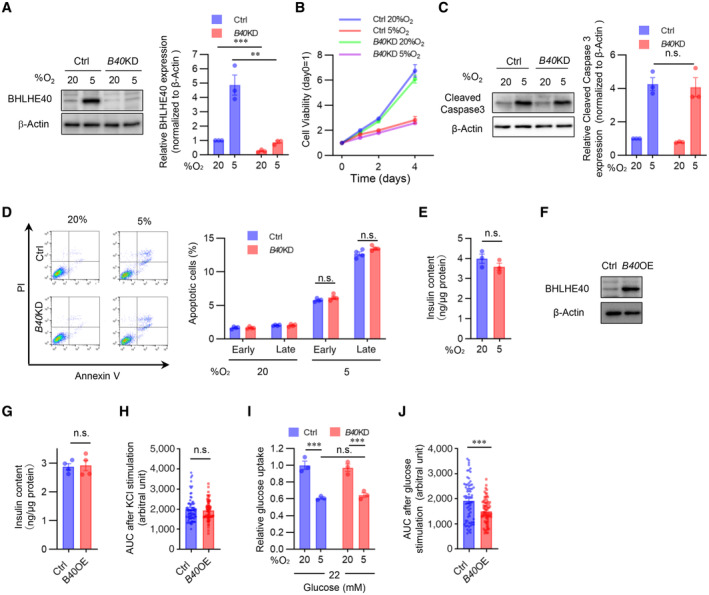
- Confirmation of Bhlhe40 knockdown by Western blotting in control (Ctrl) and Bhlhe40 knockdown (B40 KD) MIN6 cells cultured under 20 or 5% O2 for 24 h, and quantification of BHLHE40 band intensities (n = 3 biological replicates).
- Cell proliferation in Ctrl and B40 KD MIN6 cells cultured under 20 or 5% O2 for the indicated times (n = 6 biological replicates).
- Western blot of cleaved caspase‐3 expression in Ctrl and B40 KD MIN6 cells cultured under 20 or 5% O2 for 24 h, and quantification of cleaved caspase‐3 band intensities (n = 3 biological replicates).
- Quantification of early (Annexin V+ PI−) / late (Annexin V+ PI+) apoptotic cells in Ctrl and B40 KD MIN6 cells cultured under 20 or 5% O2 for 24 h (n = 4 biological replicates).
- Insulin contents in MIN6 cells cultured under 20 or 5% O2 for 24 h (n = 3 biological replicates).
- Confirmation of BHLHE40 overexpression in Ctrl and B40 OE MIN6 cells by Western blotting.
- Insulin content of Ctrl and B40 OE MIN6 cells (n = 4 biological replicates).
- AUC of Fig 4E (n = 70 cells from n = 3 biological replicates).
- Glucose uptake in Ctrl and B40 KD MIN6 cells cultured under 20 or 5% O2 for 24 h (n = 3 biological replicates).
- AUC of Fig 4H (n = 70 cells from n = 3 biological replicates).
Data information: Data are mean ± SEM; **P < 0.01 and ***P < 0.001 by unpaired two‐tailed Student's t‐test. n.s.—not significant.
Source data are available online for this figure.
Figure 3. BHLHE40 controls insulin secretion in β‐cells.
-
AGlucose‐stimulated insulin secretion in MIN6 cells expressing short‐hairpin RNA against a nontargeting Ctrl or Bhlhe40 knockdown (B40 KD) were cultured under 20 or 5% O2 for 24 h (n = 8 biological replicates).
-
BGlucose‐stimulated insulin secretion in MIN6 cells infected with retroviruses generated with pMx‐Ctrl (Ctrl) or pMx‐Bhlhe40 (B40 OE; n = 4 biological replicates).
-
CKCl‐stimulated insulin secretion in Ctrl and B40 KD MIN6 cells cultured under 20 or 5% O2 for 24 h (n = 4 biological replicates).
-
DKCl‐stimulated insulin secretion in Ctrl and B40 OE MIN6 cells (n = 3 biological replicates).
-
ECalcium influx stimulated by 30 mM KCl in Ctrl and B40 OE MIN6 cells (n = 70 cells from n = 3 biological replicates).
-
FhGH secretion after stimulation by 2.2 mM glucose or 2.2 mM glucose plus 30 mM KCl in Ctrl and B40 KD MIN6 cells cultured under 20 or 5% O2 for 24 h (n = 3 biological replicates).
-
GCellular ATP content in Ctrl and B40 KD MIN6 cells cultured under 20 or 5% O2 for 24 h (n = 3 biological replicates).
-
HCalcium influx stimulated by 22 mM glucose in Ctrl and B40 OE MIN6 cells (n = 70 cells from n = 3 biological replicates).
-
I–KMitochondrial DNA (mtDNA) content (n = 4 biological replicates; I), mitochondrial mass (n = 4 biological replicates; J), and mitochondrial membrane potential (n = 4 biological replicates; K) in Ctrl and B40 KD MIN6 cells cultured under 20 or 5% O2 for 24 h.
Data information: Data are mean ± SEM; *P < 0.05, **P < 0.01, and ***P < 0.001 by unpaired two‐tailed Student's t‐test. Ctrl—control; n.s.—not significant.
Source data are available online for this figure.
High K+‐induced membrane depolarization evokes Ca2+‐dependent insulin exocytosis from β‐cells. We next investigated the role of BHLHE40 on KCl‐stimulated insulin secretion. As in the case of glucose, a significant decrease in KCl‐stimulated insulin secretion was detected in hypoxic MIN6 cells but not in hypoxic Bhlhe40 KD MIN6 cells (Fig 3C). KCl produced a significantly smaller insulin secretion in MIN6 cells overexpressing Bhlhe40 than in control MIN6 cells (Fig 3D). The observation that KCl induced an equivalent increase of [Ca2+]i levels in both cells overexpressing Bhlhe40 and control cells (Figs 3E and EV3H) suggests that BHLHE40 affects steps after [Ca2+]i elevation. Next, we further explored the role of BHLHE40 on exocytosis by transfecting MIN6 cells with a human growth factor (hGH) expression vector. In transfected cells, hGH is targeted to insulin‐containing secretory granules, and hGH release can be used to monitor exocytosis from the cells (Coppola et al, 1999; Fukui et al, 2005). As shown in Fig 3F, KCl‐induced hGH secretion was significantly decreased under hypoxic conditions, and the decrease was almost completely reversed by Bhlhe40 KD. These results emphasize the role of BHLHE40 in exocytosis in MIN6 cells.
To investigate the possibility that BHLHE40 affects multiple steps during glucose‐stimulated insulin secretion, we next examined glucose uptake in Bhlhe40 KD and control MIN6 cells. Uptake of 2‐NBDG, a fluorescent derivative of glucose, was decreased by hypoxia, but Bhlhe40 KD did not affect 2‐NBDG uptake in MIN6 cells (Fig EV3I), indicating that BHLHE40 does not affect glucose uptake. In line with our previous study (Sato et al, 2014), ATP levels in MIN6 cells were decreased under hypoxic conditions, and the decrease of ATP levels was significantly restored by Bhlhe40 KD (Fig 3G). In addition, glucose‐stimulated [Ca2+]i levels were significantly attenuated by Bhlhe40 overexpression (Figs 3H and EV3J). These results indicate that BHLHE40 suppresses glucose‐stimulated ATP generation and the increase of [Ca2+]i levels in MIN6 cells. Because mitochondria play important roles in ATP generation, we next investigated the impact of BHLHE40 on mitochondrial homeostasis. As shown in Fig 3I and J, the decreased mitochondrial DNA content and mass under hypoxic conditions were significantly recovered by Bhlhe40 KD in MIN6 cells. Hypoxia significantly decreased the mitochondrial membrane potential, as measured with the voltage‐sensitive mitochondrial dye MitoTracker Red (Fig 3K). Of note, BHLHE40 suppression recovered the loss of mitochondrial membrane potential in hypoxic MIN6 cells. These results strongly suggest that BHLHE40 suppresses mitochondrial biogenesis and function. Taken together, our results show that BHLHE40 affects at least two different steps, that is, ATP generation and exocytosis, during insulin secretion.
BHLHE40 suppresses Mafa expression in β‐cells
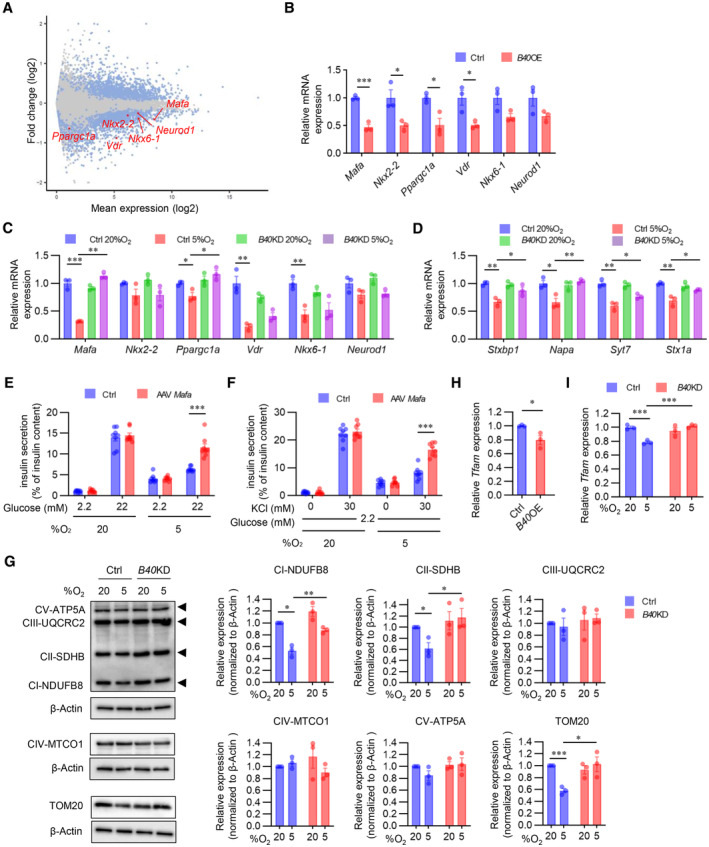
To further understand how BHLHE40 regulates insulin secretion, we performed RNA‐seq analysis in control MIN6 cells and MIN6 cells overexpressing Bhlhe40. Compared with control MIN6 cells, MIN6 cells overexpressing Bhlhe40 showed 2,630 differentially expressed genes (1,288 downregulated and 1,342 upregulated; adjusted P < 0.01; Fig 4A). Gene ontology analysis revealed that the downregulated genes included transcription genes with critical roles during insulin secretion, including Mafa, Nkx2‐2, Ppargc1a, Vdr, Nkx6‐1, and Neurod1 (Figs 4A and EV4A). Quantitative real‐time polymerase chain reaction (qRT–PCR) in independent samples confirmed the significant downregulation of Mafa, Nkx2‐2, Ppargc1a, and Vdr expression by Bhlhe40 overexpression (Fig 4B). To validate that BHLHE40 functions as a repressor of these genes, we next examined their expression in Bhlhe40 KD MIN6 cells under hypoxic conditions. Hypoxia significantly decreased Mafa, Ppargc1a, Vdr, and Nkx6‐1 mRNA, but the downregulation of Mafa was completely restored by KD of Bhlhe40 (Fig 4C). At the protein level, the suppression of MAFA by BHLHE40 and restoration of hypoxia‐induced downregulation of MAFA by BHLHE40 deficiency were also detected (Fig EV4B and C). MAFA regulates genes required for insulin exocytosis, including Stxbp1 (encoding MUNC18‐1), Napa (encoding N‐ethylmaleimide‐sensitive factor attachment protein), Syt7 (encoding synaptotagmin 7), and Stx1a (encoding syntaxin1A; Nagamatsu et al, 1999; Ohara‐Imaizumi et al, 2007; Oh et al, 2012; Hang et al, 2014; Dolai et al, 2016; Cataldo et al, 2022). Under hypoxic conditions, Bhlhe40 KD also significantly restored the downregulation of Stxbp1, Napa, Syt7, and Stx1a (Fig 4D). Moreover, adeno‐associated virus (AAV)‐mediated overexpression of Mafa significantly increased the expression of these genes in MIN6 cells under hypoxic conditions (Fig EV4D and E). MAFA plays a critical role in both glucose‐ and KCl‐stimulated insulin secretion (Zhang et al, 2005; Hang et al, 2014). Overexpression of Mafa did not alter the insulin content of hypoxic MIN6 cells (Fig EV4F). However, the glucose‐ and KCl‐related decrease in insulin secretion (adjusted by insulin content) in hypoxic conditions was significantly restored by overexpression of Mafa (Fig 4E and F). ATP generation in MIN6 cells was not affected by Mafa overexpression (Fig EV4G). These results indicate that BHLHE40 suppresses insulin secretion, at least in part, by reducing the expression of MAFA in β‐cells.
Figure 4. BHLHE40 suppresses Mafa expression in β‐cells.
-
AMA plot of RNA‐seq data in Ctrl and B40 OE MIN6 cells. Differentially expressed genes (DEGs; adjusted P‐value < 0.01) are shown in blue, and others in gray. DEGs functioning as β‐cell transcription factors are shown in red (n = 3 biological replicates).
-
B, CExpression of DEGs shown in (A) was confirmed by qRT–PCR in Ctrl and B40 OE MIN6 cells (n = 3 biological replicates; B) or Ctrl and B40 KD MIN6 cells cultured under 20 or 5% O2 for 24 h (n = 3 biological replicates; C).
-
DqRT–PCR of MAFA target genes in Ctrl and B40 KD MIN6 cells cultured under 20 or 5% O2 for 24 h (n = 3 biological replicates).
-
EGlucose‐stimulated insulin secretion in MIN6 cells infected with AAV‐GFP (Ctrl) or AAV‐Mafa cultured under 20 or 5% O2 for 24 h (n = 8 biological replicates). Insulin secretion was corrected for insulin content.
-
FKCl‐stimulated insulin secretion in Ctrl and AAV‐Mafa MIN6 cells cultured under 20 or 5% O2 for 24 h (n = 8 biological replicates). Insulin secretion was corrected for insulin content.
-
GWestern blot of oxidative phosphorylation complex proteins and TOM20 protein in Ctrl and B40 KD MIN6 cells cultured under 20 or 5% O2 for 24 h, and quantification of the band intensities (n = 3 biological replicates).
-
H, IqRT–PCR analysis of Tfam expression in Ctrl and B40 OE MIN6 cells (n = 3 biological replicates; H) and in Ctrl and B40 KD MIN6 cells cultured under 20 or 5% O2 for 24 h (n = 3 biological replicates; I).
Data information: Data are mean ± SEM; *P < 0.05, **P < 0.01, and ***P < 0.001 by unpaired two‐tailed Student's t‐test. β‐actin was used as a loading control. Ctrl—control.
Source data are available online for this figure.
Figure EV4. MAFA is repressed by BHLHE40.
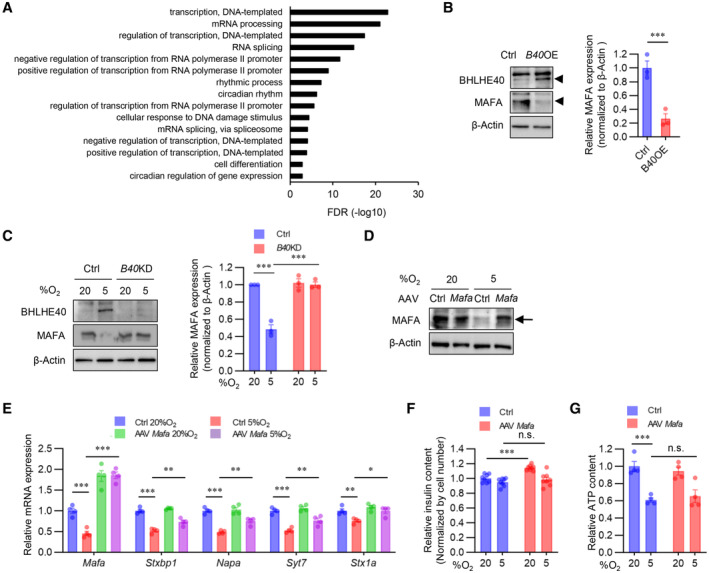
- Gene ontology analysis of RNA‐seq data in Ctrl and B40 OE MIN6 cells. Downregulated DEGs (adjusted P‐value < 0.01) were used as input.
- Western blot of BHLHE40 and MAFA expression in Ctrl and B40 OE MIN6 cells, and quantification of MAFA band intensities (n = 3 biological replicates).
- Western blot of BHLHE40 and MAFA expression in Ctrl and B40 KD MIN6 cells cultured under 20 or 5% O2 for 24 h, and quantification of MAFA band intensities (n = 3 biological replicates).
- Western blot confirming MAFA overexpression in MIN6 cells infected with AAV‐GFP (Ctrl) and AAV‐Mafa and cultured under 20 or 5% O2 for 24 h.
- qRT–PCR of MAFA target genes in MIN6 cells infected with AAV‐GFP (Ctrl) or AAV‐Mafa cultured under 20 or 5% O2 for 24 h (n = 4 biological replicates).
- Insulin content of Ctrl and AAV‐Mafa MIN6 cells cultured under 20 or 5% O2 for 24 h (n = 8 biological replicates). Insulin secretion was normalized by cell number.
- Cellular ATP content in Ctrl and AAV‐Mafa MIN6 cells cultured under 20 or 5% O2 for 24 h (n = 4 biological replicates).
Data information: Data are mean ± SEM; *P < 0.05 and **P < 0.01, and ***P < 0.001 by unpaired two‐tailed Student's t‐test. Ctrl—control. n.s.—not significant.
Source data are available online for this figure.
Peroxisome proliferator‐activated receptor‐γ coactivator 1‐α (PGC‐1α), which is encoded by Ppargc1a, regulates mitochondrial biogenesis and oxidative phosphorylation (Puigserver & Spiegelman, 2003). Previous studies revealed that BHLHE40 acts as a transcriptional repressor of Ppargc1a (Chung et al, 2015; LaGory et al, 2015). Consistent with this finding, Ppargc1a expression was significantly downregulated by Bhlhe40 overexpression in MIN6 cells, and the hypoxia‐induced downregulation of Ppargc1a was recovered by KD of Bhlhe40 (Fig 4B and C). The mitochondrial respiratory subunits NDUFB8 and SDHB and the mitochondrial import receptor subunit TOM20 are known targets of PGC‐1α (Kelly & Scarpulla, 2004; Scarpulla, 2008). The protein levels of NDUFB8, SDHB, and TOM20 were decreased by hypoxia, but the decrease was significantly reversed by Bhlhe40 KD (Fig 4G). PGC‐1α also induces the expression of mitochondrial transcription factor A (TFAM) (Puigserver & Spiegelman, 2003). Tfam expression was significantly downregulated by Bhlhe40 overexpression, and the hypoxia‐induced downregulation of Tfam was recovered by KD of Bhlhe40 in MIN6 cells (Fig 4H and I). These results indicate that Ppargc1a is another target gene of BHLHE40 in MIN6 cells. In these experimental conditions, Bhlhe40 KD did not affect the expression of Nkx2‐2, Vdr, Nkx6‐1, or Neurod1 mRNAs (Fig 4C).
BHLHE40 controls Mafa expression via two E‐box sites in the enhancer region
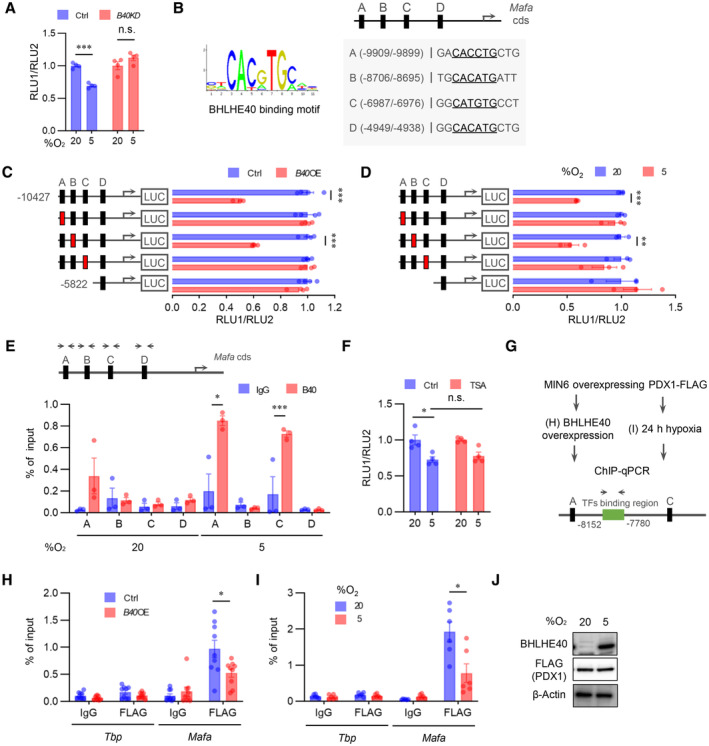
To further explore the mechanism by which BHLHE40 suppresses Mafa expression in β‐cells, we performed a reporter gene assay with a reporter plasmid. We included the mouse Mafa enhancer/promoter region (−10,427 to +22 bp to transcriptional start site) because it shows maximum Mafa promoter activity in β‐cells (Raum et al, 2006; Yamamoto et al, 2013). Mafa reporter gene activity was significantly decreased under hypoxic conditions, but the reduction was abolished by Bhlhe40 KD (Fig 5A). BHLHE40 binds to E‐box sequence (5′‐CANNTG‐3′) to suppress its target genes. Screening of the JASPAR database (Mathelier et al, 2016) revealed four E‐box sites (A, −9,909/−9,899; B, −8,705/−8,695; C, −6,987/−6,976; and D, −4949/4938, relative score > 0.9) within the −10,427/+22 region (Fig 5B). Overexpression of Bhlhe40 suppressed the activity of the reporter gene in MIN6 cells, but mutation of the A or C site in the reporter gene abolished the reduction of transcriptional activity by BHLHE40 (Fig 5C). Consistent with this finding, the suppression of the reporter gene activity by hypoxia also was attenuated by mutation of these two sites (Fig 5D). Furthermore, chromatin immunoprecipitation (ChIP) assay revealed enhanced binding of BHLHE40 to A and C sites in MIN6 cells under hypoxic conditions (Fig 5E). These results indicate that BHLHE40 suppresses Mafa expression by binding to the A or C site. BHLHE40 is reported to repress the transcription of the target genes by recruiting histone deacetylase (HDAC; Sun & Taneja, 2000; Chung et al, 2015). However, treatment with trichostatin A (TSA), an HDAC inhibitor, failed to affect the reduced reporter gene activity in hypoxic MIN6 cells (Fig 5F).
Figure 5. BHLHE40 controls Mafa expression via two E‐box sites in the enhancer region.
-
AReporter gene analysis with luciferase plasmid infused with mouse MAFA promoter/enhancer (−10,427/+22 bp from transcription start site) in Ctrl and B40 KD MIN6 cells cultured under 20 or 5% O2 for 24 h (n = 4 biological replicates).
-
BBHLHE40‐binding motif (left) and JASPAR results (right) are presented. JASPAR predicted four E‐box sites for BHLHE40 binding on MAFA promoter/enhancer (relative score > 0.9, E‐box sites are underlined).
-
CLuciferase reporter assay was performed with MIN6 cells transfected with BHLHE40 expression plasmids, pRL‐SV40 plasmid, and pGL3‐Mafa plasmids (wild‐type [black] and E‐box mutated [red] sites; n = 4 biological replicates).
-
DLuciferase reporter activity in MIN6 cells cultured under 20 or 5% O2 for 24 h (n = 3 biological replicates).
-
EMIN6 cells were cultured in 20 or 5% O2 for 24 h, and then the proteins were immuno‐precipitated by IgG or anti‐BHLHE40 specific antibody, after which qRT–PCR was performed for the indicated regions (n = 3 biological replicates).
-
FLuciferase reporter assay in MIN6 cells incubated with 0.1 μM TSA or vehicle for 24 h (n = 4 biological replicates).
-
GChIP–qPCR scheme for checking PDX‐1 binding to Mafa enhancer.
-
H–JProteins sampled from Ctrl and B40 OE MIN6 cells with FLAG‐Pdx1 expression (H) or from MIN6 cells with FLAG‐Pdx1 expression precultured under 20 or 5% O2 for 24 h (I) were immuno‐precipitated by IgG or anti‐FLAG antibody, after which qRT–PCR was performed for the indicated regions (n = 9 biological replicates for H and n = 6 biological replicates for I). FLAG (PDX1) expression in (I) was confirmed by Western blotting (J).
Data information: Data are mean ± SEM; *P < 0.05 **P < 0.01, and ***P < 0.001 by unpaired two‐tailed Student's t‐test. Ctrl—control; n.s.—not significant.
Source data are available online for this figure.
The transcription factor pancreas/duodenum homeobox protein 1 (PDX1) was reported to regulate Mafa expression in β‐cells by binding to the enhancer region (−8,152 to −7,780 relative to the transcription start site; Raum et al, 2006, 2010). Therefore, we investigated whether BHLHE40 represses Mafa expression by inhibiting PDX1 binding (Fig 5G). Intriguingly, the ChIP assay revealed that BHLHE40 significantly reduced PDX1 binding to the Mafa gene in MIN6 cells (Fig 5H). The reduction of PDX1 binding to the Mafa gene was also detected under hypoxic conditions (Fig 5G, I, and J). These results suggest that BHLHE40 controls Mafa expression, at least in part, by affecting the binding of PDX1.
Deficiency of BHLHE40 improves hyperglycaemia in ob/ob mice
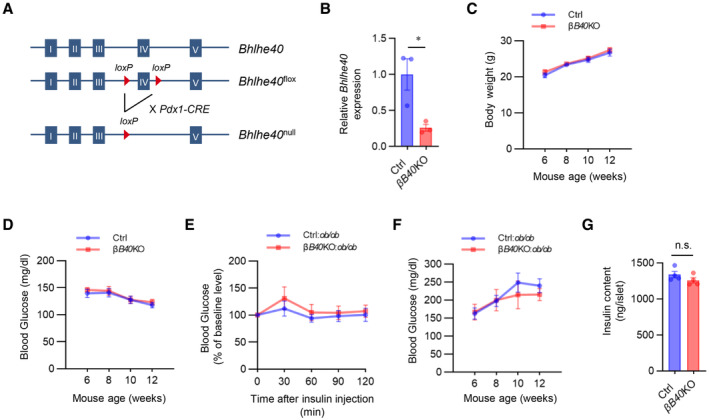
To evaluate the role of BHLHE40 in vivo, we generated β‐cell–specific Bhlhe40 knockout (βB40KO) mice by crossing Pdx1‐Cre mice (Skarnes et al, 2011) with floxed Bhlhe40 (Bhlhe40 fl ) mice (Fig EV5A). The Bhlhe40 deletion efficiency in the βB40KO islets was 74.1% (Fig EV5B). Body weight (Fig EV5C) and nonfasting blood glucose concentration (Fig EV5D) were similar in βB40KO and Bhlhe40 fl/fl mice, and the intraperitoneal glucose tolerance test also showed no differences in blood glucose levels among Pdx1‐Cre, Bhlhe40 fl/fl , and βB40KO mice (Fig 6A).
Figure EV5. Deficiency of BHLHE40 does not affect body weight and nonfasting blood glucose in normal mice.
-
ASchematic representation of conditional deletion of Bhlhe40.
-
BConfirmation of BHLHE40 knockout in islets from Bhlhe40 fl/fl (Ctrl) and Pdx1‐Cre:Bhlhe40 fl/fl (βB40KO) mice (n = 3 mice) by qRT–PCR.
-
C, DBody weight (C) and nonfasting blood glucose (D) in Ctrl and βB40KO mice (n = 7 and n = 9 mice, respectively).
-
EInsulin tolerance test of Ctrl:ob/ob and βB40KO:ob/ob mice (n = 9 and n = 8 mice, respectively; 7 weeks old).
-
FNonfasting blood glucose of Ctrl:ob/ob and βB40KO:ob/ob mice (n = 9 and n = 6 mice, respectively).
-
GInsulin content in Ctrl and B40 KO isolated islets (n = 4 biological replicates).
Data information: Data are mean ± SEM; *P < 0.05 by unpaired two‐tailed Student's t‐test. Ctrl—control. n.s.—not significant.
Source data are available online for this figure.
Figure 6. Deficiency of BHLHE40 improves hyperglycaemia in ob/ob mice.
-
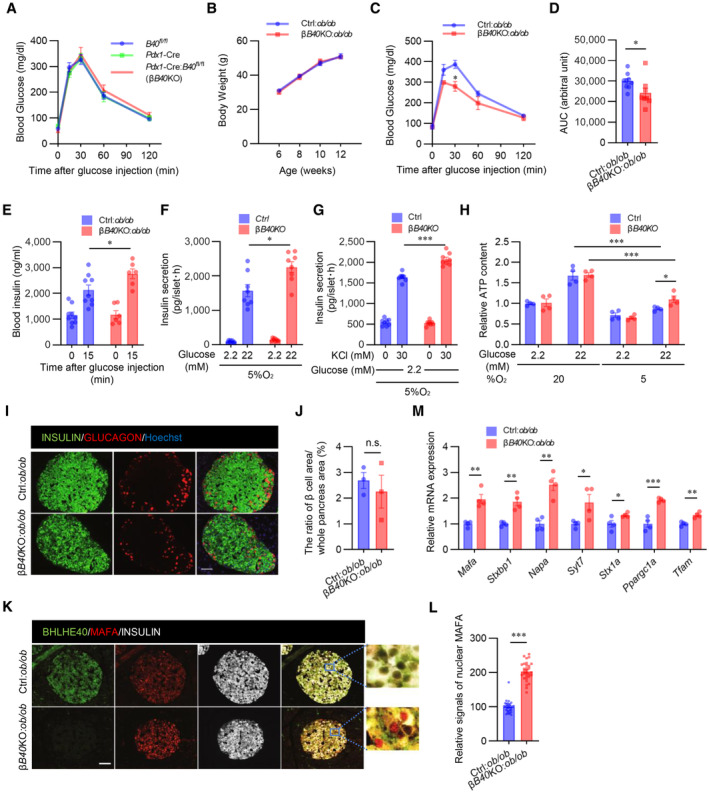
AGlucose tolerance test of Pdx1‐Cre (Cre), Bhlhe40 fl/fl (B40 fl/fl ), and Pdx1‐Cre:Bhlhe40 fl/fl (Cre:B40 fl/fl ) mice (n = 7 mice, n = 12 mice, and n = 9 mice, respectively; 8–12 weeks old).
-
BBody weight of Bhlhe40 fl/fl (Ctrl):ob/ob and Pdx1‐Cre:Bhlhe40 fl/fl (βB40KO):ob/ob mice (n = 9 mice and n = 6 mice, respectively).
-
C, DGlucose tolerance test of Ctrl:ob/ob and βB40KO:ob/ob mice (n = 9 mice and n = 8 mice, respectively; 6 weeks old) (C) and AUC (D).
-
EGlucose‐stimulated insulin secretion in Ctrl:ob/ob and βB40KO:ob/ob mice (n = 9 mice and n = 6 mice, respectively; 8 weeks old).
-
FGlucose‐stimulated insulin secretion in isolated islets from Ctrl and βB40KO mice after culture under 5% O2 for 24 h (n = 8 biological replicates).
-
GKCl‐stimulated insulin secretion in isolated islets from Ctrl and βB40KO mice after incubation with 5% O2 for 24 h (n = 8 biological replicates).
-
HATP content in isolated islets of Ctrl and βB40KO mice after incubation with 20% or 5% O2 for 24 h (n = 4 biological replicates).
-
I, JRepresentative images of pancreatic islets stained for insulin and glucagon in Ctrl:ob/ob and βB40KO:ob/ob mice (12 weeks old) (I). The ratios of total islet area to whole pancreas area (%) are shown (n = 3 biological replicates; J).
-
K, LRepresentative images of pancreatic islets stained for insulin, MAFA, and BHLHE40 in Ctrl:ob/ob and βB40KO:ob/ob mice (12 weeks old) (K). Fluorescence intensities of nuclear and cytosolic MAFA in K were quantified (n = 30 cells; L).
-
MqRT–PCR of Mafa and its target genes in Ctrl:ob/ob and βB40KO:ob/ob mice (n = 4 mice).
Data information: Data are mean ± SEM; *P < 0.05 **P < 0.01, and ***P < 0.001 by unpaired two‐tailed Student's t‐test. Scale bar, 10 μm. Ctrl—control; n.s.—not significant.
Source data are available online for this figure.
BHLHE40 negatively regulates insulin secretion, and BHLHE40 expression was markedly upregulated in ob/ob pancreatic islets (Fig 2I). We then investigated the effects of β‐cell–specific BHLHE40 deficiency in ob/ob mice (βB40KO:ob/ob mice). In these mice, BHLHE40 deficiency in β‐cells had no effect on obesity (Fig 6B), insulin sensitivity (Fig EV5E), or nonfasting glucose concentrations (Fig EV5F). However, the mice displayed better glucose tolerance than control Bhlhe40 fl/fl :ob/ob (control:ob/ob) mice (Fig 6C and D). In agreement with the results obtained in MIN6 cells, glucose‐stimulated insulin secretion was significantly increased in βB40KO:ob/ob mice (Fig 6E). The insulin content of control and βB40KO islets was similar (Fig EV5G). However, insulin secretion by high glucose (Fig 6F) and KCl (Fig 6G) was also increased in βB40KO islets under hypoxic conditions. We measured the ATP content with 2.2 and 22 mM glucose under hypoxic conditions and found that ATP levels were significantly increased in βB40KO islets compared with control islets (Fig 6H). There was no significant difference in the ratio of β‐cell area to whole pancreas area between βB40KO:ob/ob and control:ob/ob mice (Fig 6I and J), but stronger nuclear immunostaining of MAFA was detected in βB40KO:ob/ob mice (Fig 6K and L). Lastly, the increased expression of Mafa, Stxbp1, Napa, Syt7, Stx1a, Ppargc1a, and Tfam in βB40KO:ob/ob islets was confirmed by qRT–PCR (Fig 6M). Taken together, the results show that BHLHE40 deficiency improves glucose tolerance in ob/ob mice by enhancing insulin secretion.
Discussion
Adaptation to hypoxia involves three major responses: increased glycolysis to cope with ATP depletion, increased oxygen delivery, and inhibition of energy‐demanding processes such as gene transcription (Cavadas et al, 2017). HIF transcriptional factors are known to play central roles in glycolytic ATP production and oxygen delivery, but the mechanisms underlying transcriptional repression in hypoxia are poorly understood. By screening hypoxia‐induced genes in mouse and human islets and MIN6 cells, we showed that the transcriptional repressor BHLHE40 is highly induced in hypoxic β‐cells. We also demonstrated that BHLHE40 negatively regulates insulin secretion by suppressing the transcription of Mafa (Fig 7).
Figure 7. A proposed model for how hypoxia causes β‐cell dysfunction.
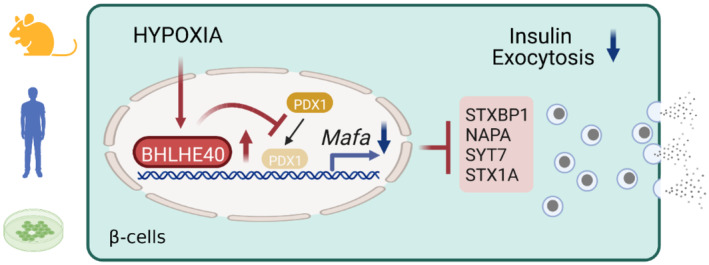
In addition, we found that BHLHE40 suppresses the transcription of Ppargc1a and decreases ATP levels in β‐cells. PGC‐1α plays important roles in mitochondrial biogenesis and ATP production (Lin et al, 2005; Ling et al, 2008). Thus, it is plausible that the decreased expression of PGC‐1α may be involved in the reduced ATP levels and impaired insulin secretion under hypoxic conditions. However, the impact of ATP generation due to BHLHE40 deficiency was relatively mild, and the glucose‐ and KCl‐related insulin secretory profiles were similar both in vitro and ex vivo in the presence of genetic manipulations of Bhlhe40, suggesting a more prominent role of BHLHE40 in regulating exocytotic events. Further studies are necessary to evaluate the contribution of Mafa and Ppargc1a to a hypoxia‐induced defect in insulin secretion.
BHLHE40 was previously reported to suppress the transcription of target genes by recruiting HDACs (Sun & Taneja, 2000; Chung et al, 2015). By contrast, we found that TSA treatment did not relieve the BHLHE40‐mediated repression of Mafa, indicating that Mafa repression by BHLHE40 is independent of the recruitment of HDAC. On the other hand, we demonstrated that BHLHE40 inhibits the binding of PDX1 to the critical enhancer region of Mafa. Repressors are reported to regulate transcription by interacting with activator proteins (Gaston & Jayaraman, 2003). BHLHE40 might suppress Mafa transcription by interacting with PDX1. Alternatively, BHLHE40 might change DNA conformations by recruiting chromatin‐remodeling factors. The family of large Maf proteins comprises MAFA, MAFB, and MAF (c‐Maf). Intriguingly, recent studies demonstrated that BHLHE40 represses the expression of Mafb and Maf mRNAs in macrophages (Jarjour et al, 2019). Thus, BHLHE40 seems to be a common repressor of the large Maf family. Further studies are necessary to clarify the mechanism by which BHLHE40 suppresses these genes.
In the present study, we showed that approximately 5% of genes were downregulated in hypoxic islets. In addition to BHLHE40, we also found an increased expression of ATF3 in β‐cells in hypoxia. Previously, ATF3 was reported to regulate the expression of genes related to glucose metabolism, inflammation, and apoptosis (Li et al, 2008; Zmuda et al, 2010a, 2010b; Ku & Cheng, 2020). Consistent with the findings (Li et al, 2008; Zmuda et al, 2010b), the suppression of the genes Ins1, Ins2, and Irs2 by hypoxia was significantly reversed in Atf3 KD MIN6 cells (Appendix Fig S1A and B). In addition, hypoxia‐induced upregulation of the proinflammatory Il1b and proapoptotic Noxa genes and activation of caspase‐3 were significantly suppressed by KD of Atf3 in MIN6 cells (Appendix Fig S1C and D). Also, hypoxia‐induced apoptosis was significantly decreased in Atf3 KD MIN6 cells (Appendix Fig S1E). Thus, hypoxia might affect β‐cell function and death through not only BHLHE40 but also other transcriptional factors, such as ATF3.
In diabetes, the β‐cells are in a vicious cycle in which an impaired insulin response to glucose produces hyperglycemia, which stresses β‐cell function and makes β‐cells more inefficient, and reversal of hyperglycemia results in at least partial recovery of β‐cell function (Turner et al, 1976; Prentki & Nolan, 2006). We showed that the suppression of BHLHE40 improves glucose tolerance in ob/ob mice by increasing insulin secretion. Thus, inhibition of BHLHE40 might be beneficial for preventing progressive β‐cell dysfunction in type 2 diabetes. Further studies are necessary to deepen our understanding of BHLHE40 as a therapeutic target in type 2 diabetes.
Material and Methods
Mouse models
C57B6 wild‐type (WT), ob/ob, and db/db mice were purchased from KBT Oriental Co., Ltd. (Saga, Japan). Mice carrying the Bhlhe40 tm1a(KOMP)Wtsi allele (C57BL/6NTac‐Bhlhe40tm1a(KOMP)Wtsi/WtsiPh, EM:09819) were obtained from the European Conditional Mouse Mutagenesis Program (EUCOMM) and crossed with FLPe mice (B6‐Tg(CAG‐FLPe)36, RBRC01834, RIKEN BRC, Ibaraki, Japan) to remove a LacZ reporter and a Neo cassette flanked by two Frt sites. To achieve a Bhlhe40 deletion in β‐cells, Bhlhe40 fl/fl mice were further crossed with Pdx1‐Cre mice (gift from Dr. Douglas A. Melton). β‐cell–specific Bhlhe40 knockout mice on ob/ob background were generated by crossing with Bhlhe40 fl/fl :ob/+ mice and Pdx1‐Cre:Bhlhe40 fl/fl :ob/+ mice. Mice were housed under a 12‐h light/dark cycle with free access to water and normal chow (CE‐2; CLEA, Tokyo, Japan). Room temperature was maintained at 22 ± 1–2°C.
Human pancreatic islets
Human islets were commercially purchased from Prodo Laboratories (Irvine, CA). The cadaveric donors had no history of diabetes (donor 1: 32‐year‐old male; BMI, 25.1; HbA1c, 5.1%; donor 2: 54‐year‐old male; BMI, 21.6; HbA1c, 5.2%). Islets were cultured according to the Prodo Laboratories' instructions. Islets from donor 1 were used for RNA‐seq and qRT–PCR, and islets from donor 2 were used for qRT–PCR.
Cell lines
MIN6 cells were gifts from Jun‐ichi Miyazaki (Osaka University). They were maintained in Dulbecco's modified Eagle's medium (DMEM) supplemented with 10% (v/v) fetal bovine serum (FBS), 0.1% (v/v) penicillin/streptomycin (P/S), and 50 μM β‐mercaptoethanol at 37°C in 5% CO2, 95% air. For the hypoxic cell culture, a multi‐gas incubator (APM‐300; ASTEC, Fukuoka, Japan) was used. Retroviral packaging cell line Platinum‐E (Plat‐E; RV‐101) cells were purchased from Cell Biolabs, Inc. (San Diego, CA). They were maintained in DMEM supplemented with 10% (v/v) FBS and 0.1% (v/v) P/S at 37°C in 5% CO2, and 95% air. 293AAV cells were purchased from Cell Biolabs Inc. (AAV‐100). They were maintained in DMEM with sodium pyruvate supplemented with 10% (v/v) FBS, 1× Glutamax, 1× Opti‐MEM, and 0.1% (v/v) P/S at 37°C in 5% CO2, 95% air.
Plasmids
The HA‐tagged mouse Bhlhe40 coding sequence was excised from a pCAGGS‐DEC1 plasmid (RDB08473, Riken, Saitama, Japan; Nishiyama et al, 2012) and subcloned into pcDNA3.1 and pMXs‐Puro Retroviral vector (RTV‐012, Cell Biolabs, Inc.). For knockdown experiments, oligonucleotide encoding Bhlhe40 short‐hairpin RNA (shRNA; target sequence: 5′‐GCACGTGAAAGCATTGACA‐3′; Shen et al, 2014), Atf3 shRNA (target sequence: 5′‐GCAGAAAGAGTCAGAGAAACT‐3′), and Hif1β shRNA (target sequence: 5′‐GGACAGAGATCCAAGGTTT‐3′) were cloned into the pSIREN‐RetroQ expression vector (631526; Clontech Laboratories Inc., Mountain View, CA). The FLAG‐tagged mouse Pdx1 coding sequence was amplified by PCR and subcloned into a pMXs‐Neo Retroviral vector (RTV‐011, Cell Biolabs, Inc.). pGL3‐basic‐Mafa plasmid (−10427/+22 from transcription start site) was previously reported (Yamamoto et al, 2013). The pGL3‐basic‐Mafa plasmids with single deletion of the E‐box site at −9,910/−9,899 (A; GAAAAATGCTG), −8,706/−8,695 (B; TGAAAATGATT), or −6,987/−6,976 (C; GGAAAATGCCT) were generated with a KOD‐Plus Mutagenesis Kit (SMK‐101, TOYOBO, Osaka, Japan). The truncated pGL3‐basic‐Mafa plasmid (−5,811/+22) was generated by BglII digestion and re‐ligation. The mouse Mafa coding sequence was amplified by PCR and subcloned into pAAV‐MCS (VPK‐410, Cell Biolabs. Inc.).
MIN6 cells stably overexpressing/silencing a target gene
To generate stable overexpression cell lines, retroviral vectors (pMx‐Puro‐HA‐Bhlhe40, pMx‐Puro Control, pMx‐Neo FLAG‐Pdx1 or pMx‐Neo Control plasmid) were transfected into Plat‐E cells with JetPRIME transfection reagent (114‐15, Polyplus, New York, NY), and MIN6 cells were infected with the respective retroviruses and selected by incubation with puromycin (5 μg/ml) for 2 days or G418 (500 μg/ml) for 4 weeks. For stable knockdown of Bhlhe40, pSIREN‐RetroQ‐Bhlhe40 or pSIREN‐RetroQ‐control vector was transfected into Plat‐E cells, and MIN6 cells were infected with the retroviruses and selected by incubation with puromycin (5 μg/ml) for 2 days.
AAV‐Mafa preparation
293AAV cells were plated onto 10‐cm dishes. At 80% confluency, cells were transfected with 2 μg/dish pAAV‐DJ, 3 μg/dish pHelper, and either 2 μg/dish pAAV‐green fluorescent protein (GFP) or pAAV‐Mafa with JetPRIME transfection reagent. Three days after transfection, AAV‐GFP and AAV‐Mafa were purified with the AAV pro Extraction Solution Kit (6235, Takara, Shiga, Japan), and the titers were determined with a Quick Titer AAV Quantification Kit (VPK‐145, Cell Biolabs, Inc.) according to the manufacturer's instructions.
Isolation of mouse islets
Mice were euthanized by cervical dislocation and subjected to bile duct cannulation and digestion of the pancreas with a mixture of collagenase P (11‐249‐002‐001, Roche, Basel, Switzerland), hyaluronidase (H3506; Sigma‐Aldrich, St. Louis, MO, USA), and protease inhibitor cocktail (Nacalai Tesque, Kyoto, Japan) for 25–30 min in a warm (37°C) water bath. Isolated islets were collected manually. Islets were maintained in RPMI‐1640 supplemented with 10% (v/v) FBS, 0.1% (v/v) P/S, 50 μM β‐mercaptoethanol, 10 mM HEPES, and 1 mM sodium pyruvate at 37°C in 5% CO2, 95% air.
qRT–PCR
MIN6 cells were homogenized in Sepasol‐RNA I reagent (09379‐55, Nacalai Tesque), and RNA was manually isolated by phenol‐chloroform extraction and ethanol precipitation. RNA from isolated islets was prepared with the RNeasy Micro Kit (74004, QIAGEN, Hilden, Germany) according to the manufacturer's instructions. cDNA was synthesized with a Prime Script RT Reagent Kit (RR047A, Takara Bio Inc., Shiga, Japan). qRT–PCR was performed with SYBR Premix Ex TaqII (RR820A, Takara Bio Inc.) in an ABI 7300 thermal cycler (Applied Biosystems, Foster City, CA) or a ViiA 7 Real‐Time PCR System (Thermo Fisher Scientific, Waltham, MA). All data were normalized to Actb or Tbp. The primers for this study are listed in Appendix Table S1.
RNA‐seq analysis
RNA was extracted with the RNeasy Micro Kit (74004, QIAGEN) according to the manufacturer's instructions. For Fig 1 samples, sequencing libraries were prepared with a NEBNext Ultra II Directional RNA Library Prep Kit (7765L, New England Biolabs, Ipswich, MA), and samples were sequenced on an Illumina NextSeq 500 platform in 76 bp single‐end reads. For Fig 4 samples, sequencing libraries were prepared with a NEBNext Ultra II RNA Library Prep Kit (E7770, New England Biolabs) and samples were sequenced on an Illumina NovaSeq 6000 platform in 150 bp paired‐end reads. For reanalysis of RNA‐seq data of db/db mice islets (accession number: GSE 107489; John et al, 2018), raw RNA‐seq data were downloaded from NCBI Sequence Read Archive and converted to the fastq format with SRA‐Tools (v2.10.9). Reads were trimmed for universal Illumina adaptors with TrimGalore (v0.6.5) (https://www.bioinformatics.babraham.ac.uk/projects/trim_galore/) and then mapped to GENCODE 36 genome sequence (for human) or M25 genome sequence (for mouse) with HISAT2 (v2.2.1; Kim et al, 2019). Mapped reads were sorted and converted to a binary alignment/map format with SAMtools (v1.11; Li et al, 2009). Gene assembly and quantification were performed with Stringtie (v2.1.4; Pertea et al, 2015), and gene‐level count matrixes were generated with Python script prepDE.py3 (http://ccb.jhu.edu/software/stringtie/dl/prepDE.py3). Differentially expressed genes (DEGs) were determined with DESeq2 (v1.28.0; Love et al, 2014). DEGs (adjusted P‐value < 0.01) were used for gene ontology analysis with David (v6.8; Huang et al, 2009a,b).
Screening for hypoxia‐induced genes associated with transcriptional repression
Hypoxia‐induced genes were defined as genes with an adjusted P‐value of less than 0.05 and a fold change (hypoxia/normoxia) greater than 2 in DESeq2 outputs. To identify hypoxia‐induced genes that are commonly listed in mouse and human islets and MIN6 cells and are related to transcriptional repression, DESeq2 outputs in each group were processed as follows: For human islets, human‐to‐mouse Ensembl gene identifiers (IDs) conversion was carried out with Ensembl BioMart; and for MIN6 cells and mouse islets, only genes with mouse Ensembl gene IDs that can be mapped to those in human were selected. After this gene IDs conversion and gene filtering, overlapped genes were determined. Genes associated with transcriptional repression were manually selected out of the overlapped genes based on gene ontology annotations against each gene (obtained from Ensembl BioMart).
GSEA
Gene set enrichment analysis was performed with GSEA (v4.03; Subramanian et al, 2005) for “preranked” analyses, with the fold change between normoxia samples and hypoxia samples as the input. Mouse Ensembl IDs were converted to be compatible with the human annotations of the MSigDB gene lists by using a Mouse ENSEMBL Gene ID to Human Orthologs MSigDB.v7.4.chip.
Western blotting
Cells were lysed in RIPA buffer (50 mM Tris–HCl [pH 8.0], 150 mM NaCl, 0.1% sodium dodecyl sulfate [SDS], 1% NP‐40, 5 mM EDTA, and 0.5% sodium deoxycholate) with a protease inhibitor cocktail. Total proteins were separated by SDS–polyacrylamide gel electrophoresis, transferred to polyvinylidene difluoride membranes (Immuno‐P; Millipore, Bedford, MA), and then probed with the primary antibody. After incubation with the horseradish peroxidase (HRP)‐conjugated secondary antibodies, the HRP signals were visualized by using Chemi‐Lumi One Super (02230‐30, Nacalai Tesque) and a ChemiDocTM Imaging System (Bio‐Rad Laboratories, Hercules, CA) or a LAS‐1000 imaging system (FUJIFILM Corporation, Tokyo, Japan). The primary antibodies used in this study were anti‐β‐actin antibody (M177‐3, MBL), anti‐BHLHB2 antibody (H00008553‐M01, Abnova), anti‐cleaved caspase‐3 (9661, Cell Signaling Technology, Danvers, MA), anti‐DYKDDDDK (FLAG) tag antibody (clone 1E6, 018‐22381, Wako Pure Chemical Industries, Ltd., Osaka, Japan), anti‐MafA antibody (A300‐611A, Bethyl Laboratories, Montgomery, TX), anti‐glyceraldehyde‐3‐phosphate dehydrogenase (GAPDH) antibody (2118, Cell Signaling Technology), anti‐HIF1α antibody (NB100‐479, Novus Biologicals, Centennial, CO), anti‐HIF1β antibody (5537, Cell Signaling Technology), anti‐TOM20 (11802‐1‐AP, Proteintech Group Inc., Rosemont, IL), and total OXPHOS rodent WB antibody cocktail (ab110413, Abcam, Cambridge, UK). Band intensities were quantified with Image Lab Software version 6.0 (Bio‐Rad Laboratories).
Insulin secretion assay and insulin content in MIN6 cells
MIN6 cells were seeded in a 24‐well plate. In Figs 3A and C, 4E and F, EV3E, and EV4F, cells were incubated in 20 or 5% O2 for 24 h before assay. Cells were preconditioned in low‐glucose (2.2 mM) Krebs‐Ringer‐bicarbonate HEPES (KRBH) buffer (120 mM NaCl, 4.7 mM KCl, 1.2 mM KH2PO4, 2.4 mM CaCl2, 1.2 mM MgCl2, 20 mM NaHCO3, 10 mM HEPES, and 0.5% [v/v] BSA) for 1 h. Cells were washed once with low‐glucose KRBH and incubated in low‐glucose KRBH for 1 h, and the supernatant was collected. Then, cells were stimulated in high‐glucose (22 mM) KRBH or low‐glucose + KCl (30 mM) KRBH for 1 h, and the supernatant was collected. Next, cells were lysed in cell lysis buffer, and the protein concentration was measured with a Pierce BCA Protein Assay Kit (23225, Thermo Fisher Scientific, Waltham, MA) to normalize the insulin level. To measure insulin content, MIN6 cells were pelleted and resuspended in acid‐ethanol (1.5% HCl in 70% EtOH), rotated overnight at 4°C and neutralized with 1 M Tris–HCl (pH 7.5; 1:1). The insulin concentration was determined with a mouse insulin enzyme‐linked immunosorbent assay (ELISA; TMB) kit (AKRIN‐011T; Shibayagi Co., Ltd., Gunma, Japan). A hypoxia chamber glove box (Creative Bio Station: CBS‐120; ASTEC) was used to achieve continuous hypoxic conditions during the assay.
Insulin secretion assay and insulin content in mouse islets
The islets isolated from Ctrl and βB40KO mice were cultured in 5% O2 for 24 h. Then, they were preincubated for 30 min in KRBH buffer containing 2.2 mM glucose. For glucose challenge, they were incubated in KRBH buffer containing 2.2 or 22 mM glucose for 30 min, and the supernatant was collected; and for KCl challenge, they were incubated in KRBH buffer containing 2.2 or 2.2 mM glucose plus 30 mM KCl for 30 min, and the supernatant was collected. To measure insulin content, isolated islets cells were pelleted and resuspended in acid‐ethanol (1.5% HCl in 70% EtOH), rotated overnight at 4°C, and neutralized with 1 M Tris–HCl (pH 7.5; 1:1). The insulin concentration was determined with a mouse insulin ELISA (TMB) kit (AKRIN‐011T and AKRIN‐011S; Shibayagi Co., Ltd.). A hypoxia chamber glove box (Creative Bio Station: CBS‐120; ASTEC) was used to achieve continuous hypoxic conditions during the assay.
Cell proliferation assay
Before the assay, Ctrl or Bhlhe40 KD MIN6 cells were seeded in a 96‐well plate at 2 × 10⁴ cells/well, incubated overnight, and transferred to 20 or 5% O2. Cells were counted at 0, 24, 48, and 96 h with a Cell Counting Kit‐8 (343‐07623, Dojindo, Kumamoto, Japan), and the absorbance (450/655) was measured by an iMark microplate reader (Bio‐Rad Laboratories).
Cell death assay
Before the assay, Ctrl or Bhlhe40 KD MIN6 cells were transferred to and cultured in 20 or 5% O2 for 24 h. The cells were incubated in PI and Annexin V solution according to the instructions in the Annexin V‐Fluorescein Isothiocyanate (FITC) Apoptosis Detection Kit (K101‐100; BioVision, Milpitas, CA). Then, flow cytometric analyses were performed with a FACSCalibur (BD Biosciences, Franklin Lakes, NJ) and FlowJo software (Tomy Digital Biology, Tokyo, Japan).
Calcium assay
Ctrl or Bhlhe40 OE MIN6 cells were plated on glass‐bottomed culture dishes (627871, Greiner Bio‐One, Frickenhausen, Germany). The cells were preincubated with KRBH buffer for 45 min and then incubated with KRBH buffer containing 2.2 mM glucose, 2 μM Fluo4‐AM (F311, Dojindo), 0.02% Pluronic F‐127 (P2443, Sigma‐Aldrich), 2.5 mM probenecid (162‐26112, Wako Pure Chemical Industries, Ltd.), and Hochest 33258 (343‐07961, Dojindo) for 30 min, after which the buffer was replaced with dye‐free KRBH buffer. For KCl challenge, buffer was changed by hand aspirating it and an equal amount of KRBH buffer containing 2.2 mM glucose and 30 mM KCl was gently added to the dish using a micropipette. For glucose challenge, buffer was changed by hand aspirating it and adding an equal amount of KRBH buffer containing 22 mM glucose. Time‐series images were acquired every 10 s with a fluorescent microscope (BZ‐X700; Keyence, Osaka, Japan) and analyzed with Keyence software.
hGH secretion assay
Ctrl or Bhlhe40 KD MIN6 were transfected with either pcDNA3‐empty or pcDNA3‐hGH. At 24 h after transfection, cells were transferred to and cultured in 20 or 5% O2 for a further 24 h. Cells were preincubated in glucose‐free KRBH for 15 min and then incubated in KRBH with or without KCl (30 mM) for 30 min, and the supernatant was collected. Cells were then lysed in cell lysis buffer, and the protein concentration was measured with a Pierce BCA Protein Assay Kit (23225, Thermo Fisher Scientific) to normalize the hGH level. The hGH concentration was measured with Human Growth Hormone ELISA kit (ab190811, Abcam, Cambridge, UK).
Glucose uptake assay
Before the assay, Ctrl or Bhlhe40 KD MIN6 cells were transferred to and incubated in 20 or 5% O2 for 24 h. Cells were preincubated in KRBH for 15 min and then incubated in KRBH containing 200 μM 2‐NBDG (23002‐v, Peptide Institute, Inc., Osaka, Japan) plus 22 mM glucose for 15 min, after which flow cytometric analyses were performed with FACSCalibur (BD Biosciences) and FlowJo software (Tomy Digital Biology).
Evaluation of mtDNA content
MIN6 were digested with 300 μg/ml proteinase K (Nacalai Tesque) in DNA lysis buffer (100 mM Tris–HCl pH 8.5, 5 mM EDTA, 0.2% SDS, 200 mM NaCl) at 55°C overnight with shaking, and DNA was then extracted with protein precipitation solution (Promega Corporation, Madison, WI) and phenol/chloroform. mtDNA content was evaluated by determining the ratio of mtDNA to nuclear DNA (nDNA). mtDNA was amplified by using primers specific for the mitochondrially encoded NADH dehydrogenase 1 (mt‐Nd1) gene and normalized to nDNA by amplifying platelet/endothelial cell adhesion molecule 1 (Pecam1). The primer sequences are listed in Appendix Table S1.
Mitochondrial mass assay
Before the assay, Ctrl or Bhlhe40 KD MIN6 cells were transferred to and incubated in 20 or 5% O2 for 24 h. Then, cells were incubated in 2 nM nonyl acridine orange (A‐1372, Invitrogen, Carlsbad, CA) for 15 min, after which flow cytometric analyses were performed with FACSCalibur (BD Biosciences) and FlowJo software (Tomy Digital Biology).
Mitochondrial membrane potential assay
Before the assay, Ctrl or Bhlhe40 KD MIN6 cells were transferred to and incubated in 20 or 5% O2 for 24 h. Then, cells were incubated in 25 nM MitoTracker Red (PA‐3017, Lonza, Walkersville, MD) for 20 min, after which flow cytometric analyses were performed with FACSCalibur (BD Biosciences) and FlowJo software (Tomy Digital Biology).
Luciferase assay
MIN6 cells were transiently transfected with firefly luciferase plasmid (either pGL3‐basic‐MafA or its derivatives) and renilla luciferase plasmid (pRL‐SV40) with jetPRIME transfection reagent (114‐15, Polyplus). For Bhlhe40 overexpression experiments, Bhlhe40 expression plasmids (either pcDNA3.1‐empty or pcDNA3.1‐Bhlhe40) were additionally transfected. Forty‐eight hours after transfection, cells were lysed and assayed with firefly luciferase and renilla luciferase substrates in the Dual‐Luciferase Reporter Assay System (E1980, Promega). Firefly luciferase activity (RLU1) was normalized to renilla luciferase activity (RLU2). For hypoxia experiments, cells were transferred to 20 or 5% O2 for 24 h before the luciferase activities were measured.
ChIP assay
MIN6 cells were fixed in 1% formaldehyde for 10 min at room temperature, and then the reaction was quenched by 150 mM glycine for 5 min. The fixed cells were incubated in 0.5% Nonidet P‐40 lysis buffer for 15 min on ice, and the nuclei were pelleted and incubated in SDS lysis buffer (50 mM Tris–HCl [pH 8.0], 1% SDS, 10 mM EDTA). Chromatin was then sheared with a Bioruptor sonicator (C30010016, Diagenode, Seraing, Belgium) by 10 cycles of sonication at 30 s on and 30 s off. The sheared chromatin was diluted 5‐fold in ChIP dilution buffer (50 mM Tris–HCl [pH 8.0], 167 mM NaCl, 1.1% Triton X‐100, and 0.11% sodium deoxycholate) and then incubated in Dynabeads protein A (1001D, Invitrogen) and protein G (1003D, Invitrogen) for 1 h at 4°C. After removing the beads, the chromatin was incubated in 4 μg of anti‐Bhlhe40 antibody (NB100‐1800, Novus Biologicals), anti‐DYKDDDDK (FLAG) tag antibody (clone 1E6, 018‐22381, Wako Pure Chemical Industries, Ltd.), or control IgG (2729, Cell Signaling Technology) overnight at 4°C. The antibody‐protein complexes were isolated by incubation with magnetic beads (Invitrogen Dynabeads protein A and protein G) for 6 h at 4°C. Then, samples were sequentially washed with low‐salt RIPA buffer (50 mM Tris–HCl [pH 8.0], 150 mM NaCl, 1 mM EDTA, 0.1% SDS, 1% Triton X‐100, and 0.1% sodium deoxycholate), high‐salt RIPA buffer (50 mM Tris–HCl [pH 8.0], 500 mM NaCl, 1 mM EDTA, 0.1% SDS, 1% Triton X‐100, and 0.1% sodium deoxycholate), LiCl wash buffer (10 mM Tris–HCL [pH 8.0], 250 mM LiCl, 1 mM EDTA, 0.5% Nonidet P‐40, and 0.5% sodium deoxycholate), and Tris–EDTA buffer and finally eluted and reversely cross‐linked in ChIP direct elution buffer (50 mM Tris–HCl [pH 8.0], 5 mM EDTA, and 0.5% SDS) overnight at 65°C. DNA was then extracted and collected by phenol‐chloroform extraction and ethanol precipitation. DNA was amplified by qRT–PCR with SYBR Premix Ex Taq II (RR820A, Takara) in ABI 7300 thermal cycler (Applied Biosystems) or ViiA 7 Real‐Time PCR System (Thermo Fisher Scientific) with the primers listed in Appendix Table S1.
Metabolic analysis of mice
Male 6‐ to 12‐week‐old mice were used for metabolic analysis. For the glucose tolerance test, mice were fasted overnight. After intraperitoneal glucose administration (2 g/kg for wild‐type background, 1 g/kg for ob/ob background), blood glucose levels were measured at 0, 15, 30, 60, 90, and 120 min. For the insulin tolerance test, mice were fasted for 4 h. After intraperitoneal insulin administration (1 unit/kg for wild‐type background, 3 units/kg for ob/ob background), blood glucose levels were measured at 0, 30, 60, 90, and 120 min. For the glucose‐stimulated insulin secretion assay, mice were fasted overnight. After intraperitoneal administration of 3 g/kg glucose, blood samples were collected at 0 and 15 min. The plasma insulin level was determined with a mouse insulin ELISA (TMB) kit (AKRIN‐011S; Shibayagi Co., Ltd.).
Immunohistochemistry and β‐cell mass assessment
Pancreas tissues from mice were fixed with 10% (v/v) neutral buffered formalin (060–01667, Wako Pure Chemical Industries, Ltd.) for 16–18 h at 4°C. Fixed samples were embedded in paraffin, cut into 4‐μm cross‐sections, and mounted on MAS‐coated slides (Matsunami Glass, Osaka, Japan). The deparaffinized sections were subjected to antigen retrieval (110°C, 20 min) with HistoVT One (L6F9587, Nacalai Tesque) and stained with the following primary antibodies: anti‐insulin antibody (A0564, 1:400; Dako, Santa Clara, CA), anti‐glucagon antibody (ab92517, 1:400; Abcam), anti‐DEC1/BHLHE40 antibody (NB100‐1800, 1:100; Novus Biologicals), and anti‐MafA antibody (A300‐611A, 1:100; Bethyl Laboratories). After reaction with fluorescent dye‐conjugated secondary antibodies, fluorescent signals were captured with an all‐in‐one fluorescent microscope (BZ‐X700; Keyence). The total islet area (μm2) composed of insulin‐ and glucagon‐stained cells was measured by Keyence software, and the ratio of the total islet area to the total pancreas area was calculated.
Statistical analyses
The significance of differences was assessed by unpaired two‐sided Student's t‐tests, unless stated otherwise. All data are presented as means ± SEM. No statistical analysis was used to predetermine the sample size.
Study approval
The handling and killing of mice were performed in compliance with the animal care guidelines of Kumamoto University. All animal experiments were conducted in accordance with the guidelines of the Institutional Animal Committee of Kumamoto University and were approved by the Kumamoto University Ethics Review Committee for Animal Experimentation (ID: A29‐001, A 2019‐048, A 2021‐001). Human islet experiments were approved by the Ethical Committee of Kumamoto University Graduate School of Medical Sciences (No. 2389).
Author contributions
Tomonori Tsuyama: Conceptualization; data curation; formal analysis; funding acquisition; investigation; methodology; writing – original draft; writing – review and editing. Yoshifumi Sato: Conceptualization; data curation; formal analysis; supervision; funding acquisition; validation; investigation; methodology; writing – original draft; writing – review and editing. Tatsuya Yoshizawa: Conceptualization; supervision; writing – review and editing. Takaaki Matsuoka: Conceptualization; resources; writing – review and editing. Kazuya Yamagata: Conceptualization; supervision; funding acquisition; writing – original draft; project administration; writing – review and editing.
Disclosure and competing interests statement
The authors declared that they have no conflict of interest.
Supporting information
Appendix S1
Expanded View Figures PDF
PDF+
Source Data for Expanded View and Appendix
Source Data for Figure 2
Source Data for Figure 3
Source Data for Figure 4
Source Data for Figure 5
Source Data for Figure 6
Acknowledgements
We thank Dr. Douglas A. Melton (Harvard University) for providing Pdx1‐Cre mice and Dr. Shingo Usuki (Kumamoto University) for his technical support. We also thank the members of Dr. Yamagata's laboratory for their technical assistance and discussions. This study was supported by Grants‐in‐Aid for Scientific Research (B) from Japan Society for the Promotion of Science (JSPS) (19H03711 and 22H03129; KY), by a Grant‐in‐Aid for Challenging Research (Exploratory) from JSPS (19K22639; KY), and by a Grant‐in‐Aid for Scientific Research (C) from JSPS (19K09008; YS); by grants from the Takeda Science Foundation (KY and YS); and by grants from the program for Leading Graduate Schools HIGO (TT) and Center for Metabolic Regulation of Healthy Aging (TT) in Kumamoto university.
EMBO reports (2023) 24: e56227
Contributor Information
Yoshifumi Sato, Email: ysato413@kumamoto-u.ac.jp.
Kazuya Yamagata, Email: k-yamaga@kumamoto-u.ac.jp.
Data availability
The RNA‐seq datasets generated in this study are available in the Gene Expression Omnibus repository and have the accession number GSE202603 (https://www.ncbi.nlm.nih.gov/geo/query/acc.cgi?acc=GSE202603).
References
- Bensellam M, Duvillié B, Rybachuk G, Laybutt DR, Magnan C, Guiot Y, Pouysségur J, Jonas JC (2012) Glucose‐induced O₂ consumption activates hypoxia inducible factors 1 and 2 in rat insulin‐secreting pancreatic beta‐cells. PLoS One 7: e29807 [DOI] [PMC free article] [PubMed] [Google Scholar]
- Bensellam M, Jonas JC, Laybutt DR (2018) Mechanisms of β‐cell dedifferentiation in diabetes: recent findings and future research directions. J Endocrinol 236: R109–R143 [DOI] [PubMed] [Google Scholar]
- Cantley J, Selman C, Shukla D, Abramov AY, Forstreuter F, Esteban MA, Claret M, Lingard SJ, Clements M, Harten SK et al (2009) Deletion of the von Hippel‐Lindau gene in pancreatic beta cells impairs glucose homeostasis in mice. J Clin Invest 119: 125–135 [DOI] [PMC free article] [PubMed] [Google Scholar]
- Cataldo LR, Singh T, Achanta K, Bsharat S, Prasad RB, Luan C, Renström E, Eliasson L, Artner I (2022) MAFA and MAFB regulate exocytosis‐related genes in human β‐cells. Acta Physiol (Oxf) 234: e13761 [DOI] [PubMed] [Google Scholar]
- Catrina SB, Zheng X (2021) Hypoxia and hypoxia‐inducible factors in diabetes and its complications. Diabetologia 64: 709–716 [DOI] [PMC free article] [PubMed] [Google Scholar]
- Cavadas MAS, Cheong A, Taylor CT (2017) The regulation of transcriptional repression in hypoxia. Exp Cell Res 356: 173–181 [DOI] [PubMed] [Google Scholar]
- Chung SY, Kao CH, Villarroya F, Chang HY, Chang HC, Hsiao SP, Liou GG, Chen SL (2015) Bhlhe40 represses PGC‐1α activity on metabolic gene promoters in myogenic cells. Mol Cell Biol 35: 2518–2529 [DOI] [PMC free article] [PubMed] [Google Scholar]
- Coppola T, Perret‐Menoud V, Lüthi S, Farnsworth CC, Glomset JA, Regazzi R (1999) Disruption of Rab3‐calmodulin interaction, but not other effector interactions, prevents Rab3 inhibition of exocytosis. EMBO J 18: 5885–5891 [DOI] [PMC free article] [PubMed] [Google Scholar]
- Dolai S, Xie L, Zhu D, Liang T, Qin T, Xie H, Kang Y, Chapman ER, Gaisano HY (2016) Synaptotagmin‐7 functions to replenish insulin granules for exocytosis in human islet β‐cells. Diabetes 65: 1962–1976 [DOI] [PMC free article] [PubMed] [Google Scholar]
- Fukui K, Yang Q, Cao Y, Takahashi N, Hatakeyama H, Wang H, Wada J, Zhang Y, Marselli L, Nammo T et al (2005) The HNF‐1 target collectrin controls insulin exocytosis by SNARE complex formation. Cell Metab 2: 373–384 [DOI] [PubMed] [Google Scholar]
- Gaston K, Jayaraman PS (2003) Transcriptional repression in eukaryotes: repressors and repression mechanisms. Cell Mol Life Sci 60: 721–741 [DOI] [PMC free article] [PubMed] [Google Scholar]
- Gerber PA, Rutter GA (2017) The role of oxidative stress and hypoxia in pancreatic Beta‐cell dysfunction in diabetes mellitus. Antioxid Redox Signal 26: 501–518 [DOI] [PMC free article] [PubMed] [Google Scholar]
- Görlach A, Dimova EY, Petry A, Martínez‐Ruiz A, Hernansanz‐Agustín P, Rolo AP, Palmeira CM, Kietzmann T (2015) Reactive oxygen species, nutrition, hypoxia and diseases: problems solved? Redox Biol 6: 372–385 [DOI] [PMC free article] [PubMed] [Google Scholar]
- Gunton JE (2020) Hypoxia‐inducible factors and diabetes. J Clin Invest 130: 5063–5073 [DOI] [PMC free article] [PubMed] [Google Scholar]
- Hang Y, Yamamoto T, Benninger RK, Brissova M, Guo M, Bush W, Piston DW, Powers AC, Magnuson M, Thurmond DC et al (2014) The MafA transcription factor becomes essential to islet β‐cells soon after birth. Diabetes 63: 1994–2005 [DOI] [PMC free article] [PubMed] [Google Scholar]
- Huang W, Sherman BT, Lempicki RA (2009a) Bioinformatics enrichment tools: paths toward the comprehensive functional analysis of large gene lists. Nucleic Acids Res 37: 1–13 [DOI] [PMC free article] [PubMed] [Google Scholar]
- Huang W, Sherman BT, Lempicki RA (2009b) Systematic and integrative analysis of large gene lists using DAVID bioinformatics resources. Nat Protoc 4: 44–57 [DOI] [PubMed] [Google Scholar]
- Hudish LI, Reusch JE, Sussel L (2019) β cell dysfunction during progression of metabolic syndrome to type 2 diabetes. J Clin Invest 129: 4001–4008 [DOI] [PMC free article] [PubMed] [Google Scholar]
- Ilegems E, Bryzgalova G, Correia J, Yesildag B, Berra E, Ruas JL, Pereira TS, Berggren PO (2022) HIF‐1α inhibitor PX‐478 preserves pancreatic β cell function in diabetes. Sci Transl Med 14: eaba9112 [DOI] [PubMed] [Google Scholar]
- Ivanova A, Liao SY, Lerman MI, Ivanov S, Stanbridge EJ (2005) STRA13 expression and subcellular localisation in normal and tumour tissues: implications for use as a diagnostic and differentiation marker. J Med Genet 42: 565–576 [DOI] [PMC free article] [PubMed] [Google Scholar]
- Jarjour NN, Schwarzkopf EA, Bradstreet TR, Shchukina I, Lin CC, Huang SC, Lai CW, Cook ME, Taneja R, Stappenbeck TS et al (2019) Bhlhe40 mediates tissue‐specific control of macrophage proliferation in homeostasis and type 2 immunity. Nat Immunol 20: 687–700 [DOI] [PMC free article] [PubMed] [Google Scholar]
- John AN, Ram R, Jiang FX (2018) RNA‐seq analysis of islets to characterise the dedifferentiation in type 2 diabetes model mice db/db. Endocr Pathol 29: 207–221 [DOI] [PubMed] [Google Scholar]
- Kahn SE, Cooper ME, Del Prato S (2014) Pathophysiology and treatment of type 2 diabetes: perspectives on the past, present, and future. Lancet 383: 1068–1083 [DOI] [PMC free article] [PubMed] [Google Scholar]
- Kelly DP, Scarpulla RC (2004) Transcriptional regulatory circuits controlling mitochondrial biogenesis and function. Genes Dev 18: 357–368 [DOI] [PubMed] [Google Scholar]
- Kim D, Paggi JM, Park C, Bennett C, Salzberg SL (2019) Graph‐based genome alignment and genotyping with HISAT2 and HISAT‐genotype. Nat Biotechnol 37: 907–915 [DOI] [PMC free article] [PubMed] [Google Scholar]
- Kitamura T (2013) The role of FOXO1 in β‐cell failure and type 2 diabetes mellitus. Nat Rev Endocrinol 9: 615–623 [DOI] [PubMed] [Google Scholar]
- Ku HC, Cheng CF (2020) Master regulator activating transcription factor 3 (ATF3) in metabolic homeostasis and cancer. Front Endocrinol (Lausanne) 11: 556 [DOI] [PMC free article] [PubMed] [Google Scholar]
- LaGory EL, Wu C, Taniguchi CM, Ding CC, Chi JT, von Eyben R, Scott DA, Richardson AD, Giaccia AJ (2015) Suppression of PGC‐1α is critical for reprogramming oxidative metabolism in renal cell carcinoma. Cell Rep 12: 116–127 [DOI] [PMC free article] [PubMed] [Google Scholar]
- Lee P, Chandel NS, Simon MC (2020) Cellular adaptation to hypoxia through hypoxia inducible factors and beyond. Nat Rev Mol Cell Biol 21: 268–283 [DOI] [PMC free article] [PubMed] [Google Scholar]
- Li D, Yin X, Zmuda EJ, Wolford CC, Dong X, White MF, Hai T (2008) The repression of IRS2 gene by ATF3, a stress‐inducible gene, contributes to pancreatic beta‐cell apoptosis. Diabetes 57: 635–644 [DOI] [PubMed] [Google Scholar]
- Li H, Handsaker B, Wysoker A, Fennell T, Ruan J, Homer N, Marth G, Abecasis G, Durbin R (2009) The sequence alignment/map format and SAMtools. Bioinformatics 25: 2078–2079 [DOI] [PMC free article] [PubMed] [Google Scholar]
- Lin J, Handschin C, Spiegelman BM (2005) Metabolic control through the PGC‐1 family of transcription coactivators. Cell Metab 1: 361–370 [DOI] [PubMed] [Google Scholar]
- Ling C, Del Guerra S, Lupi R, Rönn T, Granhall C, Luthman H, Masiello P, Marchetti P, Groop L, Del Prato S (2008) Epigenetic regulation of PPARGC1A in human type 2 diabetic islets and effect on insulin secretion. Diabetologia 51: 615–622 [DOI] [PMC free article] [PubMed] [Google Scholar]
- Love MI, Huber W, Anders S (2014) Moderated estimation of fold change and dispersion for RNA‐seq data with DESeq2. Genome Biol 15: 550 [DOI] [PMC free article] [PubMed] [Google Scholar]
- Mathelier A, Fornes O, Arenillas DJ, Chen CY, Denay G, Lee J, Shi W, Shyr C, Tan G, Worsley‐Hunt R et al (2016) JASPAR 2016: a major expansion and update of the open‐access database of transcription factor binding profiles. Nucleic Acids Res 44: D110–D115 [DOI] [PMC free article] [PubMed] [Google Scholar]
- Miyazaki K, Kawamoto T, Tanimoto K, Nishiyama M, Honda H, Kato Y (2002) Identification of functional hypoxia response elements in the promoter region of the DEC1 and DEC2 genes. J Biol Chem 277: 47014–47021 [DOI] [PubMed] [Google Scholar]
- Nagamatsu S, Watanabe T, Nakamichi Y, Yamamura C, Tsuzuki K, Matsushima S (1999) Alpha‐soluble N‐ethylmaleimide‐sensitive factor attachment protein is expressed in pancreatic beta cells and functions in insulin but not gamma‐aminobutyric acid secretion. J Biol Chem 274: 8053–8060 [DOI] [PubMed] [Google Scholar]
- Nishiyama Y, Goda N, Kanai M, Niwa D, Osanai K, Yamamoto Y, Senoo‐Matsuda N, Johnson RS, Miura S, Kabe Y et al (2012) HIF‐1α induction suppresses excessive lipid accumulation in alcoholic fatty liver in mice. J Hepatol 56: 441–447 [DOI] [PubMed] [Google Scholar]
- Oh E, Kalwat MA, Kim MJ, Verhage M, Thurmond DC (2012) Munc18‐1 regulates first‐phase insulin release by promoting granule docking to multiple syntaxin isoforms. J Biol Chem 287: 25821–25833 [DOI] [PMC free article] [PubMed] [Google Scholar]
- Ohara‐Imaizumi M, Fujiwara T, Nakamichi Y, Okamura T, Akimoto Y, Kawai J, Matsushima S, Kawakami H, Watanabe T, Akagawa K et al (2007) Imaging analysis reveals mechanistic differences between first‐ and second‐phase insulin exocytosis. J Cell Biol 177: 695–705 [DOI] [PMC free article] [PubMed] [Google Scholar]
- Pertea M, Pertea GM, Antonescu CM, Chang TC, Mendell JT, Salzberg SL (2015) StringTie enables improved reconstruction of a transcriptome from RNA‐seq reads. Nat Biotechnol 33: 290–295 [DOI] [PMC free article] [PubMed] [Google Scholar]
- Prentki M, Nolan CJ (2006) Islet beta cell failure in type 2 diabetes. J Clin Invest 116: 1802–1812 [DOI] [PMC free article] [PubMed] [Google Scholar]
- Puigserver P, Spiegelman BM (2003) Peroxisome proliferator‐activated receptor‐gamma coactivator 1 alpha (PGC‐1 alpha): transcriptional coactivator and metabolic regulator. Endocr Rev 24: 78–90 [DOI] [PubMed] [Google Scholar]
- Puri S, Cano DA, Hebrok M (2009) A role for von Hippel‐Lindau protein in pancreatic beta‐cell function. Diabetes 58: 433–441 [DOI] [PMC free article] [PubMed] [Google Scholar]
- Raum JC, Gerrish K, Artner I, Henderson E, Guo M, Sussel L, Schisler JC, Newgard CB, Stein R (2006) FoxA2, Nkx2.2, and PDX‐1 regulate islet beta‐cell‐specific mafA expression through conserved sequences located between base pairs −8118 and −7750 upstream from the transcription start site. Mol Cell Biol 26: 5735–5743 [DOI] [PMC free article] [PubMed] [Google Scholar]
- Raum JC, Hunter CS, Artner I, Henderson E, Guo M, Elghazi L, Sosa‐Pineda B, Ogihara T, Mirmira RG, Sussel L et al (2010) Islet beta‐cell‐specific MafA transcription requires the 5′‐flanking conserved region 3 control domain. Mol Cell Biol 30: 4234–4244 [DOI] [PMC free article] [PubMed] [Google Scholar]
- Rorsman P, Renström E (2003) Insulin granule dynamics in pancreatic beta cells. Diabetologia 46: 1029–1045 [DOI] [PubMed] [Google Scholar]
- Sato Y, Endo H, Okuyama H, Takeda T, Iwahashi H, Imagawa A, Yamagata K, Shimomura I, Inoue M (2011) Cellular hypoxia of pancreatic beta‐cells due to high levels of oxygen consumption for insulin secretion in vitro. J Biol Chem 286: 12524–12532 [DOI] [PMC free article] [PubMed] [Google Scholar]
- Sato Y, Inoue M, Yoshizawa T, Yamagata K (2014) Moderate hypoxia induces β‐cell dysfunction with HIF‐1‐independent gene expression changes. PLoS One 9: e114868 [DOI] [PMC free article] [PubMed] [Google Scholar]
- Sato F, Bhawal UK, Yoshimura T, Muragaki Y (2016) DEC1 and DEC2 crosstalk between circadian rhythm and tumor progression. J Cancer 7: 153–159 [DOI] [PMC free article] [PubMed] [Google Scholar]
- Sato Y, Tsuyama T, Sato C, Karim MF, Yoshizawa T, Inoue M, Yamagata K (2017) Hypoxia reduces HNF4α/MODY1 protein expression in pancreatic β‐cells by activating AMP‐activated protein kinase. J Biol Chem 292: 8716–8728 [DOI] [PMC free article] [PubMed] [Google Scholar]
- Scarpulla RC (2008) Transcriptional paradigms in mammalian mitochondrial biogenesis and function. Physiol Rev 88: 611–638 [DOI] [PubMed] [Google Scholar]
- Shen L, Cui A, Xue Y, Cui Y, Dong X, Gao Y, Yang H, Fang F, Chang Y (2014) Hepatic differentiated embryo‐chondrocyte‐expressed gene 1 (Dec1) inhibits sterol regulatory element‐binding protein‐1c (Srebp‐1c) expression and alleviates fatty liver phenotype. J Biol Chem 289: 23332–23342 [DOI] [PMC free article] [PubMed] [Google Scholar]
- Skarnes WC, Rosen B, West AP, Koutsourakis M, Bushell W, Iyer V, Mujica AO, Thomas M, Harrow J, Cox T et al (2011) A conditional knockout resource for the genome‐wide study of mouse gene function. Nature 474: 337–342 [DOI] [PMC free article] [PubMed] [Google Scholar]
- St‐Pierre B, Flock G, Zacksenhaus E, Egan SE (2002) Stra13 homodimers repress transcription through class B E‐box elements. J Biol Chem 277: 46544–46551 [DOI] [PubMed] [Google Scholar]
- Subramanian A, Tamayo P, Mootha VK, Mukherjee S, Ebert BL, Gillette MA, Paulovich A, Pomeroy SL, Golub TR, Lander ES et al (2005) Gene set enrichment analysis: a knowledge‐based approach for interpreting genome‐wide expression profiles. Proc Natl Acad Sci U S A 102: 15545–15550 [DOI] [PMC free article] [PubMed] [Google Scholar]
- Sun H, Taneja R (2000) Stra13 expression is associated with growth arrest and represses transcription through histone deacetylase (HDAC)‐dependent and HDAC‐independent mechanisms. Proc Natl Acad Sci U S A 97: 4058–4063 [DOI] [PMC free article] [PubMed] [Google Scholar]
- Turner RC, McCarthy ST, Holman RR, Harris E (1976) Beta‐cell function improved by supplementing basal insulin secretion in mild diabetes. Br Med J 1: 1252–1254 [DOI] [PMC free article] [PubMed] [Google Scholar]
- Yamamoto K, Matsuoka TA, Kawashima S, Takebe S, Kubo F, Miyatsuka T, Kaneto H, Shimomura I (2013) A novel function of Onecut1 protein as a negative regulator of MafA gene expression. J Biol Chem 288: 21648–21658 [DOI] [PMC free article] [PubMed] [Google Scholar]
- Yun Z, Maecker HL, Johnson RS, Giaccia AJ (2002) Inhibition of PPAR gamma 2 gene expression by the HIF‐1‐regulated gene DEC1/Stra13: a mechanism for regulation of adipogenesis by hypoxia. Dev Cell 2: 331–341 [DOI] [PubMed] [Google Scholar]
- Zehetner J, Danzer C, Collins S, Eckhardt K, Gerber PA, Ballschmieter P, Galvanovskis J, Shimomura K, Ashcroft FM, Thorens B et al (2008) pVHL is a regulator of glucose metabolism and insulin secretion in pancreatic β cells. Genes Dev 22: 3135–3146 [DOI] [PMC free article] [PubMed] [Google Scholar]
- Zhang C, Moriguchi T, Kajihara M, Esaki R, Harada A, Shimohata H, Oishi H, Hamada M, Morit N, Hasegawa K et al (2005) MafA is a key regulator of glucose‐stimulated insulin secretion. Mol Cell Biol 25: 4969–4976 [DOI] [PMC free article] [PubMed] [Google Scholar]
- Zheng X, Zheng X, Wang X, Ma Z, Gupta Sunkari V, Botusan I, Takeda T, Björklund A, Inoue M, Catrina SB et al (2012) Acute hypoxia induces apoptosis of pancreatic β‐cell by activation of the unfolded protein response and upregulation of CHOP. Cell Death Dis 3: e322 [DOI] [PMC free article] [PubMed] [Google Scholar]
- Zmuda EJ, Viapiano M, Grey ST, Hadley G, Garcia‐Ocaña A, Hai T (2010a) Deficiency of Atf3, an adaptive‐response gene, protects islets and ameliorates inflammation in a syngeneic mouse transplantation model. Diabetologia 53: 1438–1450 [DOI] [PMC free article] [PubMed] [Google Scholar]
- Zmuda EJ, Qi L, Zhu MX, Mirmira RG, Montminy MR, Hai T (2010b) The roles of ATF3, an adaptive‐response gene, in high‐fat‐diet‐induced diabetes and pancreatic beta‐cell dysfunction. Mol Endocrinol 24: 1423–1433 [DOI] [PMC free article] [PubMed] [Google Scholar]