

Abstract
Precise regulation of mitochondrial fusion and fission is essential for cellular activity and animal development. Imbalances between these processes can lead to fragmentation and loss of normal membrane potential in individual mitochondria. In this study, we show that MIRO‐1 is stochastically elevated in individual fragmented mitochondria and is required for maintaining mitochondrial membrane potential. We further observe a higher level of membrane potential in fragmented mitochondria in fzo‐1 mutants and wounded animals. Moreover, MIRO‐1 interacts with VDAC‐1, a crucial mitochondrial ion channel located in the outer mitochondrial membrane, and this interaction depends on the residues E473 of MIRO‐1 and K163 of VDAC‐1. The E473G point mutation disrupts their interaction, resulting in a reduction of the mitochondrial membrane potential. Our findings suggest that MIRO‐1 regulates membrane potential and maintains mitochondrial activity and animal health by interacting with VDAC‐1. This study provides insight into the mechanisms underlying the stochastic maintenance of membrane potential in fragmented mitochondria.
Keywords: Caenorhabditis elegans, MIRO‐1, mitochondrial fragmentation, mitochondrial membrane potential (ΔΨm), VDAC‐1
Subject Categories: Membranes & Trafficking, Metabolism, Organelles
MIRO‐1 interacts with VDAC‐1 to modulate its activity and regulate mitochondrial membrane potential in C. elegans, which provides mechanistic insight into the stochastic maintenance of activity in fragmented mitochondria.

Introduction
Mitochondria are essential organelles that play a crucial role in maintaining energy production and cellular activity through two opposing processes—fusion and fission (Youle & van der Bliek, 2012; Sabouny & Shutt, 2020). An imbalance in these processes can lead to cell death, developmental defects, and disease. Fragmented mitochondria are typically associated with reduced function, decreased membrane potential, and lower oxidative phosphorylation levels than intact mitochondria (Knott et al, 2008). In humans, mutations in a mitochondrial fusion protein mitofusin 2 (MFN2) cause Charcot‐Marie‐Tooth neuropathy type 2A (Zuchner et al, 2004), while mutations in OPA1, another mitochondrial fusion regulator, cause dominant optic atrophy (Frezza et al, 2006). In mice, the loss of function of either MFN1/2 or OPA1 results in embryonic lethality (Chen et al, 2003; Frezza et al, 2006). However, deletion of MFN1/2 and OPA1 orthologs in Caenorhabditis elegans does not result in embryonic lethality but rather slow growth and small brood size (Ichishita et al, 2008; Kanazawa et al, 2008). It has been suggested that these mutants' fragmented mitochondria could maintain minimal energy production and mitochondrial activity throughout development (Ichishita et al, 2008). However, the underlying molecular mechanism remains unknown.
Mitochondrial fragmentation often leads to a loss of mitochondrial membrane potential (ΔΨm), an essential electrochemical gradient between the mitochondrial intermembrane space and the mitochondrial matrix. Cells with defective fusion have considerably reduced growth rates and respiration, along with a highly heterogeneous mitochondrial population that is prone to loss of ΔΨm (Zorova et al, 2018). Mouse embryonic fibroblasts (MEFs) that lack MFN1/2 suffer from reduced respiratory capacity but also experience a seemingly stochastic loss of ΔΨm (Chen et al, 2005). Therefore, mitochondrial fusion and intermixing of mitochondrial content appear to be significant factors in maintaining respiratory capacity and cellular function. ΔΨm can be affected by various factors, such as the activities of electron transport chain (ETC) complexes, proton leakage, and ion transport (Zorova et al, 2018). However, the mechanism underlying ΔΨm regulation in vivo is not yet fully understood.
Voltage‐dependent anion channel (VDAC‐1) is a multi‐functional ion channel in the outer mitochondrial membrane (OMM). It has been proposed to be part of the still‐elusive permeability transition pore (PTP), a hypothetical multiprotein complex that may contribute to the mitochondrial permeability transition (MPT) (Tomasello et al, 2009; De Stefani et al, 2012; Shoshan‐Barmatz et al, 2018). VDAC‐1 can regulate voltage‐gating activity to control OMM permeability, regulating the transportation of a range of metabolites and ions (Sander et al, 2021). As a gatekeeper, VDAC‐1 plays an important role in maintaining mitochondrial function and cellular viability by regulating its channel conductance and maintaining ΔΨm homeostasis (Tomasello et al, 2009; Kim et al, 2019; Lipper et al, 2019).
MIRO‐1 is a mitochondrial Rho GTPase on the OMM that controls mitochondrial trafficking, transportation, and distribution (Cai & Sheng, 2009). miro‐1 deletion disrupts mitochondrial transportation and induces mitochondrial aggregation and clustering (Frederick et al, 2004; Guo et al, 2005; Nguyen et al, 2014). MIRO‐1 dysfunction can lead to elongated and thread‐like mitochondria (Frederick et al, 2004; Xu et al, 2016) and may also alter cristae architecture (Modi et al, 2019). With its two EF‐hand domains, MIRO‐1 can sense changes in cellular Ca2+ levels and regulate mitochondrial trafficking (Cai & Sheng, 2009; Wang & Schwarz, 2009). Therefore, MIRO‐1 is a crucial protein in maintaining proper mitochondrial distribution and structure, which is essential for normal mitochondrial function and cellular health.
In this study, we discovered that MIRO‐1 localization is stochastically enriched in the fragmented mitochondria in C. elegans epidermis, and its presence is important to maintain the mitochondrial function and overall health of the organism. Specifically, we observed that MIRO‐1 is required for maintaining ΔΨm in the epidermis. By using the pupylation‐based interaction tagging (PUP‐IT) system coupled with mass spectrometry (MS), we identified VDAC‐1 as an interacting partner of MIRO‐1 to regulate ΔΨm. Our findings suggest that MIRO‐1 interacts with VDAC‐1 and modulates its channel activity to maintain ΔΨm, thereby contributing to the animal's health.
Results
Elevated localization of MIRO‐1 in individual fragmented mitochondria
We used Pcol‐19‐mito::GFP to visualize mitochondria in C. elegans epidermis (Xu & Chisholm, 2014) and observed that various fragmented mitochondria in both fzo‐1 (MFN1/2 orthology) and eat‐3 (Opa1 orthology) mutants exhibited an unexpected loss of the mito::GFP signal compared with the wild‐type (WT) animal (Fig EV1A). We hypothesized that individual fragmented mitochondria in these mutants might have distinct functions. To test this hypothesis, we stained animals with ΔΨm specific dye tetramethylrhodamine ethyl ester (TMRE) (Fig EV1B) and quantified the signal by normalizing it to that of TOMM‐20::GFP. We observed a significant reduction in TMRE signal in fzo‐1 mutants compared with WT (Fig EV1C and D). Interestingly, while most fragmented mitochondria lost the TMRE signal, several mitochondria maintained a strong TMRE signal (Fig 1A). However, it was unclear how these fragmented mitochondria could maintain ΔΨm.
Figure EV1. Elevated localization of MIRO‐1 in the fragmented mitochondria.
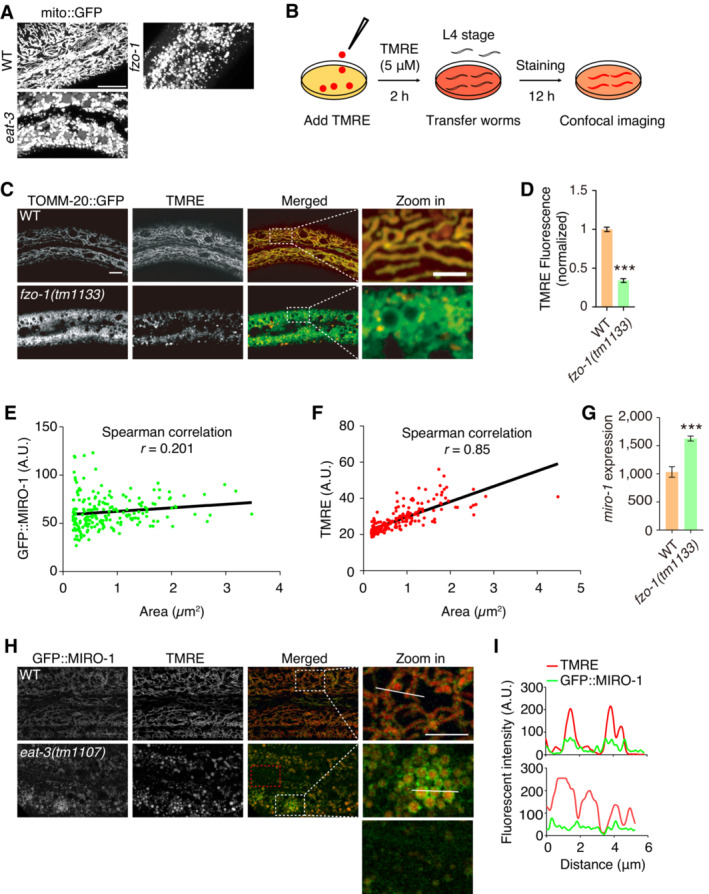
- Representative confocal images show mito::GFP signal for mitochondrial morphology in WT, fzo‐1(tm1133), and eat‐3(tm1107) mutants. Fragmented mitochondria are observed in both fzo‐1(tm1133) and eat‐3(tm1107) mutants.
- Schematic of the TMRE staining method in Caenorhabditis elegans epidermis. TMRE is added to the NGM plate for 2 h, and then L4 stage worms are transferred to the plate to culture 12 h before being subjected to confocal imaging.
- Representative confocal microscopy images show TMRE signal in WT and fzo‐1(tm1133) mutants. Red fluorescence shows TMRE staining, and green fluorescence shows mitochondria tagged with GFP.
- Quantitation of TMRE fluorescence normalized to mito::GFP in fzo‐1(tm1133) mutants compared with WT, n > 300 mitochondria.
- The correlation between the mitochondrial size and MIRO‐1 content. Spearman's correlation analysis of the mitochondrial size and MIRO‐1 expression in fzo‐1 mutant. n = 196 mitochondria.
- The correlation between mitochondrial size and mitochondrial membrane potential. Spearman's correlation analysis of the mitochondrial size and TMRE intensity in fzo‐1 mutants. n = 187 mitochondria.
- Real‐time PCR test for miro‐1 expression in WT and fzo‐1(tm1133) mutants. n = 3, biological replicates.
- Representative confocal images show the GFP::MIRO‐1 and TMRE staining in WT and eat‐3(tm1107) mutants.
- Plot analysis of GFP::MIRO‐1 and TMRE signals.
Data information: Data are shown as the mean ± SEM. ***P < 0.001 (unpaired t‐test). Scale bars, 10 and 5 μm (zoom in).
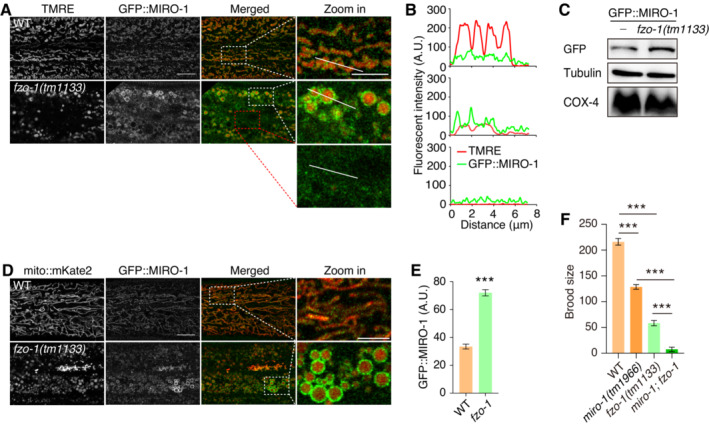
Figure 1. Elevated localization of MIRO‐1 and ΔΨm in the fragmented mitochondria in fzo‐1 mutants.
-
A, BFluorescence confocal microscopy images show TMRE staining and GFP::MIRO‐1 in WT and fzo‐1 mutant animals. Dashed lines outline regions where fluorescence intensity was quantified.
-
CImmunoblot shows protein levels of MIRO‐1 in WT and fzo‐1 mutant animals, with tubulin and COX‐4 serving as loading controls.
-
DFluorescence confocal images show GFP::MIRO‐1 and mito::mKate2 in WT and fzo‐1 mutants.
-
EQuantification of GFP::MIRO‐1 levels in WT and fzo‐1 mutants. n ≥ 33, biological replicates.
-
FQuantification of brood size in WT, miro‐1, fzo‐1, and miro‐1; fzo‐1 double mutants. Note the further reduction in miro‐1; fzo‐1 double mutants. n ≥ 8, biological replicates.
Data information: Data are shown as the mean ± SEM. ***P < 0.001 (One‐way ANOVA test for multiple comparisons). Scale bars, 10 and 5 μm (zoom in).
Previously, it was demonstrated that MIRO‐1 plays an important role in regulating mitochondrial morphology in C. elegans epidermis (Xu et al, 2016; Fu et al, 2020). To investigate MIRO‐1 localization in fzo‐1 mutants, a GFP::miro‐1 knock‐in (KI) strain was utilized. Interestingly, an uneven distribution of the GFP::MIRO‐1 signal was observed, with some fragmented mitochondria showing an increased MIRO‐1 signal (Fig 1A and B). These mitochondria also showed elevated TMRE signals (Fig 1A and B), indicating high ΔΨm. In contrast, a low TMRE signal was associated with an undetectable GFP::MIRO‐1 signal (Fig 1A and B). Correlation analysis showed a weak but significant correlation between mitochondrial size and MIRO‐1 content, suggesting that MIRO‐1 tended to accumulate in larger mitochondria (Fig EV1E). A strong correlation between TMRE signal and fragmented mitochondria size was observed, indicating that larger mitochondria are better equipped to maintain mitochondrial function, consistent with the higher level of MIRO‐1 localization in these mitochondria (Fig EV1F). Western blot analysis revealed an overall increase in GFP::MIRO‐1 expression in fzo‐1 mutants (Fig 1C).
To confirm our observation of elevated localization of MIRO‐1 in fragmented mitochondria, we examined GFP::MIRO‐1 in mito::mKate2 transgenic animals and observed an increase in GFP::MIRO‐1 signal in mitochondria with high levels of mito::mKate2, while mitochondria with low GFP::MIRO‐1 accumulation exhibited low mito::mKate2 (Fig 1D). Statistical analysis showed that the GFP::MIRO‐1 signal was significantly higher in fzo‐1 mutants than in WT animals (Fig 1E). Furthermore, we found that miro‐1 mRNA expression was also significantly higher in fzo‐1 mutants (Fig EV1G). Together, these observations suggest that MIRO‐1 stochastic localization may associate with ΔΨm maintenance and the function of the fragmented mitochondria.
To confirm this hypothesis, we further analyzed the distribution of GFP::MIRO‐1 in the eat‐3 mutant, which also exhibited mitochondrial fragmentation. We observed that the GFP::MIRO‐1 signal accumulated in fragmented mitochondria with high levels of TMRE signal in eat‐3 mutants (Fig EV1H and I), suggesting that MIRO‐1 localization is associated with ΔΨm maintenance in fragmented mitochondria. Notably, fzo‐1 and miro‐1 single mutants have reduced overall brood size. fzo‐1; miro‐1 double mutants exhibited even smaller brood size than fzo‐1 single mutants and were almost sterile (Fig 1F). These results suggest that MIRO‐1 is required for the overall health of the fzo‐1 mutant, potentially by regulating ΔΨm.
Elevated localization of MIRO‐1 in fragmented mitochondria of wounded animals
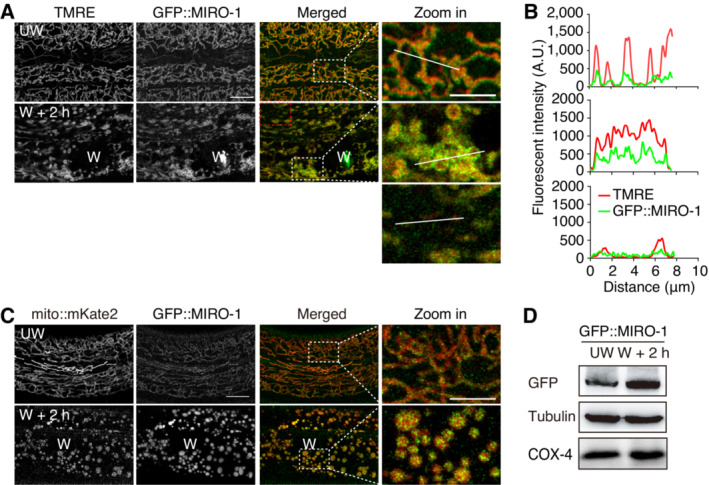
Environmental stresses can induce mitochondrial fragmentation, resulting in immediate and long‐term consequences (Youle & van der Bliek, 2012). For instance, cellular injuries can cause rapid mitochondrial fragmentation to facilitate membrane repair (Fu et al, 2020; Horn et al, 2020; Ponte et al, 2020). We observed that wounding‐induced mitochondrial fragmentation also caused severe ΔΨm loss (Fig EV2A–D; Movie EV1). Similar to the fragmented mitochondria observed in the fzo‐1 mutant, the TMRE signal in the wounded epidermis was heterogeneous. However, most fragmented mitochondria lost the TMRE signal, some fragmented mitochondria maintained a strong TMRE signal (Fig 2A). Interestingly, the GFP::MIRO‐1 signal was highest in fragmented mitochondria with high TMRE signals (Fig 2A and B). In contrast, the GFP::MIRO‐1 signal was barely detectable in mitochondria with a low TMRE signal (Fig 2A and B). In addition, we found that the GFP::MIRO‐1 signal was significantly increased in fragmented mitochondria in WT and wounded animals (Fig 2C), consistent with observations in fzo‐1 mutants (Fig 1D). Western blot analysis showed that GFP::MIRO‐1 expression was increased after wounding (Fig 2D). Furthermore, quantitative real‐time PCR (qRT–PCR) analysis showed that miro‐1 expression was significantly upregulated at 2 h after wounding (Fig EV2E). Together, these results suggested that MIRO‐1 expression and localization are enriched in the fragmented mitochondria with a higher level of ΔΨm, indicating a potential role for MIRO‐1 in regulating mitochondrial activity that benefits its function.
Figure EV2. Wounding induces immediate reduction of ΔΨm.
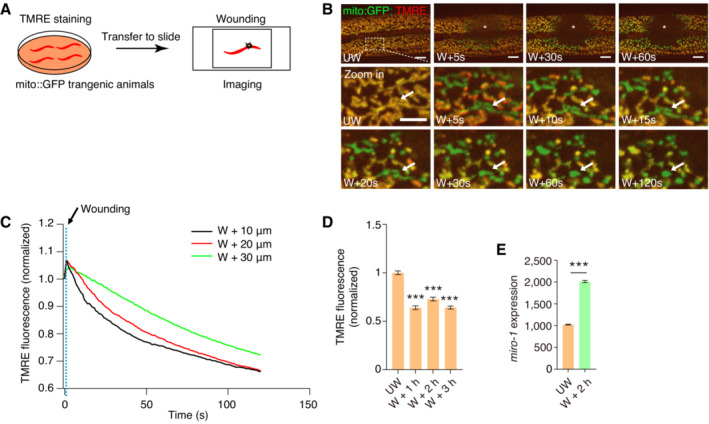
- Schematic representation of the ΔΨm determination upon laser wounding in Caenorhabditis elegans epidermis.
- Representative confocal images show TMRE signal after laser wounding. The bottom panels show the changes in mitochondrial morphology and ΔΨm in magnification images. The white arrow indicates a tubular mitochondrion depolarizing quickly, followed by fragmentation.
- Quantitation of the ratio of TMRE fluorescence normalized to mito::GFP at the wound site in (B). The reduction of TMRE is first at the wound site and then spreads to the neighboring region.
- Quantitation of TMRE fluorescence to mito::GFP at different time points after wounding. n > 300 mitochondria.
- Quantitative PCR is used to measure miro‐1 expression before and 2 h after wounding treatment.
Data information: Data are shown as the mean ± SEM. ***P < 0.001 (unpaired t‐test or one‐way ANOVA test). Scale bars, 10 and 5 μm (zoom in).
Figure 2. Elevated localization of MIRO‐1 in fragmented mitochondria of wounded animals.
-
A, BFluorescence confocal microscopy images show TMRE staining and GFP::MIRO‐1 in WT animals with and without needle wounding. Dashed lines outline regions where fluorescence intensity was quantified.
-
CRepresentative confocal images showing GFP::MIRO‐1 and mito::mKate2 before and 2 h after wounding.
-
DImmunoblot shows protein levels of MIRO‐1 before and 2 h after wounding, with tubulin and COX‐4 serving as loading controls.
Data information: Scale bars, 10 and 5 μm (zoom in).
MIRO‐1 is required for ΔΨm maintenance
We then determined whether MIRO‐1 affected ΔΨm in vivo and performed a quantitative analysis using TMRE staining. We observed a significant reduction in TMRE fluorescence in miro‐1(tm1966) loss of function mutants (Fig 3A and B). Consistently, overexpression of miro‐1 cDNA in the epidermis increased TMRE signal (Fig 3A and B). Moreover, TMRE signal was also reduced in other miro‐1 knockout animals (Fig EV3). To validate this, we isolated mitochondria from the animals and stained them with JC‐1, another dye used to detect ΔΨm (Perry et al, 2011). The ratiometric ΔΨm‐responsive fluorescence of JC‐1 was significantly reduced in mitochondria from miro‐1(tm1966) mutants compared with WT (Fig 3C). As ΔΨm is crucial for ATP production, we assessed whether the loss of MIRO‐1 function affected ATP level. We observed a significant reduction in ATP levels in mitochondria isolated from miro‐1(tm1966) mutants compared with WT (Fig 3D). Together, these observations suggested that MIRO‐1 is required to maintain ΔΨm and ATP levels.
Figure 3. MIRO‐1 is required for the maintenance of ΔΨm.
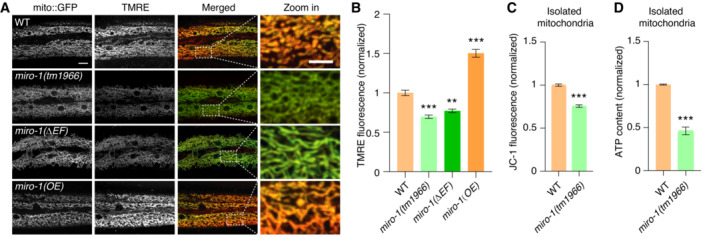
- Representative confocal images show the TMRE and mito::GFP signals in WT, miro‐1(tm1966), miro‐1(ΔEF) (EF‐hand domain mutation), and miro‐1(OE, overexpression) animals.
- Quantitation of TMRE and mito::GFP signals (normalized ratio of TMRE fluorescence to mito::GFP fluorescence). n > 200 mitochondria.
- Quantitation of TMRE and mito::GFP signals in isolated mitochondria from WT and miro‐1(tm1966) mutants using the JC‐1 stain red fluorescence (excitation, 550 nm; emission, 600 nm) to green fluorescence (excitation, 485 nm; emission, 535 nm) ratio. n = 3, biological replicates.
- ATP content of crude isolated mitochondria from WT and miro‐1(tm1966) mutants as measured with a commercial luminescence kit. n = 3, biological replicates.
Data information: Data are shown as the mean ± SEM. **P < 0.01, ***P < 0.001 (unpaired t‐test for two, one‐way ANOVA for multiple comparisons). Scale bars, 10 and 5 μm (zoom in).
Figure EV3. MIRO‐1 is required for the maintenance of ΔΨm.
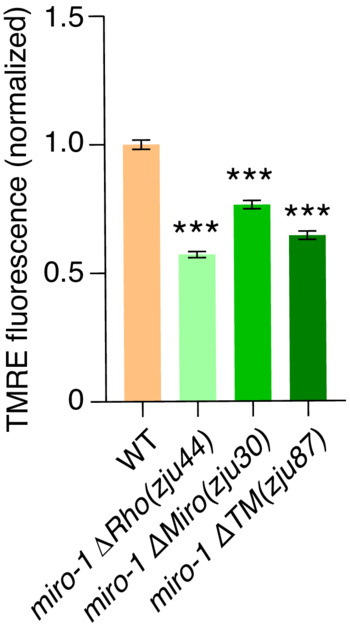
Quantification of the ratio of TMRE fluorescence normalized mito::GFP in WT, miro‐1ΔRho, miro‐1ΔMiro, and miro‐1ΔΤΜ (transmembrane domain) deletion mutants. n > 300 mitochondria. Data are shown as the mean ± SEM. ***P < 0.001 (one‐way ANOVA test).
MIRO‐1 interacts with VDAC‐1
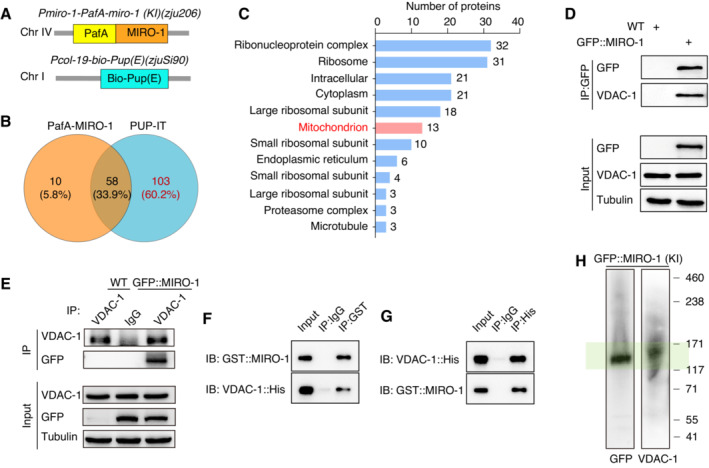
Next, we determined how MIRO‐1 maintains ΔΨm by screening for mitochondrial membrane proteins that interacted with MIRO‐1 using a proximity‐tagging system called PUP‐IT (PafA and biotin labeling system) (Liu et al, 2018). To achieve this, we generated a PafA::MIRO‐1 knock‐in strain and expressed Pcol‐19‐Bio‐Pup (E) in the epidermal cells of transgenic animals (Fig 4A). In this system, PafA protein is used to ligate Pup (E) to nearby interacting proteins, which are subsequently labeled with biotin (Fig EV4A; Liu et al, 2018). We observed that multiple proteins were captured in the PUP‐IT group but not in the PafA‐MIRO‐1 or Bio‐Pup (E) groups (Fig EV4B), using silver staining and immunoblot analysis with streptavidin and anti‐biotin antibodies. We then used liquid chromatography (LC)‐MS‐based proteomic analysis and identified 103 proteins in the PUP‐IT pulldown sample (Fig 4B; Table EV4). Furthermore, Gene Ontology (GO) cellular component annotations revealed that many of these proteins were annotated as localized to the mitochondria (Fig 4C).
Figure 4. VDAC‐1 interacts with MIRO‐1.
-
ASchematic of PUP‐IT transgenes. PafA (yellow) is knocked into the N‐terminal of endogenous MIRO‐1 (orange); the Bio‐Pup(E) tag (blue) is expressed in epidermal cells only.
-
BPotential MIRO‐1 interaction proteins (n = 103) in the PUP‐IT group.
-
CGene Ontology (GO) cellular component (CC) annotations are analyzed; this analysis yields 13 mitochondrial proteins that may interact with MIRO‐1.
-
DWestern blot analysis of the interaction between MIRO‐1 and VDAC‐1 by coimmunoprecipitating with GFP nanobody‐conjugated beads in GFP::MIRO‐1 animals and detected by GFP and VDAC‐1 antibodies.
-
EWestern blot analysis of the interaction between MIRO‐1 and VDAC‐1 by coimmunoprecipitating with VDAC‐1 antibody‐conjugated beads in GFP::MIRO‐1 animals and detected by GFP and VDAC‐1 antibodies.
-
F, GImmunoblot showing the immunoprecipitation of purified GST::MIRO‐1 and VDAC‐1::His with GST‐beads and His‐beads, respectively.
-
HBN–PAGE and immunoblot analysis of the total worm lysate of GFP::MIRO‐1 (KI) by GFP and VDAC‐1 antibodies. Green shading highlights the complex that contained MIRO‐1 and VDAC‐1 proteins.
Figure EV4. Identification of MIRO‐1 interaction proteins via PUP‐IT system in vivo .
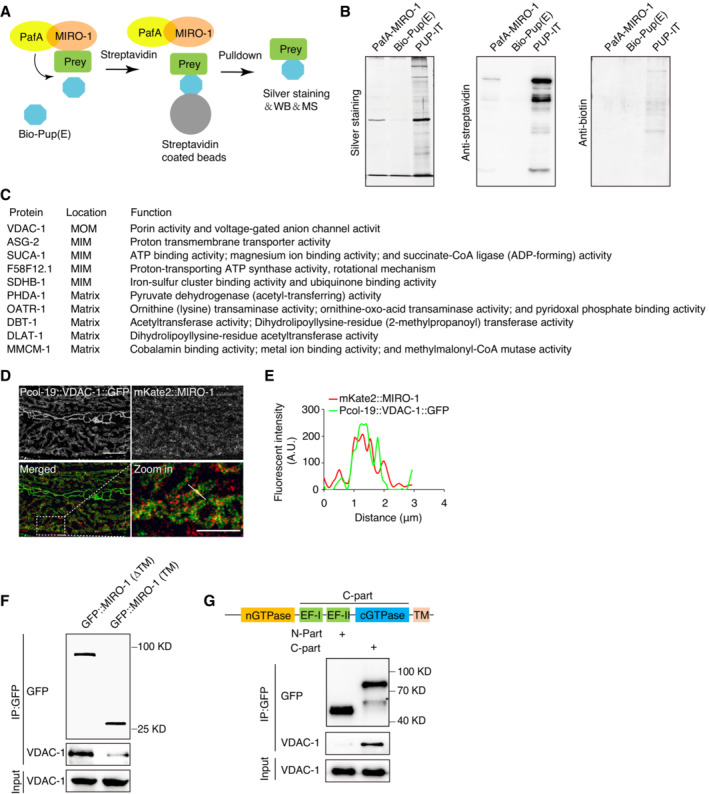
- Schematic representation of the PUP‐IT system. PafA (yellow) is fused to MIRO‐1 (orange) and mediates Bio‐Pup (E) (blue) modification of prey protein (green). The modified prey proteins are pulldown by streptavidin‐coated beads and detected by silver staining and mass spectrometry.
- Silver staining (left panel) shows the proteins pulldown by streptavidin‐coated beads in PafA‐MIRO‐1, Bio‐Pup (E), and PUP‐IT groups. Immunoblot (middle and right corrective) shows many streptavidin‐bonded and biotin‐labeled proteins by anti‐streptavidin and anti‐biotin antibodies.
- Table summarizing the names, mitochondrial localizations, and biological functions of 10 of 13 mitochondrial proteins identified in (Fig 4C).
- Representative confocal images show the colocalization between Pcol‐19::VDAC‐1::GFP and mKate2::MIRO‐1.
- Plot analysis shows partial colocalization between Pcol‐19::VDAC‐1::GFP and mKate2::MIRO‐1 in (D).
- Immunoblot analysis showing the immunoprecipitation of GFP::MIRO‐1 (ΔTM) and GFP::MIRO‐1 (TM), respectively, by GFP nanobody‐conjugated beads. GFP::MIRO‐1 (TM) is weakly interacting with VDAC‐1. However, GFP::MIRO‐1 (ΔTM) is strongly interacting with VDAC‐1.
- Immunoblot shows the immunoprecipitation of GFP::MIRO‐1 (nGTPase) and GFP::MIRO‐1 C‐part (EF‐hands + cGTPase), respectively, by GFP nanobody‐conjugated beads. GFP::MIRO‐1 C‐part is strongly interacting with VDAC‐1 (* indicating nonspecific band).
Data information: Scale bars, 10 and 5 μm (zoom in).
Out of the 13 mitochondrial proteins identified through proteomic analysis, VDAC‐1, an OMM protein known for its role in ions and metabolites transfer, was among them (Fig EV4C). Previous studies have shown that VDAC‐1 contributes to ΔΨm maintenance (Tomasello et al, 2009; Monaco et al, 2015; Zhou et al, 2019). We, therefore, investigated whether VDAC‐1 interacts with MIRO‐1 in vivo. Confocal imaging of VDAC‐1::GFP and mKate2::MIRO‐1 revealed colocalization in the epidermal mitochondria (Fig EV4D and E). Co‐immunoprecipitation (Co‐IP) in GFP::MIRO‐1(KI) animals precipitated with either GFP and VDAC‐1 antibodies showed detectable levels of both proteins, suggesting a potential endogenous interaction between MIRO‐1 and VDAC‐1 (Fig 4D and E). This finding is consistent with a previous report in Drosophila that VDAC‐1 interacts with MIRO‐1 (Lee et al, 2016). To validate their interaction, we performed in vitro Co‐IP using purified GST::MIRO‐1 and VDAC‐1::His fusion proteins, confirming their interaction (Fig 4F and G). Protein crosslinking and Blue‐Native (BN)–PAGE analysis of the protein complex in GFP::MIRO‐1 (KI) transgenic animals further validate the interaction between MIRO‐1 and VDAC‐1, showing the formation of a high molecular weight protein complex by GFP and VDAC‐1 antibodies (Fig 4H). Together, these results suggest that MIRO‐1 and VDAC‐1 may form a complex in vivo.
We then performed a truncation analysis to determine the domain of MIRO‐1 responsible for its interaction with VDAC‐1. We found that a GFP::MIRO‐1 variant lacking the transmembrane (TM) domain could still pulldown VDAC‐1 (Fig EV4F), suggesting that the TM domain is not essential for the interaction. Co‐IP results further showed that VDAC‐1 could interact with the C‐terminal domain of MIRO‐1 but not the N‐terminal domain (Fig EV4G). This suggests that the C‐terminal domain of MIRO‐1 is responsible for its interaction with VDAC‐1.
VDAC‐1 negatively regulates ΔΨm in vivo
We then investigated the effect of VDAC‐1 on ΔΨm by RNAi knockdown and overexpression experiments. Knockdown of vdac‐1 led to a significant increase in the TMRE signal, while overexpression of vdac‐1 cDNA in the epidermis reduced the TMRE signal (Fig 5A and B), indicating that VDAC‐1 negatively regulates ΔΨm. These results are consistent with the previous report (Tomasello et al, 2009). To validate this result, we generated vdac‐1 mutants using the CRISPR‐Cas9 genome editing tool (Fig 5C). Despite VDAC‐1 being identified as essential for animal survival (Uozumi et al, 2015), we obtained a vdac‐1 (zju247) survival mutant with a frameshift mutation of a two‐nucleotide insertion in exon 2, which likely disrupted VDAC‐1 function in vivo (Fig 5C). Consistent with the RNAi knockdown results, vdac‐1(zju247) mutants displayed elevated TMRE signals in vivo (Fig 5A and B) and increased JC‐1 staining in isolated mitochondria (Fig 5D). In addition, the ATP content was significantly increased in mitochondria isolated from vdac‐1(zju247) mutants (Fig 5E). These results provide further evidence that VDAC‐1 is involved in the regulation of ΔΨm.
Figure 5. VDAC‐1 negatively regulates ΔΨm in vivo .
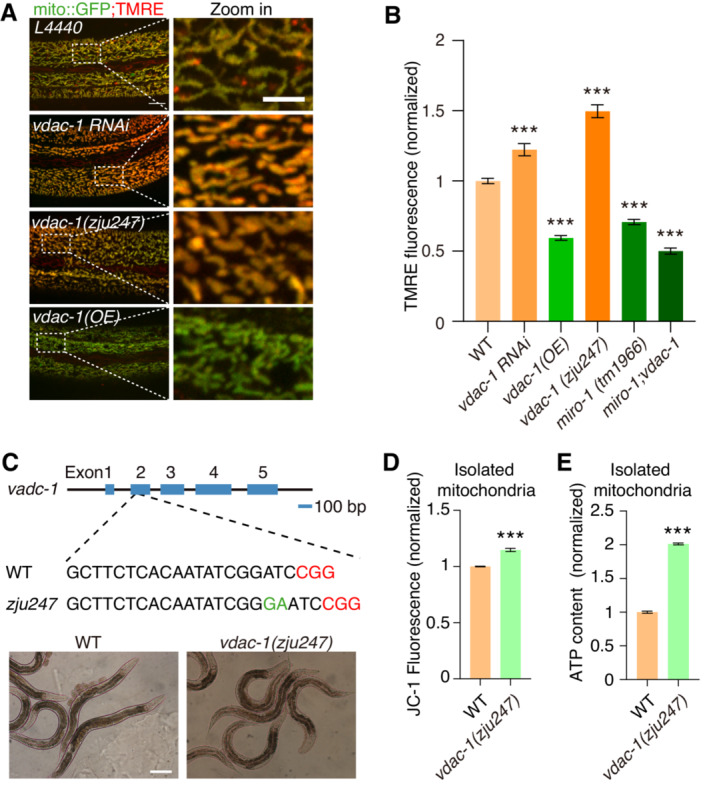
- Representative confocal images showing TMRE staining and mito::GFP in L4440, vdac‐1 RNAi, vdac‐1(zju247), and vdac‐1 OE animals.
- Quantitation of TMRE and mito::GFP signal in WT, vdac‐1 RNAi, vdac‐1 (OE, overexpression), vdac‐1(zju247), miro‐1(tm1966) and miro‐1;vdac‐1 double mutant animals (normalized ratio of TMRE fluorescence to mito::GFP fluorescence). n > 200 mitochondria.
- Schematic of the vdac‐1 transgene by CRISPR‐Cas9 method. The images below show the young adult stage worms of WT and vdac‐1(zju247) mutants.
- Quantitation of ΔΨm in crude isolated mitochondria from WT and vdac‐1(zju247) mutants (ratio of JC‐1 stain red fluorescence to green fluorescence). n = 3, biological replicates.
- ATP content in crude isolated mitochondria of WT animals and vdac‐1(zju247) mutants. Quantification is conducted with a commercial luminescence kit. n = 3, biological replicates.
Data information: Data are shown as the mean ± SEM. ***P < 0.001 (one‐way ANOVA test for multiple comparisons). Scale bars, 10 and 5 μm (zoom in).
MIRO‐1 interacts with VDAC‐1 via residues of E473 in MIRO‐1 and K163 in VDAC‐1
We then utilized AlphaFold 2, a deep‐learning‐based protein structure prediction tool (Tunyasuvunakool et al, 2021), to identify the specific residue(s) critical for MIRO‐1–VDAC‐1 interaction. AlphaFold 2 predicted that E473 in MIRO‐1 and K163 in VDAC‐1 are key residues for the interaction (Fig 6A). To validate this prediction, we introduced mutations in MIRO‐1(E473G) and VDAC‐1(K163G), which exhibited diminished interactions with VDAC‐1 and MIRO‐1, respectively (Fig EV5A and B). Co‐IP analysis showed that the interaction between MIRO‐1 and VDAC‐1 was diminished in miro‐1(E473G) mutant animals (Fig 6B). Moreover, 2D SDS–PAGE analysis showed partial co‐migrate of MIRO‐1 and VDAC‐1 in the same high molecular weight (MW) band, while mutation of E473G reduced the VDAC‐1 signal in this putative complex (Fig 6C).
Figure 6. MIRO‐1–VDAC‐1 interaction depends on E473 in MIRO‐1 and regulates VDAC‐1 activity.
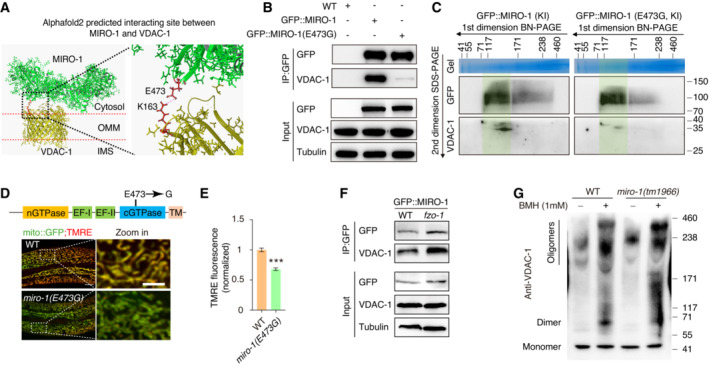
- Cartoon representations of the predicted interaction between MIRO‐1 and VDAC‐1 were E473 of MIRO‐1 and K163 of VDAC‐1.
- Immunoprecipitation of GFP::MIRO‐1 and GFP::MIRO‐1(E473G) with GFP nanobody‐conjugated beads.
- First‐dimension BN–PAGE and second‐dimension SDS–PAGE analysis of total worm lysate of GFP::MIRO‐1 (KI) and GFP::MIRO‐1 (E473G, KI) by GFP and VDAC‐1 antibodies.
- Representative confocal images showing TMRE staining and mito::GFP fluorescence in WT animals and miro‐1(E473G) mutants.
- Quantitation of TMRE and mito::GFP signal. n > 200 mitochondria.
- Immunoprecipitation of GFP::MIRO‐1 in fzo‐1 mutants with GFP nanobody‐conjugated beads. The interaction between GFP::MIRO‐1 and VDAC‐1 is increased in fzo‐1 mutants.
- BN–PAGE and immunoblot analysis of VDAC‐1 oligomerization crosslinked with BMH in WT and miro‐1(tm1966) mutants using VDAC‐1 antibody.
Data information: Data are shown as the mean ± SEM. ***P < 0.001 (unpaired t‐test). Scale bars, 10 and 5 μm (zoom in).
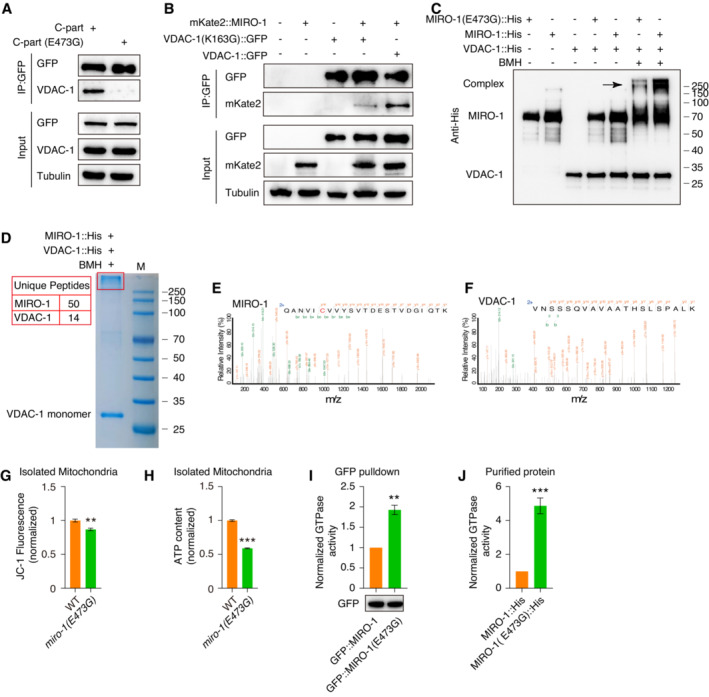
Figure EV5. The regulation of mitochondrial functions and GTPase activity by the interaction of MIRO‐1 and VDAC‐1.
-
AImmunoprecipitation of GFP::MIRO‐1 C‐part and GFP::MIRO‐1 C‐part(E473G), respectively, by GFP nanobody‐conjugated beads.
-
BImmunoprecipitation of VDAC‐1::GFP and VDAC‐1(K163G)::GFP with mKate2::MIRO‐1 using GFP nanobody‐conjugated beads.
-
CImmunoblot analysis of purified MIRO‐1::His, MIRO‐1 (E473G)::His, and VDAC‐1::His proteins after BMH crosslinking by His antibody. The black arrow indicates the potential bands of the MIRO‐1–VDAC‐1 interaction complex.
-
D‐FCoomassie brilliant blue staining of MIRO‐1 and VDAC‐1 proteins after BMH crosslinking. The high molecular weight is indicated by a red box and cut for protein identification by MS in (E and F). Fifty unique peptides of MIRO‐1 and 14 unique peptides of VDAC‐1 were identified.
-
GQuantification of ΔΨm in crude isolated mitochondria from WT and miro‐1(E473G) mutants (ratio of JC‐1 stain red fluorescence to green fluorescence). n = 3, biological replicates.
-
HATP content in crude isolated mitochondria of WT animals and miro‐1(E473G) mutants. Quantification is conducted with a commercial luminescence kit. n = 3, biological replicates.
-
IMIRO‐1 GTPase activity analysis after GFP beads pulldown in GFP::MIRO‐1 and GFP::MIRO‐1(E473G) worms were measured by GTPase assay kit. GFP expressions were measured as a normalized control. n = 3, biological replicates.
-
JGTPase activity analysis of purified MIRO‐1::His and MIRO‐1(E473G)::His were measured by GTPase assay kit. Protein concentrations were measured as a normalized control. n = 3, technical replicates.
Data information: Data are shown as the mean ± SEM. **P < 0.01, ***P < 0.001 (unpaired t‐test).
To determine whether MIRO‐1 and VDAC‐1 could form a protein complex, we treated the two proteins with a BMH crosslinker and found a high MW complex formed of MIRO‐1 and VDAC‐1 (lane 7) (Fig EV5C). In contrast, MIRO‐1 (E473G) variant showed a decreased capacity to form a protein complex with VDAC‐1 (lane 6) (Fig EV5C). We further analyzed the high MW complex by MS (Fig EV5D), which showed that this complex contained both MIRO‐1 and VDAC‐1 (Fig EV5E and F). Together, these findings demonstrate that MIRO‐1 interacts with VDAC‐1, and the MIRO‐1 E473 residue may be crucial for complex formation.
We next determined whether the MIRO‐1–VDAC‐1 interaction is important for regulating ΔΨm. miro‐1(E473G) mutant animals showed decreased TMRE staining in the epidermal cell (Fig 6D and E), reduced JC‐1 staining in isolated mitochondria (Fig EV5G), and lower ATP content (Fig EV5H), indicating a reduction in ΔΨm. As the E473 residue is located in the GTPase domain of MIRO‐1, it is plausible that the mutation may reduce GTPase activity to interfere with MIRO‐1 function, as well as lead to a reduction of ΔΨm. However, intriguingly, we detected an increased GTPase activity of MIRO‐1(E473G) compared with WT, using a GTPase activity assay (Fig EV5I and J). These results suggest the reduced ΔΨm in miro‐1(E473G) was not due to the disrupted GTPase activity but rather due to a reduced interaction between MIRO‐1 and VDAC‐1. Furthermore, we found that the interaction between MIRO‐1 and VDAC‐1 appeared to be stronger in fzo‐1 mutants than WT (Fig 6F), supporting the notion that increased interactions between MIRO‐1 and VDAC‐1 might help to maintain ΔΨm in fragmented mitochondria.
Finally, we investigated how the interaction between VDAC‐1 and MIRO‐1 affects ΔΨm. It is known that when mitochondria are damaged, VDAC‐1 may form oligomers resulting in ΔΨm collapse and ATP depletion (Shoshan‐Barmatz et al, 2010; Kim et al, 2019; Nagakannan et al, 2019). We thus determined whether MIRO‐1 interacts with VDAC‐1 and affects its oligomerization by conducting a BN–PAGE analysis. Our finding showed that VDAC‐1 formed oligomers, and the oligomers in miro‐1(tm1966) mutant was even stronger than in WT (Fig 6G). This result suggests that the loss of MIRO‐1 function led to increased VDAC‐1 oligomerization, which might in turn increase VDAC‐1 channel activity, ultimately leading to a reduction in ΔΨm.
Discussion
Our study demonstrated that MIRO‐1 is enriched in individual fragmented mitochondria in a stochastic manner, contributing to ΔΨm maintenance in fzo‐1 mutants and wounded animals. Mechanistically, our results suggest the importance of the interaction between MIRO‐1 and VDAC‐1 in regulating ΔΨm, possibly through its impact on the channel activity of VDAC‐1 via oligomerization, and ultimately affecting ΔΨm. Further investigation into the structure and mechanism of MIRO‐1–VDAC‐1 interaction could offer valuable insights into regulating VDAC‐1 channel activity and ΔΨm.
It has long been puzzled that knockout mutants of mitochondrial fusion genes exhibit mitochondrial fragmentation, yet they do not experience lethality at the organismal level. This phenomenon has been observed in various organisms, including C. elegans and Drosophila. Interestingly, a previous study showed that knocking out MFN1/2 in MEF cells resulted in the stochastic loss of normal ΔΨm in most fragmented mitochondria, whereas other mitochondria maintained normal ΔΨm (Chen et al, 2005). Our study discovered that MIRO‐1 stochastically accumulates in individual fragmented mitochondria, providing a possible molecular basis for ΔΨm maintenance and protection against excessive damage caused by mitochondrial fragmentation.
Mitochondrial dynamics are primarily regulated by fusion and fission, which are mediated by dynamin‐related proteins (DRP‐1) and MFN1/2 (Sabouny & Shutt, 2020). Various stressors can cause immediate mitochondrial fragmentation, and for example, wounding‐induced mitochondrial fragmentation is dependent on MIRO‐1 in C. elegans and DRP‐1 in Drosophila (Fu et al, 2020; Ponte et al, 2020). MIRO‐1 is also required for Ca2+ transient‐induced mitochondrial fission (Nemani et al, 2018). In this study, we found that mitochondrial fragmentation caused by a genetic mutation or wounding, resulted in elevated expression of miro‐1. This indicates that there may be positive feedback regulation between mitochondrial fragmentation and MIRO‐1, whereby mitochondrial fragmentation induces miro‐1 expression, and MIRO‐1 contributes to the maintenance of normal mitochondrial activity and energy production. However, the mechanisms by which mitochondrial fragmentation induces miro‐1 expression, and how MIRO‐1 becomes specifically elevated in individual mitochondria remain to be elucidated.
MIRO‐1 is a mitochondrial Rho GTPase that regulates mitochondrial transportation, particularly in neuron cells (Smith et al, 2020; Davis et al, 2023). Its GTPase domain contains the E473 residue responsible for its interaction with VDAC‐1. However, the mutation of E473G led to an increase, rather than a reduction, in the GTPase activity of MIRO‐1. The implications of this enhanced GTPase activity for the normal function of MIRO‐1 and the underlying mechanism of E473G in regulating GTPase activity are not understood. Nevertheless, this unexpected finding supports the notion that the interaction between MIRO‐1 and VDAC‐1 is crucial for the regulation of ΔΨm and mitochondrial activity in general. Further investigation is needed to determine whether the MIRO‐1–VDAC‐1 interaction has a negative effect on the MIRO‐1 GTPase activity.
Previous studies have shown that free tubulin can modify VDAC‐1 conductance to regulate ΔΨm and OMM permeability (Maldonado et al, 2010; Rovini, 2019). While structure analysis has suggested that a conformational change in the VDAC‐1 N‐terminal α‐helix regulates channel conductance through the structure analysis (Geula et al, 2012), our biochemical data suggest that the interaction between MIRO‐1 and VDAC‐1 may represent an additional mechanism for modulating channel activity. The precise mechanism through which MIRO‐1–VDAC‐1 regulates ΔΨm is likely to be intricate. Nevertheless, determining the structure of the MIRO‐1–VDAC‐1 complex and uncovering its underlying molecular mechanisms may offer novel insights into the regulation of mitochondrial dysfunction and the treatment of mitochondrial‐related diseases.
Materials and Methods
Constructs and transgenic animals
Extrachromosomal array transgenes were generated by injecting gene constructs at a concentration of 10 ng/ul, along with a co‐injection marker (Pttx‐3‐RFP) at 50 ng/ul. To label epidermal mitochondria, we fused the mitochondrial target sequence to GFP or mKate2 under the control of hpy‐7 or col‐19 promoters. We created single‐copy insertions of zjuSi90(Pcol‐19‐bio‐pup) and zjuSi268(Pcol‐19‐VDAC‐1::GFP) using a CRISPR‐Cas9‐based insertion method as previously reported (Xu et al, 2016). For a comprehensive list of new transgenic strains and constructs, refer to Tables EV1 and EV2.
CRISPR‐Cas9 mediated mutagenesis
miro‐1 and vdac‐1 mutagenesis was performed by the CRISPR‐Cas9 genome editing system as previously described (Uozumi et al, 2015; Fu et al, 2020). Briefly, a mixture of plasmids containing pSX2003 (pU6‐BseRI‐BseRI‐sgRNA‐vdac‐1) at a concentration of 50 ng/μl and pSX524 (Peft‐3‐cas9‐NLS‐pU6‐dpy‐10 sgRNA) at a concentration of 50 ng/μl was injected into N2 animals. PCR and DNA sequencing were used to screen frameshift mutations, and the animals were outcrossed to WT at least two times before analysis. All sgRNA sequences are listed in Table EV3.
TMRE staining and analysis
TMRE (Thermo Fisher, T669, USA) was added to the bacterial lawn from a 10 mM stock to a final concentration of 5 μM and dried for 2–3 h at room temperature. L4 stage animals were transferred to the bacterial lawn and imaged using a spinning disk confocal (Nikon Plan Apo 100 X/1.40) when they reached the young adult stage. To calculate the overall normalized TMRE fluorescent, we determined the ratio of TMRE (Red) to mito::GFP (Green) fluorescence. The WT group was normalized to 1.0.
Correlation analysis
Single‐plane images were analyzed using ImageJ software. A region of interest (ROI) (1,000 × 1,000 pixels) was selected for analysis, and the background intensity was used as a threshold. We utilized the “Analyze Particles” function to automatically quantify the fluorescence intensity and mitochondrial size, with a minimum size of 0.16 square micrometers. The values of intensity and size were then automatically calculated and analyzed using the Spearman's rank correlation coefficient in GraphPad software.
Mitochondrial isolation
Approximately 10,000 animals were manually collected, washed with 10 ml M9 buffer 3 times, and resuspended in mitochondrial isolation buffer (200 mM Mannitol, 50 mM Sucrose, 10 mM KCl, 1 mM EDTA, 10 mM HEPES‐KOH (pH 7.4), 0.1% BSA and supplemented with protease inhibitors (Bimake, B14002, USA)). The animals were then transferred into a 5‐ml Dounce homogenizer on ice and homogenized with 20 gentle strokes. The resulting homogenate was centrifuged at 1,000 g for 10 min, and the supernatant was collected. The supernatant was then centrifuged at 12,000 g for 10 min, after which the supernatant was removed, and the crude mitochondria were found in the pellet.
JC‐1 staining and analysis
The isolated mitochondria were resuspended in a mitochondrial isolation buffer containing diluted JC‐1 staining dye (Beyotime, C2005, China) for 15 min. The mitochondria were then washed three times before being transferred to a 96‐well black plate with a clear bottom for detection of red fluorescence (Ex: 550, Em: 600) and green fluorescence (Ex: 485, Em: 535). The ratio of red fluorescence to green fluorescence was calculated as ΔΨm and with the control group normalized to 1.0.
ATP content determination
The isolated mitochondria were resuspended in ATP reagent (Promega, G7570) and incubated at 37°C for 10 min. The resuspended mitochondria were then transferred to a 96‐well white plate with a clear bottom for luminescence detection. The control group was normalized to 1.0.
Wounding
The animals were wounded either using a Micropoint UV laser or by stabs made with a microinjection needle to the anterior or posterior young adult body as described previously. Prior to living imaging, the GFP::miro‐1(zju21) strain was subjected to needle wounding. Mitochondrial images were captured using a spinning disk confocal (Andor 100X, NA1.46 objective with IQ CORE image software).
Fluorescence visualization and line scan
The animals were immobilized on 4% agarose pads in 12 mM levamisole and imaged using a spinning disk confocal microscope before and after wounding. Green fluorescence was visualized with a 488 nm laser, and red fluorescence was visualized with a 561 nm laser. The fluorescence signals of line scans at different sections of the mitochondria were obtained using the “Plot Profiles” tool in ImageJ.
RNAi knockdown in worms
RNA interference was performed as previously described (Xu & Chisholm, 2011). Briefly, synchronized worms were cultured in NGM plates with HT115 E. coli at 20°C. The worms were then transferred to the same NGM plates supplemented with TMRE until L4 stage for further experiments.
RNA isolation and qPCR
Total RNA was extracted from 50 to 100 young adult animals using TRizol (Invitrogen, 15596‐026, USA). The cDNA was synthesized using the HiScript II Q RT SuperMix for qPCR (+gDNA wiper) (Vyzame, R223‐01, China). SYBR Green Supermix (Vazyme, Q711‐02, China) was used for qPCR amplification of the target gene with rbd‐1 as a control.
PafA fusion protein knock‐in
The PafA and Pcol‐19‐Bio‐Pup plasmids were obtained from Dr. Min Zhuang and designed as previously described (Liu et al, 2018). The PafA::miro‐1(zju206) knock‐in worms were generated using the CRISPR‐Cas9 method. Briefly, miro‐1 homology repair templates were cloned within the pDD282 plasmid using Gibson assembly (Dickinson et al, 2015). The repair templates (50 ng/μl) were co‐injected into WT animals with sgRNA(30 ng/μl). Peft‐3‐Cas9‐NLS‐pU6‐dpy‐10 sgRNA (50 ng/μl) as the selection marker, and co‐injection markers, including pSX424 (Pmyo‐3‐cherry) at 5 ng/μl, pSX375 (Pmyo‐2‐cherry) at 2.5 ng/μl, and pSX379 (Prab‐3‐cherry) at 10 ng/μl. The knock‐in strain was confirmed by sequencing and outcrossed twice before use.
PUP‐IT sample preparation and mass spectrometry
We manually collected ~ 20,000 animals, washed them three times with 10 ml M9 buffer, and resuspended them in radioimmunoprecipitation assay (RIPA) buffer (20 mM Tris–HCl (pH 7.5), 150 mM NaCl, 1 mM Na2EDTA, 1 mM EGTA, 1% NP‐40, 1% sodium deoxycholate, 2.5 mM sodium pyrophosphate, 1 mM beta‐glycerophosphate, 1 mM Na3VO4, 1 μg/ml leupeptin (CST, 9806, USA)). The samples were sonicated four times for 4 s and then centrifuged at 12,000 g for 20 min. The supernatants were collected and incubated with the streptavidin‐conjugated beads (30 μl, Thermofisher, 434341, USA) for 2 h. The efficiency of PUP‐IT labeling was detected using silver staining and immunoblot, as previously described (Liu et al, 2018). The interaction proteins of MIRO‐1 were identified by LC–MS, which was performed by Jingjie PTM (Zhejiang, China). The proteins detected by MS are listed in Table EV4. Coomassie brilliant blue staining gel of purified MIRO‐1 and VDAC‐1 proteins with BMH was cut and analyzed using MS with the two proteins' specific peptides listed in Table EV5.
Immunoprecipitation and immunoblot
For in vivo co‐immunoprecipitation (co‐IP), ~ 20,000 animals were collected and washed three times with 10 ml M9 buffer and resuspended by RIPA buffer. The samples were sonicated four times for 4 s and centrifuged at 12,000 g for 20 min. The supernatants were collected and incubated with the IgG (nontargeted beads, 50 μl, Beyotime, P2171, China) for 15 min, followed by GFP nanobody‐conjugated beads (30 μl, KT Life technology, KTSM1301, China) for 1 h, or VDAC‐1 antibody (7 μg for each sample, Proteinteck, 55259, USA) conjugated beads (100 μl for each sample, Yeason, 10208ES, China) overnight. For in vitro co‐IP, GST::MIRO‐1 and VDAC‐1::His fusion proteins were mixed and incubated with IgG, GST‐beads, and His‐beads, respectively, for 30 min at room temperature. The samples were then blotted with primary antibodies, including anti‐GFP (1:2,500, MBL598, Japan), anti‐VDAC‐1 (1:2,000, Proteinteck, 55259, USA), anti‐RFP (1:1,000, Thermofisher, MA5‐15257, USA), anti‐streptavadin (1:1,000, Bioss, bs‐0437P, China), anti‐biotin (1:1,000, Bioss, bs‐0311R, China), anti‐His (1:2,000, Proteinteck, 66005, USA), anti‐GST (1:5,000, Proteinteck, 66001, USA), anti‐COX‐4 (1:2,000, Proteinteck, 11242, USA) or anti‐Tubulin (1:2,000, Huabio, EM0103, China), and detected them using the ChemiDoc Touch Imaging System (Bio‐Rad, 1708370, USA).
Protein purification
Caenorhabditis elegans MIRO‐11‐601 or MIRO‐1E473G coding sequence were subcloned into a modified pET21a(+) vector (C‐terminal 6 × His‐tag, Novagen). The optimized VDAC‐1 coding sequence was subcloned into a modified pET21b(+) vector (C‐terminal 6 × His‐tag, Novagen). The cells were lysed by sonication (SCIENTZ, JY92‐IIN China), and the supernatant was incubated with His‐tag purification resin (BeyoGold, P2233, Beyotime Biotechnology). Protein samples of MIRO‐1 or VDAC‐1 were loaded onto Superdex™ 200 increase10/300 GL (GE Healthcare, 28990944, USA) and eluted with Buffer A (25 mM HEPES at PH7.3, 150 mM NaCl, 0.5 mM MgCl2, 1 mM EGTA, 0.02% Tween) or Buffer B (2 mM LDAO contained PBS buffer), respectively. The eluted protein was stored at −80°C until further analysis. Additionally, GST‐tagged MIRO‐11‐601 protein was purified by GST‐tag purification resin (BeyoGold, P2251, Beyotime Biotechnology).
Blue‐Native (BN)–PAGE and 2D SDS–PAGE
The worms were gently lysed in 1 × NativePAGE sample buffer containing 1% DDM (Thermofisher, BN2008, USA). The lysates were crosslinked with crosslinker BMH (1 mM) and loaded onto a 3–12% Bis–Tris NativePAGE (Thermofisher, BN1001BOX, USA). The gels were then transferred to an NC membrane with 1 × NuPAGE Transfer Buffer (Thermofisher, NP0006, USA) and blocked with 5% BSA. For the second‐dimension (2D) SDS–PAGE, after the first dimension of BN–PAGE, the gel strips were reduced with 1 × NuPage Sample Reducing Agent (Thermofisher, NP0009, USA) for 15 min at room temperature. The gels were then immediately applied to the second dimension on a 10% SDS–PAGE and detected by GFP and VDAC‐1 antibodies.
GTPase activity
An in vivo MIRO‐1 GTPase activity assay was performed using a previously described protocol (Hu et al, 2020). Briefly, transgenic worms were lysed with 1% NP‐40 on ice. The GTPase activity was measured in the sample following GFP nanobody pulldown, per the manufacturer's protocol (Sigma, MAK113, USA). For the in vitro MIRO‐1 GTPase activity assay, the purified proteins were measured directly using GTPase activity assay Kit (Sigma, MAK113, USA). The protein concentration of each sample was determined, and the GTPase activity of different groups was normalized to the protein concentration of each sample.
Statistical analysis
All Data were analyzed using GraphPad Prism 9 (GraphPad Software Inc., San Diego, CA, USA). The Y‐axis error bar represents the Standard Error of the Mean (SEM). Student's t‐tests were used for comparisons between two groups, while one‐way ANOVA tests were used for multiple comparisons. Statistical significance was set at P < 0.05 and indicated with a single asterisk. Double asterisks indicated P < 0.01, and triple asterisks indicated P < 0.001, respectively.
Author contributions
Xuecong Ren: Conceptualization; resources; data curation; formal analysis; funding acquisition; validation; investigation; methodology; writing – original draft; project administration; writing – review and editing. Hengda Zhou: Conceptualization; resources; data curation; software; formal analysis; validation; investigation; methodology; writing – original draft. Yujie Sun: Investigation; methodology. Hongying Fu: Resources; data curation; software; investigation; methodology. Yu Ran: Data curation. Bing Yang: Validation. Fan Yang: Resources; software; formal analysis. Mikael Björklund: Writing – review and editing. Suhong Xu: Conceptualization; supervision; funding acquisition; validation; investigation; writing – original draft; project administration; writing – review and editing.
Disclosure and competing interest statement
The authors declare that they have no conflict of interest.
Supporting information
Expanded View Figures PDF
Table EV1
Table EV2
Table EV3
Table EV4
Table EV5
Movie EV1
PDF+
Acknowledgements
We thank Drs. Wei Liu, Qiming Sun, Yiting Zhou, and Ye Tian for their insightful discussion on the study. This work was supported by the National Key R&D Program of China (2021YFA1300302, 2021YFA1101002), the National Natural Science Foundation of China (31972891), and the Zhejiang Province Natural Science Foundation (LR21C120002) to SX, the National Nature Science Foundation of China (31900498), and the Postdoctoral Science Foundation of China (2019M662037) to XR. We thank C. Ma, L.Y. Wang from the Protein Facility and Imaging Center of Core Facility at Zhejiang University School of Medicine.
EMBO reports (2023) 24: e56297
Data availability
The datasets produced in this study are available in the following databases: https://www.iprox.cn/page/project.html?id=IPX0006080000, ProteomeXchange ID: PXD040748 (http://www.ebi.ac.uk/pride/archive/projects/PXD040748); Proteomics data: IPX0006080001; Gel identification data: IPX0006080004.
References
- Cai Q, Sheng ZH (2009) Moving or stopping mitochondria: Miro as a traffic cop by sensing calcium. Neuron 61: 493–496 [DOI] [PMC free article] [PubMed] [Google Scholar]
- Chen H, Detmer SA, Ewald AJ, Griffin EE, Fraser SE, Chan DC (2003) Mitofusins Mfn1 and Mfn2 coordinately regulate mitochondrial fusion and are essential for embryonic development. J Cell Biol 160: 189–200 [DOI] [PMC free article] [PubMed] [Google Scholar]
- Chen H, Chomyn A, Chan DC (2005) Disruption of fusion results in mitochondrial heterogeneity and dysfunction. J Biol Chem 280: 26185–26192 [DOI] [PubMed] [Google Scholar]
- Davis K, Basu H, Izquierdo‐Villalba I, Shurberg E, Schwarz TL (2023) Miro GTPase domains regulate the assembly of the mitochondrial motor‐adaptor complex. Life Sci Alliance 6: e202201406 [DOI] [PMC free article] [PubMed] [Google Scholar]
- De Stefani D, Bononi A, Romagnoli A, Messina A, De Pinto V, Pinton P, Rizzuto R (2012) VDAC1 selectively transfers apoptotic Ca2+ signals to mitochondria. Cell Death Differ 19: 267–273 [DOI] [PMC free article] [PubMed] [Google Scholar]
- Dickinson DJ, Pani AM, Heppert JK, Higgins CD, Goldstein B (2015) Streamlined genome engineering with a self‐excising drug selection cassette. Genetics 200: 1035–1049 [DOI] [PMC free article] [PubMed] [Google Scholar]
- Frederick RL, McCaffery JM, Cunningham KW, Okamoto K, Shaw JM (2004) Yeast Miro GTPase, Gem1p, regulates mitochondrial morphology via a novel pathway. J Cell Biol 167: 87–98 [DOI] [PMC free article] [PubMed] [Google Scholar]
- Frezza C, Cipolat S, Martins de Brito O, Micaroni M, Beznoussenko GV, Rudka T, Bartoli D, Polishuck RS, Danial NN, De Strooper B et al (2006) OPA1 controls apoptotic cristae remodeling independently from mitochondrial fusion. Cell 126: 177–189 [DOI] [PubMed] [Google Scholar]
- Fu H, Zhou H, Yu X, Xu J, Zhou J, Meng X, Zhao J, Zhou Y, Chisholm AD, Xu S (2020) Wounding triggers MIRO‐1 dependent mitochondrial fragmentation that accelerates epidermal wound closure through oxidative signaling. Nat Commun 11: 1050 [DOI] [PMC free article] [PubMed] [Google Scholar]
- Geula S, Ben‐Hail D, Shoshan‐Barmatz V (2012) Structure‐based analysis of VDAC1: N‐terminus location, translocation, channel gating and association with anti‐apoptotic proteins. Biochem J 444: 475–485 [DOI] [PubMed] [Google Scholar]
- Guo X, Macleod GT, Wellington A, Hu F, Panchumarthi S, Schoenfield M, Marin L, Charlton MP, Atwood HL, Zinsmaier KE (2005) The GTPase dMiro is required for axonal transport of mitochondria to drosophila synapses. Neuron 47: 379–393 [DOI] [PubMed] [Google Scholar]
- Horn A, Raavicharla S, Shah S, Cox D, Jaiswal JK (2020) Mitochondrial fragmentation enables localized signaling required for cell repair. J Cell Biol 219: e201909154 [DOI] [PMC free article] [PubMed] [Google Scholar]
- Hu Q, Zhang H, Gutierrez Cortes N, Wu D, Wang P, Zhang J, Mattison JA, Smith E, Bettcher LF, Wang M et al (2020) Increased Drp1 acetylation by lipid overload induces cardiomyocyte death and heart dysfunction. Circ Res 126: 456–470 [DOI] [PMC free article] [PubMed] [Google Scholar]
- Ichishita R, Tanaka K, Sugiura Y, Sayano T, Mihara K, Oka T (2008) An RNAi screen for mitochondrial proteins required to maintain the morphology of the organelle in Caenorhabditis elegans . J Biochem 143: 449–454 [DOI] [PubMed] [Google Scholar]
- Kanazawa T, Zappaterra MD, Hasegawa A, Wright AP, Newman‐Smith ED, Buttle KF, McDonald K, Mannella CA, van der Bliek AM (2008) The C. elegans Opa1 homologue EAT‐3 is essential for resistance to free radicals. PLoS Genet 4: e1000022 [DOI] [PMC free article] [PubMed] [Google Scholar]
- Kim J, Gupta R, Blanco LP, Yang S, Shteinfer‐Kuzmine A, Wang K, Zhu J, Yoon HE, Wang X, Kerkhofs M et al (2019) VDAC oligomers form mitochondrial pores to release mtDNA fragments and promote lupus‐like disease. Science 366: 1531–1536 [DOI] [PMC free article] [PubMed] [Google Scholar]
- Knott AB, Perkins G, Schwarzenbacher R, Bossy‐Wetzel E (2008) Mitochondrial fragmentation in neurodegeneration. Nat Rev Neurosci 9: 505–518 [DOI] [PMC free article] [PubMed] [Google Scholar]
- Lee S, Lee KS, Huh S, Liu S, Lee DY, Hong SH, Yu K, Lu B (2016) Polo kinase phosphorylates Miro to control ER‐mitochondria contact sites and mitochondrial Ca(2+) homeostasis in neural stem cell development. Dev Cell 37: 174–189 [DOI] [PMC free article] [PubMed] [Google Scholar]
- Lipper CH, Stofleth JT, Bai F, Sohn YS, Roy S, Mittler R, Nechushtai R, Onuchic JN, Jennings PA (2019) Redox‐dependent gating of VDAC by mitoNEET. Proc Natl Acad Sci U S A 116: 19924–19929 [DOI] [PMC free article] [PubMed] [Google Scholar]
- Liu Q, Zheng J, Sun W, Huo Y, Zhang L, Hao P, Wang H, Zhuang M (2018) A proximity‐tagging system to identify membrane protein‐protein interactions. Nat Methods 15: 715–722 [DOI] [PubMed] [Google Scholar]
- Maldonado EN, Patnaik J, Mullins MR, Lemasters JJ (2010) Free tubulin modulates mitochondrial membrane potential in cancer cells. Cancer Res 70: 10192–10201 [DOI] [PMC free article] [PubMed] [Google Scholar]
- Modi S, Lopez‐Domenech G, Halff EF, Covill‐Cooke C, Ivankovic D, Melandri D, Arancibia‐Carcamo IL, Burden JJ, Lowe AR, Kittler JT (2019) Miro clusters regulate ER‐mitochondria contact sites and link cristae organization to the mitochondrial transport machinery. Nat Commun 10: 4399 [DOI] [PMC free article] [PubMed] [Google Scholar]
- Monaco G, Decrock E, Arbel N, van Vliet AR, La Rovere RM, De Smedt H, Parys JB, Agostinis P, Leybaert L, Shoshan‐Barmatz V et al (2015) The BH4 domain of anti‐apoptotic Bcl‐XL, but not that of the related Bcl‐2, limits the voltage‐dependent Anion Channel 1 (VDAC1)‐mediated transfer of pro‐apoptotic Ca2+ signals to mitochondria. J Biol Chem 290: 9150–9161 [DOI] [PMC free article] [PubMed] [Google Scholar]
- Nagakannan P, Islam MI, Karimi‐Abdolrezaee S, Eftekharpour E (2019) Inhibition of VDAC1 protects against glutamate‐induced Oxytosis and mitochondrial fragmentation in hippocampal HT22 cells. Cell Mol Neurobiol 39: 73–85 [DOI] [PMC free article] [PubMed] [Google Scholar]
- Nemani N, Carvalho E, Tomar D, Dong Z, Ketschek A, Breves SL, Jana F, Worth AM, Heffler J, Palaniappan P et al (2018) MIRO‐1 determines mitochondrial shape transition upon GPCR activation and Ca(2+) stress. Cell Rep 23: 1005–1019 [DOI] [PMC free article] [PubMed] [Google Scholar]
- Nguyen TT, Oh SS, Weaver D, Lewandowska A, Maxfield D, Schuler MH, Smith NK, Macfarlane J, Saunders G, Palmer CA et al (2014) Loss of Miro1‐directed mitochondrial movement results in a novel murine model for neuron disease. Proc Natl Acad Sci USA 111: E3631–E3640 [DOI] [PMC free article] [PubMed] [Google Scholar]
- Perry SW, Norman JP, Barbieri J, Brown EB, Gelbard HA (2011) Mitochondrial membrane potential probes and the proton gradient: a practical usage guide. Biotechniques 50: 98–115 [DOI] [PMC free article] [PubMed] [Google Scholar]
- Ponte S, Carvalho L, Gagliardi M, Campos I, Oliveira PJ, Jacinto A (2020) Drp1‐mediated mitochondrial fission regulates calcium and F‐Actin dynamics during wound healing. Biol Open 9: bio048629 [DOI] [PMC free article] [PubMed] [Google Scholar]
- Rovini A (2019) Tubulin‐VDAC interaction: molecular basis for mitochondrial dysfunction in chemotherapy‐induced peripheral neuropathy. Front Physiol 10: 671 [DOI] [PMC free article] [PubMed] [Google Scholar]
- Sabouny R, Shutt TE (2020) Reciprocal regulation of mitochondrial fission and fusion. Trends Biochem Sci 45: 564–577 [DOI] [PubMed] [Google Scholar]
- Sander P, Gudermann T, Schredelseker J (2021) A calcium guard in the outer membrane: is VDAC a regulated gatekeeper of mitochondrial calcium uptake? Int J Mol Sci 22: 946 [DOI] [PMC free article] [PubMed] [Google Scholar]
- Shoshan‐Barmatz V, Keinan N, Abu‐Hamad S, Tyomkin D, Aram L (2010) Apoptosis is regulated by the VDAC1 N‐terminal region and by VDAC oligomerization: release of cytochrome c, AIF and Smac/diablo. Biochim Biophys Acta 1797: 1281–1291 [DOI] [PubMed] [Google Scholar]
- Shoshan‐Barmatz V, Krelin Y, Shteinfer‐Kuzmine A (2018) VDAC1 functions in Ca(2+) homeostasis and cell life and death in health and disease. Cell Calcium 69: 81–100 [DOI] [PubMed] [Google Scholar]
- Smith KP, Focia PJ, Chakravarthy S, Landahl EC, Klosowiak JL, Rice SE, Freymann DM (2020) Insight into human Miro1/2 domain organization based on the structure of its N‐terminal GTPase. J Struct Biol 212: 107656 [DOI] [PMC free article] [PubMed] [Google Scholar]
- Tomasello F, Messina A, Lartigue L, Schembri L, Medina C, Reina S, Thoraval D, Crouzet M, Ichas F, De Pinto V et al (2009) Outer membrane VDAC1 controls permeability transition of the inner mitochondrial membrane in cellulo during stress‐induced apoptosis. Cell Res 19: 1363–1376 [DOI] [PubMed] [Google Scholar]
- Tunyasuvunakool K, Adler J, Wu Z, Green T, Zielinski M, Zidek A, Bridgland A, Cowie A, Meyer C, Laydon A et al (2021) Highly accurate protein structure prediction for the human proteome. Nature 596: 590–596 [DOI] [PMC free article] [PubMed] [Google Scholar]
- Uozumi T, Hamakawa M, Deno YK, Nakajo N, Hirotsu T (2015) Voltage‐dependent anion channel (VDAC‐1) is required for olfactory sensing in Caenorhabditis elegans . Genes Cells 20: 802–816 [DOI] [PubMed] [Google Scholar]
- Wang X, Schwarz TL (2009) The mechanism of Ca2+ −dependent regulation of kinesin‐mediated mitochondrial motility. Cell 136: 163–174 [DOI] [PMC free article] [PubMed] [Google Scholar]
- Xu S, Chisholm AD (2014) C. elegans epidermal wounding induces a mitochondrial ROS burst that promotes wound repair. Dev Cell 31: 48–60 [DOI] [PMC free article] [PubMed] [Google Scholar]
- Xu S, Chisholm AD (2011) A Gαq‐Ca2+ signaling pathway promotes Actin‐mediated epidermal wound closure in C. elegans . Curr Biol 21: 1960–1967 [DOI] [PMC free article] [PubMed] [Google Scholar]
- Xu S, Wang Z, Kim KW, Jin Y, Chisholm AD (2016) Targeted mutagenesis of duplicated genes in Caenorhabditis elegans using CRISPR‐Cas9. J Genet Genomics 43: 103–106 [DOI] [PMC free article] [PubMed] [Google Scholar]
- Youle RJ, van der Bliek AM (2012) Mitochondrial fission, fusion, and stress. Science 337: 1062–1065 [DOI] [PMC free article] [PubMed] [Google Scholar]
- Zhou B, Kreuzer J, Kumsta C, Wu L, Kamer KJ, Cedillo L, Zhang Y, Li S, Kacergis MC, Webster CM et al (2019) Mitochondrial permeability uncouples elevated autophagy and lifespan extension. Cell 177: 299–314.e16 [DOI] [PMC free article] [PubMed] [Google Scholar]
- Zorova LD, Popkov VA, Plotnikov EY, Silachev DN, Pevzner IB, Jankauskas SS, Babenko VA, Zorov SD, Balakireva AV, Juhaszova M et al (2018) Mitochondrial membrane potential. Anal Biochem 552: 50–59 [DOI] [PMC free article] [PubMed] [Google Scholar]
- Zuchner S, Mersiyanova IV, Muglia M, Bissar‐Tadmouri N, Rochelle J, Dadali EL, Zappia M, Nelis E, Patitucci A, Senderek J et al (2004) Mutations in the mitochondrial GTPase mitofusin 2 cause Charcot‐Marie‐tooth neuropathy type 2A. Nat Genet 36: 449–451 [DOI] [PubMed] [Google Scholar]