

Abstract
Skeletal muscle plays a key role in systemic energy homeostasis besides its contractile function, but what links these functions is poorly defined. Protein Arginine Methyl Transferase 5 (PRMT5) is a well‐known oncoprotein but also expressed in healthy tissues with unclear physiological functions. As adult muscles express high levels of Prmt5, we generated skeletal muscle‐specific Prmt5 knockout (Prmt5 MKO ) mice. We observe reduced muscle mass, oxidative capacity, force production, and exercise performance in Prmt5 MKO mice. The motor deficiency is associated with scarce lipid droplets in myofibers due to defects in lipid biosynthesis and accelerated degradation. Specifically, PRMT5 deletion reduces dimethylation and stability of Sterol Regulatory Element‐Binding Transcription Factor 1a (SREBP1a), a master regulator of de novo lipogenesis. Moreover, Prmt5 MKO impairs the repressive H4R3 symmetric dimethylation at the Pnpla2 promoter, elevating the level of its encoded protein ATGL, the rate‐limiting enzyme catalyzing lipolysis. Accordingly, skeletal muscle‐specific double knockout of Pnpla2 and Prmt5 normalizes muscle mass and function. Together, our findings delineate a physiological function of PRMT5 in linking lipid metabolism to contractile function of myofibers.
Keywords: lipid droplet, lipolysis, myofiber, posttranslational modification, protein arginine methyltransferase
Subject Categories: Metabolism
PRMT5 contributes to maintain overall energy homeostasis in skeletal muscle, and depletion of PRMT5 leads to a decline in muscle mass and functionality.

Introduction
Skeletal muscles cells (also called myofibers) are multinucleated contractile units that empower body movements and mobility. The skeletal muscle also plays a key role in systemic energy homeostasis through glucose disposal and fatty acid oxidation (FAO) (Chargé & Rudnicki, 2004; Bassel‐Duby & Olson, 2006). A progressive decline in skeletal muscle mass and function not only impairs exercise capacity but also increases the risks of metabolic disorders associated with cellular oxidative stress, mitochondrial dysfunction, and insulin resistance (Kim & Kim, 2020). Muscle atrophy, one of the most destructive features of muscular dysfunction, results from protein degradation that reduces muscle mass. Additionally, an oxidative‐to‐glycolytic conversion of myofibers renders them more prone to protein degradation, leading to nutrient‐related atrophy (Sandri, 2008; Bonaldo & Sandri, 2013; Wang & Pessin, 2013).
Intramyocellular lipid (IMCL) is a crucial energy source for FAO, serves as an important building block for cellular and organelle membranes, and generates bioactive metabolites that mediate various signaling pathways (Consitt et al, 2009; Morales et al, 2017). Intramyocellular lipid is typically stored in lipid droplets (LDs), cytoplasmic organelles that store and release lipids such as triglycerides (TAG). Dynamics of LDs are linked to a myriad of physiological and pathological processes (Welte & Gould, 2017; Olzmann & Carvalho, 2019; Seibert et al, 2020). Lipid droplet biogenesis is mediated by TAG‐synthesizing enzymes under the control of transcriptional factors such as SREBP1 (Hagen et al, 2010). Lipid droplet turnover is mediated by lipolysis that liberates fatty acids (FAs) from TAG for oxidation as a source of energy. The first and rate‐limiting step in lipolysis is catalyzed by adipose triglyceride lipase (ATGL, encoded by Pnpla2 gene) to hydrolyze TAG to generate a free FAs and DAG (diacylglycerols; Badin et al, 2012; Watt & Hoy, 2012). Dysfunctional ATGL‐mediated lipolysis in myofibers reduces the availability of FAs for energy conversion and impairs muscle function (Kim et al, 2008; Badin et al, 2012; Onal et al, 2017; Debashree et al, 2018). Conversely, increased ATGL activity is associated with muscle wasting in cancer cachexia (Das et al, 2011). Despite the known function of ATGL in skeletal muscle and muscle satellite cells (Sitnick et al, 2013; Dubé et al, 2015; Meex et al, 2015; Yue et al, 2022), what regulates lipid metabolism in the skeletal muscle is poorly understood.
Protein methylation, a common posttranslational modification (PTM) that results in the addition of methyl groups to lysine or arginine residues, has been involved in protein functional modulation, affecting signaling transduction and gene transcription (Lee et al, 2005; Ng et al, 2009; Moore et al, 2013; Murn & Shi, 2017). Protein arginine methyltransferases (PRMTs), composed of nine paralogs, can catalyze methylation of a broad range of substrates, including histone proteins (Lee et al, 2005; Guccione & Richard, 2019). Histone arginine methylation is associated with dynamic gene regulation, as chromatin structure remodeling either leads to activation or repression of targeted genes (Litt et al, 2009; di Lorenzo & Bedford, 2011). For example, symmetric dimethylation of histone 4 arginine 3 (H4R3Me2s) associated with several genes has been reported to underly pathogenesis of cancer (Ancelin et al, 2006; Wang et al, 2008; Deng et al, 2017). Recent studies have reported that PRMT1, PRMT4, PRMT7 regulates a variety of biological processes in the skeletal muscle (Wang et al, 2012; Jeong et al, 2016, 2020; Choi et al, 2019). Previous studies also reported that PRMT5 is indispensable for the proliferation and differentiation of myogenic progenitors and skeletal muscle regeneration (Dacwag et al, 2007; Zhang et al, 2015).
In this study, we characterized the function of PRMT5 in myofibers through Myl1 cre ‐driven knockout of Prmt5 (Prmt5 MKO ) in mice. The Prmt5 MKO mice exhibited reduced muscle mass and body weight along with impaired contractile function and motor performance. The Prmt5 MKO mice also contained an increased proportion of glycolytic myofibers and reduced proportion of oxidative myofibers. Molecular analysis revealed that PRMT5 promotes methylation of mSREBP1a (mature SREBP1a) in skeletal muscles to upregulate lipogenic genes. Moreover, PRMT5 epigenetically represses the transcription of Pnpla2 gene (encoding ATGL) via H4R3Me2s. Consistently, ablation of Pnpla2 gene in Prmt5 MKO mice (muscle‐specific Prmt5/Pnpla2 double KO) fully rescued the contractile phenotypes of the Prmt5 MKO mice. Collectively, these data establish a novel function of PRMT5 as a regulator of lipid metabolism in myofibers that subsequently affect muscle development and contractile function.
Results
Myofiber‐specific Prmt5 KO reduces muscle mass in adult mice
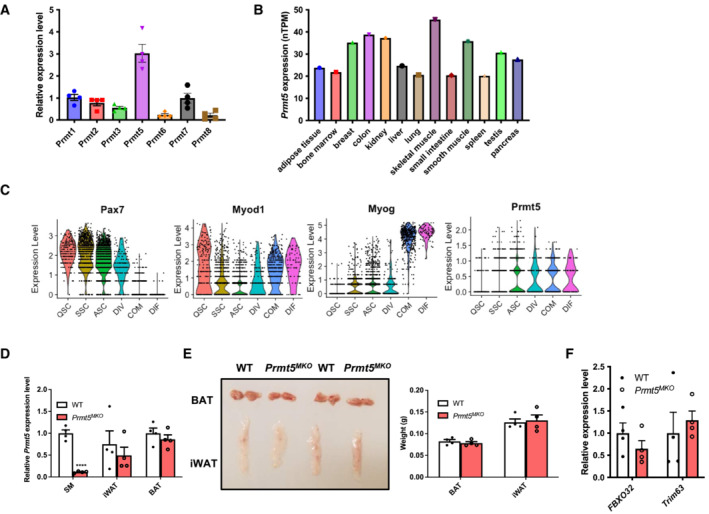
We first examined Prmt5 gene expression in postnatal hindlimb muscles. Among the seven PRMTs, mRNA level of Prmt5 was significantly higher than other isoforms (Fig EV1A). In addition, Prmt5 mRNA level in the skeletal muscle was the highest among various human tissues, though every tissue expressed Prmt5 abundantly (Fig EV1B; Uhlén et al, 2015). We also assessed the expression of Prmt5 during muscle satellite cell differentiation, using publicly available Tabula Muris and single‐cell RNA sequencing (scRNA‐seq) data (Yue et al, 2022), and found that only 8% of satellite cells have detectable levels of Prmt5, while the remainder 92% have undetectable level of Prmt5 (Appendix Fig S1). Violin plots clearly highlighted that Prmt5 expression is dramatically increased during differentiation correlated with MyoG expression (Fig EV1C). We therefore hypothesized that PRMT5 plays a key role in the postdifferentiation skeletal muscle. To test this hypothesis, we generated skeletal muscle specific Prmt5 knockout mice (abbreviated as Prmt5 MKO ) by crossing Prmt5 flox/flox mice with Myl1 cre knockin mice expressing Cre recombinase driven by the endogenous myosin light chain 1 (Myl1) gene. In this mouse model, the frameshift deletion of exon 7 causes a premature stop codon, resulting in a truncated protein of only 220 amino acids excluding all the key functional domain (Fig 1A). A specific reduction of Prmt5 in skeletal muscle was validated in Prmt5 MKO mice in comparison with WT mice (Fig EV1D).
Figure EV1. Specific Prmt5 deletion in myocytes in Prm5 MKO mice.
-
ARelative mRNA levels of Prmt isoforms from hindlimb muscles at postnatal day 4; (n = 4).
-
BPrmt5 mRNA levels across various human tissues.
-
CViolin plots showing the expression of Prmt5 and muscle satellite cell markers during differentiation.
-
DRelative mRNA expression of Prmt5 in skeletal muscle (SM), inguinal adipose tissue (iWAT), and brown adipose tissue (BAT) from WT and Prmt5 MKO mice; (n = 4, biological replicates).
-
ERepresentative images (left panel) and quantified weight (right panel) of non‐muscle tissue (iWAT and BAT) from WT and Prmt5 MKO mice; (n = 4, biological replicates).
-
Frelative expression level of Atrogin‐1 and MuRF‐1 (encoded by FBX032 and Trim63 gene) in skeletal muscles from WT and Prmt5 MKO mice; (n = 4, technical replicates).
Data information: The data are presented as mean ± SEM in (A, D, E, F). The P‐values by two‐tailed ANOVA unpaired t‐test are indicated in (D). The total number of biologically independent samples are indicated in (A, D, E, F). ASC, activated MuSCs; COM, committed MuSCs; DIF, differentiated MuSCs; DIV, dividing MuSCs; MuSCs, muscle satellite cells; QSC, quiescent MuSCs (****P < 0.0001).
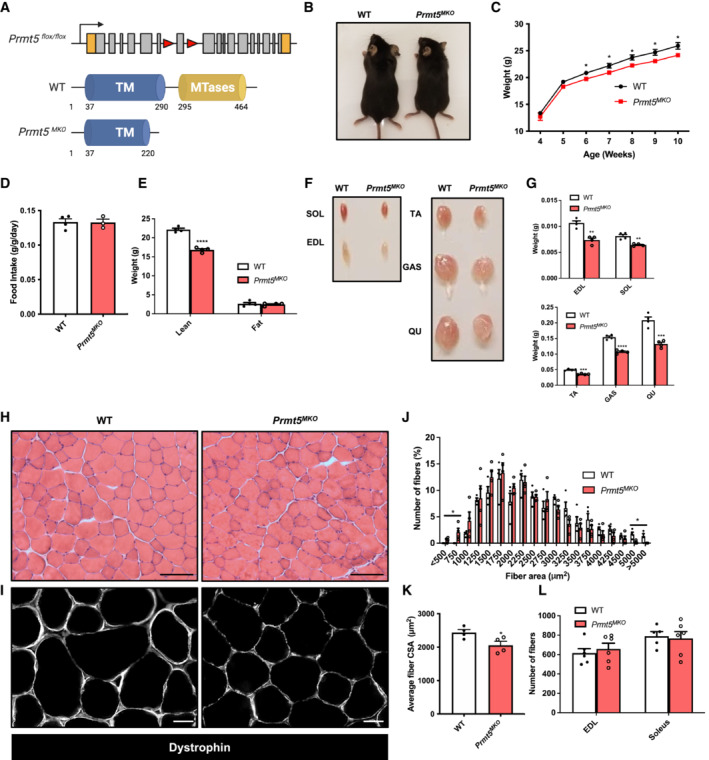
Figure 1. Muscle‐specific knockout of PRMT5 (Prmt5 MKO ) leads to muscle mass reduction.
-
AGenetic targeting strategy showing skeletal muscle‐specific deletion of Prmt5 using the Cre‐LoxP recombinase under the control of the Myl1 promoter.
-
B, CRepresentative images of 2‐month‐old mice (B) and growth curves (C) of WT (n = 6) and Prmt5 MKO mice (n = 6).
-
DFood intake normalized to body weight in WT (n = 4) and Prmt5 MKO mice (n = 3).
-
ELean and fat mass in WT (n = 4) and Prmt5 MKO mice (n = 4) determined by EcoMRI body composition analyzer.
-
FPhotographs of skeletal muscles in 2‐month‐old WT and Prm5 MKO mice.
-
GThe quantified weight of muscles (SOL, EDL, TA, GAS, QU) in 2‐month‐old WT (n = 4) and Prmt5 MKO mice (n = 4).
-
H, IRepresentative H&E (H) and dystrophin immunofluorescence of images of TA muscle cross‐sections in WT and Prmt5 MKO mice. Scale bar: 100 μm.
-
J, KDistribution of myofiber size (J) and average myofiber cross‐sectional area (CSA) (K) of WT (n = 4) and Prmt5 MKO TA muscles (n = 4).
-
LThe total number of myofibers in EDL and Soleus from WT (n = 5) and Prmt5 MKO mice (n = 6).
Data information: The data are presented as mean ± SEM and P‐values determined by two‐tailed ANOVA unpaired t‐test based on sample sizes (biological replicates) shown in (C–E, G, J, K, L) (*P < 0.05, **P < 0.01, ***P < 0.001, ****P < 0.0001).
The Prmt5 MKO mice were born normally but appeared leaner than their WT littermates starting at 6‐week‐old, despite similar food intake (Fig 1B–D). EcoMRI body composition measurements revealed that the reduced body weights in the 2‐month‐old KO mice is associated with significant reduction in lean mass (muscle) but not in fat mass (Fig 1E). Consistently, the 2‐month‐old Prmt5 MKO mice had smaller skeletal muscles, including Sol (Soleus), EDL (Extensor digitorum longus), TA (Tibialis anterior), GAS (Gastrocnemius), and QU (Quadriceps) muscles, than WT counterparts (Fig 1F and G). In contrast, fat masses of various depots including iWAT (Inguinal white adipose tissue) and BAT (Brown adipose tissue) were similar between the WT and KO mice (Fig EV1E). We also measured myofiber size based on cross‐sectional area (CSA) in TA muscle sections after H&E staining and immunofluorescence staining of dystrophin (Fig 1H and I). A leftward shift in the distribution of myofiber sizes was observed in 2‐month‐old Prmt5 MKO mice (Fig 1J), and the average CSA of the TA muscle in Prmt5 MKO mice was significantly smaller than that of WT muscles (Fig 1K), but the total number of myofibers in the EDL and Soleus muscles was similar# between WT and Prmt5 MKO mice (Fig 1L).
To determine whether reduced myofiber size is due to protein degradation, we examined expression of Atrogin‐1 and MuRF‐1 (encoded by Fbxo32 and Trim63 gene respectively), markers for muscle‐specific E3 ubiquitin ligases involved in the breakdown of muscle proteins during muscle atrophy. The levels of Atrogin‐1 and MuRF1 were similar between WT and KO muscle tissues (Fig EV1F). This suggests that alternative pathways contributed to muscle atrophy independent of the ubiquitin‐proteasome system. We then investigated early stages of postnatal muscle growth (before weaning) by measuring the average size and total number of myofibers in TA muscles at postnatal day (P) P7 and P21. The results showed no difference in myofiber size and number between WT and Prmt5 MKO mice (Fig EV2A–C). These results suggest that PRMT5 in myofiber does not affect muscle development and early growth.
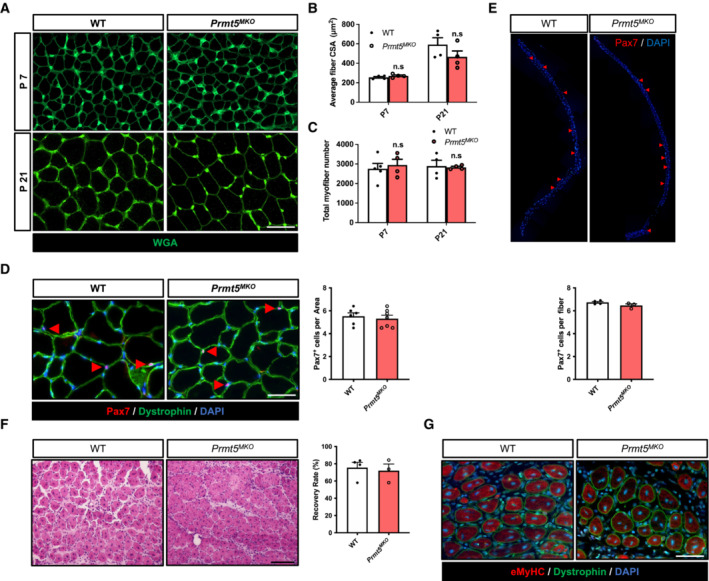
Figure EV2. Prmt5 ablation in skeletal muscle does not affect myogenesis in vivo .
-
ARepresentative immunofluorescences of WGA staining in TA muscles cross‐sections at post‐natal day at 7 and 21 in WT and Prmt5 MKO mice. Scale bar: 100 μm.
-
B, CAverage size (B) and total number (C) of myofiber in TA muscles at day 7 and 21 in WT (n = 5 for P7, n = 4 for P21) and Prmt5 MKO mice (n = 4 for P7, n = 4 for P21, biological replicates).
-
DA representative immunofluorescence of Pax7 and Dystrophin (left panel) and quantification of Pax7+ cells per area (right panel) in TA muscles from WT and Prmt5 MKO mice (n = 6). Scale bar: 100 μm.
-
EA representative immunofluorescence of Pax7 (upper panel) and quantification of Pax7+ cells per myofiber (bottom panel) in freshly isolated single myofibers from WT and Prmt5 MKO mice (n = 3).
-
FA representative H&E staining (left panel) and quantification of recovery rate (right panel) of TA muscles upon CTX injury at 5.5‐day and from WT (n = 4) and Prmt5 MKO mice (n = 3). Scale bar: 100 μm.
-
GA representative immunofluorescence of eMyHC and Dystrophin in injured TA muscles from WT and Prmt5 MKO mice. Scale bar: 100 μm.
Data information: The data are presented as mean ± SEM in (B–F). The total number of biologically independent samples are indicated in (B–F).
To further determine whether muscle‐specific loss of PRMT5 affect myofiber‐associated Pax7+ satellite cells that are essential for nuclei accretion during muscle growth, we quantified the number of Pax7+ cells in muscle tissues and freshly isolated myofibers. A similar number of Pax7+ satellite cells was found in WT and Prmt5 MKO mice (Fig EV2D and E). We also assessed whether Prmt5 MKO affects regeneration of muscle tissue after cardiotoxin (CTX)‐induced injury, but muscle histology and newly regenerated myofibers (marked by eMyHC) did not exhibit significant differences between WT and Prmt5 MKO mice (Fig EV2F and G). These results together suggest that Prmt5 MKO does not affect embryonic myogenesis, early growth, and postnatal muscle regeneration, but affect postnatal muscle maintenance.
Prmt5 KO impairs motor performance and muscle contractile function
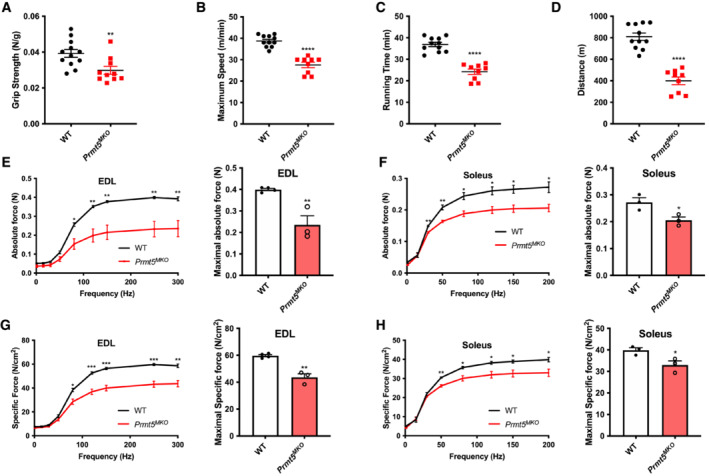
We examined muscle functions based on several physiological measurements. The grip strength of Prmt5 MKO mice was significantly weaker than that of WT mice (Fig 2A). When mice were run on a treadmill, the Prmt5 MKO mice exhibited significantly lower maximum speed, running time, and running distance than did their littermate controls (Fig 2B–D). To explore whether the reduced grip strength and exercise performance of Prmt5 MKO mice was due to attenuated muscle contractile function, we assessed force generation capacity of the isolated fast‐twitch EDL and slow‐twitch Soleus muscles. Force development of the EDL and Soleus muscles was measured over a range of stimulation frequencies (Fig 2E and F). The maximum absolute force of the EDL and Soleus muscles was reduced by 40 and 22%, respectively, in the KO mice relative to WT animals (Fig 2E and F). A similar trend was observed in specific force, when absolute force was normalized to muscle CSA (Fig 2G and H). The maximal specific forces of Prmt5 MKO EDL and Soleus were 27 and 16% lower than the corresponding WT muscles, respectively (Fig 2G and H). These observations indicate that PRMT5 loss‐of‐function leads to skeletal muscle weakness.
Figure 2. Reduced motor‐performance and muscle contractile function in 2‐month‐old Prmt5 MKO mice.
-
AGrip strength tests of WT and Prmt5 MKO mice assessed by grip force normalized to body weight WT (n = 12) and Prmt5 MKO mice (n = 10).
-
B–DExercise performance of maximum speed (B), running time (C), running distance (D) of WT (n = 11) and Prmt5 MKO mice (n = 9) measured by treadmill.
-
E, FAbsolute (E) and specific force (F) (on the left panel) and maximal absolute and specific force (on right panel) on EDL muscle from WT (n = 4) and Prmt5 MKO mice (n = 3).
-
G, HAbsolute (G) and specific force (H) (on the left panel) and maximal absolute and specific force (on right panel) on Soleus muscle from WT (n = 4) and Prmt5 MKO mice (n = 3). Data information: The data are presented as mean ± SEM and the P‐values by two‐tailed ANOVA unpaired t‐test based on total number of biologically independent samples indicated in (A–H) (*P < 0.05, **P < 0.01, ***P < 0.001, ****P < 0.0001).
Prmt5 KO reduces oxidative myofibers while increasing glycolytic myofibers
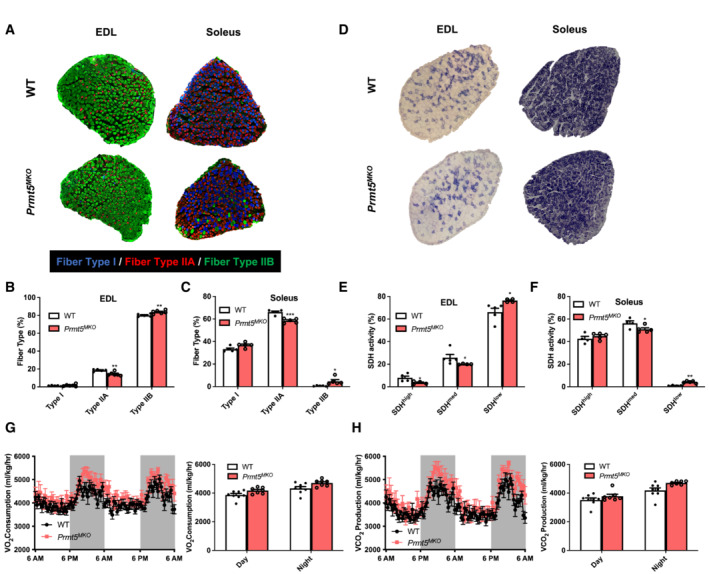
Metabolic properties of myofibers have profound effects on exercise endurance and systemic metabolism (Baskin et al, 2015). We next assessed myofiber composition of representative fast (EDL) and slow (Soleus) muscles based on immunofluorescent staining of myosin heavy chain isoforms (Fig 3A). A reduced proportion of oxidative type IIA myofibers and an increased proportion of glycolytic type IIB myofibers were observed in EDL and Soleus muscles of Prmt5 MKO compared with WT muscles (Fig 3B and C). We further carried out succinate dehydrogenase (SDH) staining as an indicator of mitochondrial oxidative capacity (Fig 3D). Compared with the WT EDL muscles, Prmt5 MKO muscles had a lower abundance of SDHhigh and SDHmed myofibers and a higher abundance of SDHlow myofibers (Fig 3E). The Prmt5 MKO Soleus muscles also had reduced abundance of SDHmed myofibers and increased abundance of SDHlow myofibers (Fig 3F). To evaluate the consequence of myofiber type alteration on whole‐body metabolism, we used indirect calorimetry to measure the oxygen consumption (VO2) and carbon dioxide production (VCO2) (Fig 3G and H). Prmt5 MKO mice showed similar levels of oxygen consumption (VO2), carbon dioxide production (VCO2), and decreased heat production than WT counterparts, during both day and night when the values were normalized to lean masses due to the reduced lean masses in the KO mice (see Fig 1E and 3G and H, and EV3A); however, there are significant differences in the VO2 and VCO2 between WT and Prmt5 MKO mice (Fig EV3B and C). Collectively, these findings suggest that Prmt5 MKO alters muscle metabolism by shifting oxidative myofibers toward glycolytic myofibers.
Figure 3. Depletion of Prmt5 leads to a fiber‐type switch toward glycolytic myofibers but does not affect systemic metabolism.
-
ARepresentative immunostaining of Type I, IIA, and IIB myofibers in in EDL and Soleus muscles of 2‐month‐old WT and Prmt5 MKO mice.
-
B, CQuantification of abundance of various fiber types in EDL (B) and Soleus (C) muscles of WT and Prmt5 MKO mice; (n = 5).
-
DRepresentative histochemical staining image of succinate dehydrogenase (SDH) enzymatic activity in EDL and Soleus muscles.
-
E, FQuantification of abundance of SDH‐low, ‐medium and ‐high myofibers in EDL (E) and Soleus (F) muscles of WT (n = 5) and Prmt5 MKO mice (n = 4).
-
G, HMetabolic rate of O2 consumption (G) and CO2 production (H) normalized to lean mass for a 48‐h cycle of 4–6‐month‐old WT (n = 8) and Prmt5 MKO (n = 7) mice measured by an indirect calorimetry.
Data information: The data are presented as mean ± SEM and P‐values by two‐tailed ANOVA unpaired t‐test based on total number of biologically independent samples indicated in (B, C), and (E–H) (*P < 0.05, **P < 0.01, ***P < 0.001).
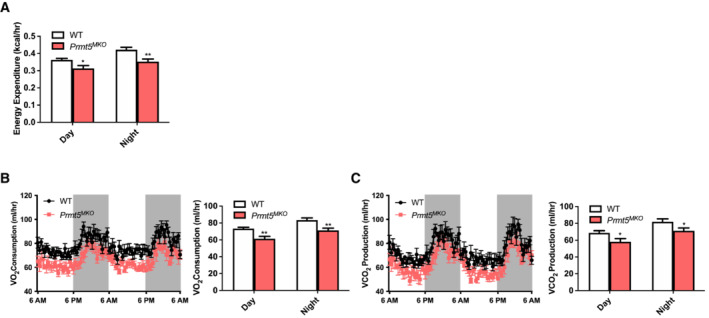
Figure EV3. Systemic metabolic rate in WT and Prmt5 MKO mice by an indirect calorimetry.
-
AAverage day and night heat expenditure of 4–6‐month‐old WT (n = 8) and Prmt5 MKO (n = 7) mice over 48 h.
-
B, CSystemic metabolic rate of O2 consumption (VO2) (B) and CO2 production (VCO2) (C) of WT (n = 8) and Prmt5 MKO (n = 7) mice.
Data information: The data are presented as mean ± SEM in (A–C). The P values by two‐tailed ANOVA unpaired t test are indicated in (A). The total number of biologically independent samples are indicated in (A–C) (*P < 0.05, **P < 0.01).
PRMT5 regulates lipid metabolism in skeletal muscles
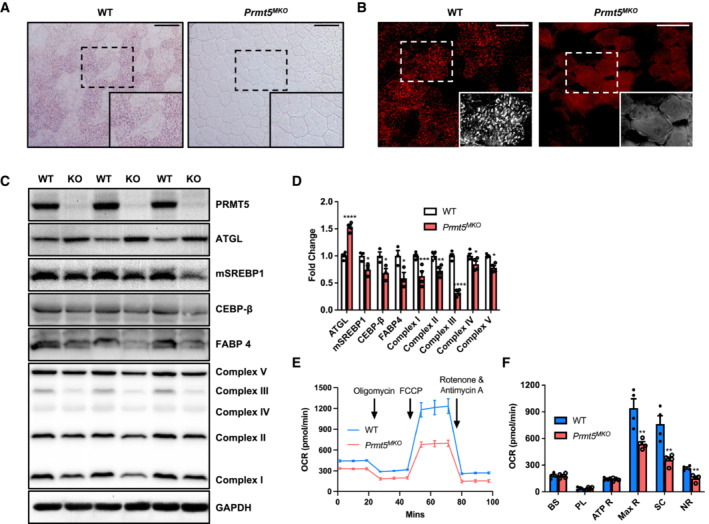
Given the fiber type switching in Prmt5 MKO mice and well‐known metabolic differences among fiber types, we further explored lipid metabolism, which is more pronounced in oxidative myofibers (Jocken et al, 2008). As the first step, we assessed neutral lipid content by Oil Red O (ORO) staining in TA muscle sections and observed in WT muscles under brightfield imaging clusters of myofibers with numerous ORO+ lipid droplets, presumably representing oxidative myofibers (Fig 4A). However, ORO+ lipid droplets were completely absent in the Prmt5 KO muscles (Fig 4A). We also used more sensitive fluorescent imaging (as ORO emits red fluorescence) and again observed fluorescent puncta representing lipid droplets in selective clusters of WT myofibers (Fig 4B). In contrast, ORO puncta were absent in Prmt5 MKO muscles, and only weak and nonpuncta ORO fluorescence were detectable (Fig 4B). These data demonstrate that Prmt5 KO deregulates lipid metabolism in myofibers.
Figure 4. PRMT5‐deficient skeletal muscles exhibit lower lipid content and metabolic rate.
-
A, BRepresentative images of ORO staining (A) and immunofluorescence (B) in TA muscle from WT and Prmt5 MKO mice. Scale bar: 100 μm.
-
CWestern blotting analysis for protein markers of lipolysis, lipogenesis, and electron transport chain (ETC) complexes in skeletal muscles of WT (n = 3) and Prmt5 MKO mice; (n = 3).
-
DQuantification of relative protein levels of ATGL, mSREBP1, CEBP‐β, FABP4, OXPHOS complexes (normalized to GAPDH) in skeletal muscles of WT and Prmt5 MKO mice; (n = 3).
-
ESeahorse analysis of oxygen consumption rate (OCR) in myotubes differentiated for 3‐days from myoblasts of 4‐week‐old WT and Prmt5 MKO mice; (n = 4).
-
FOCR was measured at basal state and after sequential addition of Oligomycin, FCCP, and Rotenone/Antimycin A to determine basal respiration (BS), proton leak (PL), ATP respiration (ATP R), maximal respiration (Max R), spare capacity (SC), and non‐mitochondrial respiration (NR); (n = 4, technical replicates).
Data information: The data are presented as mean ± SEM and P‐values by two‐tailed ANOVA unpaired t‐test based on number of biologically independent samples indicated in (D–F) (*P < 0.05, **P < 0.01, ***P < 0.001, ****P < 0.0001).
We further examined the levels of several key proteins involved in lipid metabolism (ATGL/Pnpla2, mSREBP1, CEBP‐β, FABP4) and downstream mitochondrial electron transport chain (ETC) mediating FAO (Fig 4C). Quantification results showed that the levels of ATGL, a rate‐limiting enzyme of lipolysis, were consistently higher but the lipogenic and mitochondrial ETC proteins were all lower in Prmt5 MKO compared with WT muscles (Fig 4D). We investigated how PRMT5‐dependent lipid metabolism affects mitochondrial respiration through Seahorse Analysis in 3‐day differentiated myotubes (Fig 4E). The results showed that KO myotubes led to significantly lower levels of oxygen consumption associated with maximal respiration (Max R) and spare capacity (SC) (Fig 4F). The metabolic alterations were not due to differentiation defects because myotube morphology and fusion index (quantified by the number of MyoG+ cells ≥ 2 within myotube) remained similar between WT and KO myotubes (Appendix Fig S2). Overall, these findings demonstrate that PRMT5 is crucial for maintaining normal lipid metabolism and mitochondrial respiratory activity in the skeletal muscles.
PRMT5 methylates mSREBP1a to increase its stability
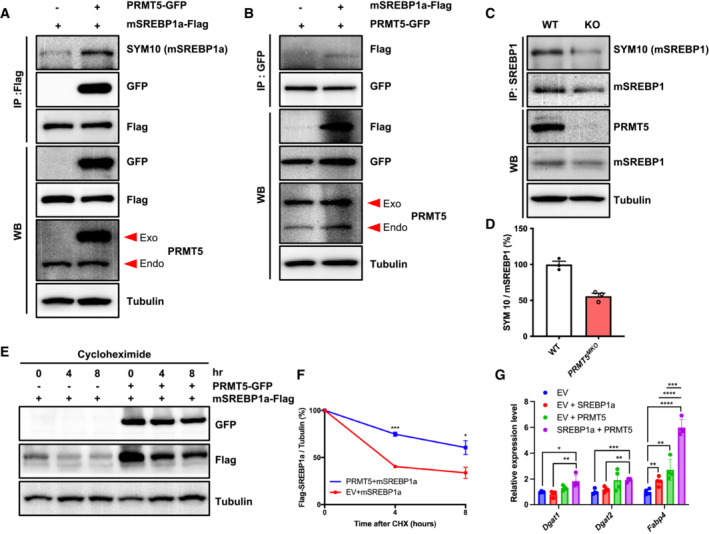
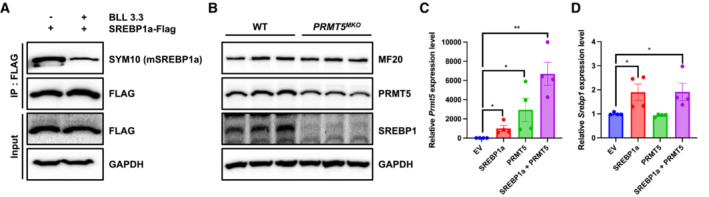
To understand how PRMT5 regulates lipid metabolism in myofibers, we focused on mSREBP1a, a key transcriptional factor regulating lipogenesis that has been reported to be methylated by PRMT5 (Liu et al, 2016). As Prmt5 KO reduced the level of mSREBP1 (Fig 4C and D), we hypothesized that PRMT5 stabilizes mSREBP1a. We expressed PRMT5‐GFP and SREBP1a‐Flag fusion proteins in C2C12 myoblasts and confirmed the overexpression of corresponding proteins (Fig 5A). We then performed co‐immunoprecipitation (co‐IP) using Flag antibody and observed that PRMT5 not only binds to mSREBP1a, but also methylates mSREBP1a (Fig 5A). Conversely, co‐IP using GFP antibody (for PRMT5‐GFP) also confirmed pull‐down of mSREBP1‐Flag (Fig 5B). We also performed co‐IP and western blots (WB) on WT and Prmt5 MKO muscles lysates, showing reduced levels of total mSREBP1 and symmetrically dimethylated mSREBP1 in the KO samples (Fig 5C). Notably, the ratio of symmetrically dimethylated mSREBP1 to total mSREBP1 was significantly lower in the Prmt5 MKO than in the WT muscles (Fig 5D). Consistently, pharmacological inhibition of PRMT5 using BLL3.3 also decreased the dimethylation of mSREBP1a in C2C12 myoblasts (Fig EV4A). These results together demonstrate that PRMT5 mediates dimethylation of mSREBP1.
Figure 5. PRMT5 regulates lipid accumulation through SREBP1a methylation and stabilization.
-
AC2C12 cells overexpressing PRMT5‐GFP alone or PRMT5‐GFP + SREBP1a‐Flag were immunoprecipitated with Flag antibody and blotted with SYM10, GFP, Flag, PRMT5, and Tubulin antibodies. Exo, exogenous (overexpressed); Endo, endogenous.
-
BC2C12 cells overexpressing SREBP1a‐Flag alone or SREBP1a‐Flag + PRMT5‐GFP were immunoprecipitated with GFP antibody and blotted with Flag, GFP, PRMT5, and Tubulin antibodies.
-
CProtein extracts of skeletal muscle isolated from WT and Prmt5 MKO mice were immunoprecipitated with SREBP1 antibody and immunoblotted with SYM10 (mSREBP1), SREBP1, PRMT5, and tubulin antibodies.
-
DQuantification of methylated mSREBP1 (normalized to total mSREBP1) in (C); (n = 3, biological replicates).
-
EHEK293 cells were transfected with PRMT5‐GFP alone or PRMT5‐GFP + SREBP1a‐Flag for 24 h, followed by cycloheximide (30 μg/ml) and protein analysis at 0, 4, 8 h. Lysates were immunoblotted with Flag, GFP, and tubulin antibodies.
-
FIntensity of Flag was normalized to tubulin, then normalized to 0 h; (n = 3, biological replicates).
-
GRelative expression of lipogenesis genes (Dgat1, Dgat2, Fabp4) in C2C12 transfected with PRMT5 and SREBP1a; (n = 4, technical replicates).
Data information: Data are presented as mean ± SEM and P‐values determined by two‐tailed ANOVA unpaired t‐test based on total number of biologically independent samples indicated in (D, F, G) (*P < 0.05, **P < 0.01, ***P < 0.001, ****P < 0.0001).
Figure EV4. PRMT5 inhibitor reduces SREBP1a dimethylation in C2C12 myoblasts.
-
AC2C12 cells overexpressing SREBP1a‐Flag were immunoprecipitated with Flag antibody in the absence or presence of BLL 3.3, PRMT5 inhibitor, and blotted with SYM10, Flag, GAPDH.
-
BImmunoblotting analysis showing the contents of SREBP1 protein levels in 3‐days differentiated myotube isolated from WT and Prmt5 MKO mice.
-
C, DRelative expression of Prmt5 (C) and Srebp1 (D) in C2C12 cells overexpressing SREBP1a along or together with PRMT5 (n = 4).
Data information: The data are presented as mean ± SEM in (C, D). The P‐values by two‐tailed ANOVA unpaired t‐test are indicated in (C, D). The total number of biologically independent samples are indicated in (C, D) (*P < 0.05, **P < 0.01).
To explore the biological significance of PRMT5‐mediated dimethylation of mSREBP1a, we performed protein stability assay. We overexpressed mSREBP1a with or without PRMT5 in C2C12 myoblasts (Fig 5E). Cells were then treated with cycloheximide (CHX) to inhibit new protein synthesis. Proteins were collected at 0, 4, 8 h after addition of CHX to determine their degradation (Fig 5E). Analysis of mSREBP1a levels over time indicates that PRMT5 expression significantly increased the stability of SREBP1a (Fig 5F). Consistently, Prmt5 MKO diminished the protein contents of SREBP1 in myotubes differentiated from the mutant myoblasts (Fig EV4B). We also analyzed the expression of SREBP1 target genes responsible for TAG synthesis and fatty acid transport (Dgat1, Dgat2, and Fabp4) in the C2C12 cells overexpressing mSREBP1a alone or together with PRMT5 (Figs 5G and EV4C and D). The results show that PRMT5/SREBP1a co‐expression significantly elevated the levels of Dgat1, Dgat2, and Fabp4 compared with SREBP1a overexpression‐alone group (Fig 5G). This observation demonstrates that dimethylation stabilizes mSRBP1a and increases its transcriptional activity in the presence of PRMT5.
PRMT5 mediates repressive H4R3 dimethylation to regulate Pnpla2 expression
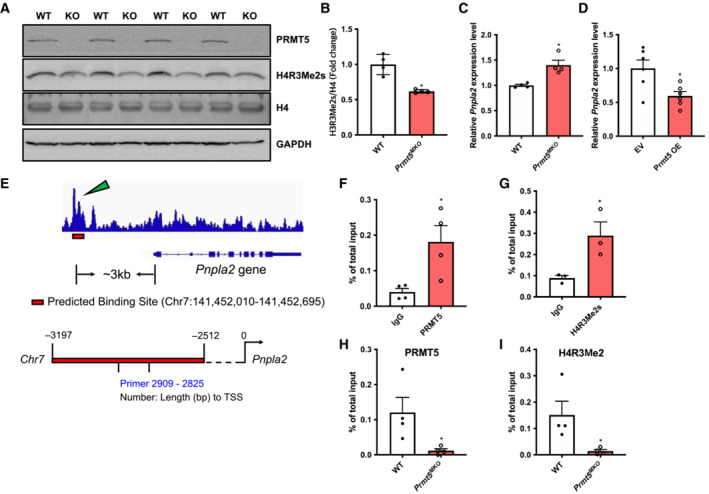
We next explored how PRMT5 regulates ATGL (encoded by Pnpla2 gene) expression and lipolysis in muscle cells. PRMT5 has been reported to symmetrically dimethylates arginine residues in histones to repress gene transcription (Ancelin et al, 2006; Wang et al, 2008; Deng et al, 2017). We found that symmetric dimethylation of H4R3 (H4R3Me2s) was significantly reduced in Prmt5 MKO muscle tissues (Fig 6A and B). In addition, Pnpla2 expression was upregulated in Prmt5 MKO muscle tissues but downregulated in PRMT5‐overexpressing C2C12 myoblasts (Fig 6C and D). These data prompted us to hypothesize that PRMT5 directly regulates transcription of Pnpla2 through repressive H4R3Me2s. To test this, we analyzed a ChIP‐seq dataset (Jia et al, 2020) and identified a PRMT5 binding peak at around 3,000 bp upstream of transcription start site (TSS) of the Pnpla2 gene (Fig 6E). ChIP‐qPCR analysis confirmed that this region is highly enriched by both PRMT5 and H4R3Me2s in newly differentiated C2C12 myotubes (Fig 6F and G). To substantiate this finding, another ChIP‐qPCR assay was performed using WT and Prmt5 MKO muscle tissues, and Prmt5 MKO diminished the binding of PRMT5 and H4R3Me2s at the Pnpla2 promoter region (Fig 6H and I). Taken together, these results demonstrate that Pnpla2 is epigenetically repressed by PRMT5 through H4R3Me2s.
Figure 6. Epigenetic repression of Pnpla2 transcription by PRMT5 in skeletal muscle.
-
A, BImmunoblots showing symmetric demethylation of H4R3 in skeletal muscles of WT (n = 4) and Prmt5 MKO mice (n = 4) (A), and quantification of H4R3Me2s normalized to total H4 (B).
-
CRelative Pnpla2 levels in skeletal muscles of WT and Prmt5 MKO mice; (n = 4)
-
DRelative Pnpla2 levels in Prmt5‐overexpressed C2C12 myoblasts; (n = 6).
-
EChIP‐sequencing results showing the Prmt5 binding peak on the Pnpla2 promoter of 3T3‐L1 cells.
-
F, GEnrichment of PRMT5 (F) and H4R3Me2s (G) on the proximal promoter region of the Pnpla2 gene in myotubes; (n = 4 for F, n = 3 for G, biological replicates).
-
H, IEnrichment of PRMT5 (H) and H4R3Me2s (I) on the proximal promoter region of the Pnpla2 gene in skeletal muscles of WT and Prmt5 MKO mice (n = 4 for H, and I, biological replicates).
Data information: The data are presented as mean ± SEM and P‐values by two‐tailed ANOVA unpaired t‐test based on total number of biologically independent samples indicated in (B–D), and (F–I) (*P < 0.05).
Pnpla2 KO normalizes muscle mass and function of the Prmt5 MKO mice
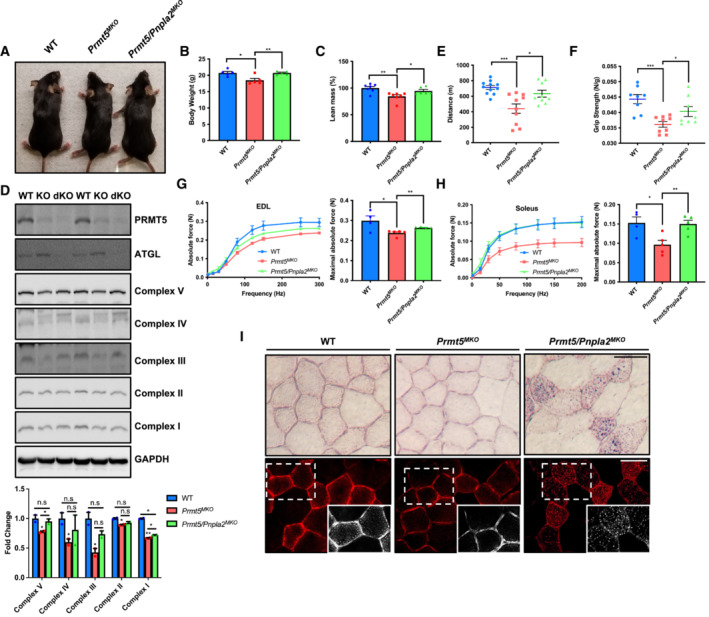
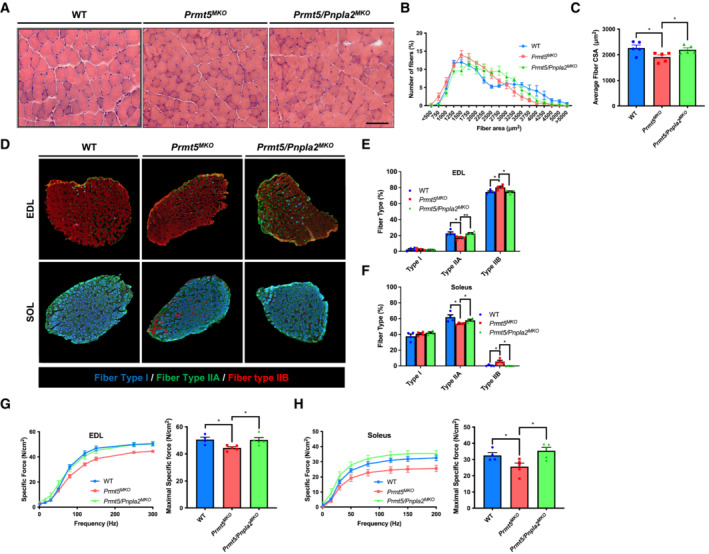
Adipose triglyceride lipase upregulation drives muscle wasting in cancer cachexia (Das et al, 2011). To directly test whether upregulation of ATGL is responsible for the phenotypes of the Prmt5 MKO mice, we used Myl1 cre to drive muscle‐specific double KO of Prmt5 and Pnpla2 (Prmt5/Pnpla2 MKO ). Strikingly, the Prmt5/Pnpla2 MKO mice appeared similar to WT mice, and larger than the Prmt5 MKO mice (Fig 7A). The body weights and lean masses of the Prmt5/Pnpla2 MKO mice were also comparable to those of the WT mice, and higher than those of the Prmt5 MKO mice (Fig 7B and C). Western blotting confirmed the loss of PRMT5 and ATGL in Prmt5/Pnpla2 MKO muscles, and the loss of Prmt5/Pnpla2 restored the levels of mitochondrial ETC proteins in Prmt5 KO tissue (Fig 7D). The myofiber size was also restored to the WT level in the Prmt5/Pnpla2 MKO mice (Fig EV5A–C). Performance on the incremental treadmill test and limb grip strength in Prmt5/Pnpla2 MKO mice were also restored to the WT level (Fig 7E and F). In addition, the alterations in fiber type composition observed in the Soleus and EDL muscles of the Prmt5 MKO mice were largely normalized in the Prmt5/Pnpla2 MKO mice (Fig EV5D–F). Moreover, the absolute and specific forces of the EDL and Soleus muscles of Prmt5/Pnpla2 MKO were significantly higher than that of the Prmt5 MKO mice, with the maximal force of Prmt5/Pnplal2 MKO mice muscles being identical to that of WT mice (Fig 7G and H, and EV5G and H). We also assessed lipid content by ORO staining in myofibers and found a clear increase in the number of ORO+ LDs in Prmt5/Pnpla2 MKO muscles compared to Prmt5 MKO muscles under brightfield and fluorescent imaging (Fig 7I). Collectively, these data demonstrate that PRMT5 regulates neutral lipid content, myofiber size, and function through ATGL.
Figure 7. Pnpla2 deletion restores lipid content and muscle function of Prmt5 MKO mice.
-
A, BA representative images of whole body (A) and body weight (B) of WT (n = 6), Prmt5 MKO (n = 6), and Prmt5/Pnpla2 MKO mice (n = 6) at 8 weeks of age.
-
CPercentage of lean mass determined by body composition analyzer for WT (n = 6), Prmt5 MKO (n = 7) and Prmt5/Pnpla2 MKO mice (n = 6) at 8‐weeks‐old.
-
DImmunoblotting analysis showing PRMT5, ATGL and ETCs in muscle tissues (upper panel) and quantification of its relative protein levels in muscles of WT, Prmt5 MKO , and Prmt5/Pnpla2 MKO mice (bottom panel) (n = 2, biological replicates).
-
E, FExercise performance in running distance (E) and griping strength test (F) in WT (n = 11 for E, n = 8 for F), Prmt5 MKO (n = 10 for E, n = 9 for F) and Prmt5/Pnpla2 MKO mice (n = 9 for E, n = 8 for F).
-
G, HAbsolute force (left panel) and maximal absolute force (right panel) of EDL (G) and Soleus (H) muscles of WT (n = 4), Prmt5 MKO (n = 5) and Prmt5/Pnpla2 MKO mice (n = 5).
-
IRepresentative images of ORO staining in TA muscles under brightfield (upper panel) and fluorescent imaging (bottom panel) from WT, Prmt5 MKO , and Prmt5/Pnpla2 MKO mice. Scale bar: 50 μm.
Data information: The data are presented as mean ± SEM and P‐values by two‐tailed ANOVA unpaired t‐0test based on total number of biologically independent samples indicated in (B–H) (*P < 0.05, **P < 0.01, ***P < 0.001).
Figure EV5. Loss of Pnpla2 enlarges myofiber sizes and improves muscle function compared to Prmt5 MKO mice.
-
A–CA Representative H&E staining, (A) distribution (B) and average (C) of myofiber CSA in TA muscles from WT, Prmt5 MKO and Prmt5/Pnpla2 MKO mice; (n = 5). Scale bar: 100 μm.
-
DRepresentative immunofluorescent fiber type staining (fiber type I, fiber type IIA, fiber type IIB) of 2–3‐month‐old WT, Prmt5 MKO and Prmt5/Pnpla2 MKO mice.
-
E, FQuantification of stained 3 fiber type in EDL (E) and Soleus (F) muscles from WT, Prmt5 MKO and Prmt5/Pnpla2 MKO mice; (n = 4).
-
G, HA graph of specific force (left panel) and maximal specific force (right panel) of EDL (G) and Soleus (H) muscles from WT (n = 4), Prmt5 MKO mice (n = 5) and Prmt5/Pnpla2 MKO mice (n = 5).
Data information: The data are presented as mean ± SEM in (B–H). The P‐values by two‐tailed ANOVA unpaired t‐test are indicated in (C–H). The total number of biologically independent samples are indicated in (B–H) (*P < 0.05, **P < 0.01).
Discussion
Our study uncovers a new role of PRMT5 in myofiber metabolism and contractile function. Utilizing a muscle‐specific Prmt5 KO mouse model, we provided physiological, histological, and molecular evidence to support that PRMT5 ablation leads to muscle atrophy and favors the formation of glycolytic myofibers. Mechanistically, PRMT5 on one hand mediates mSREBP1a methylation to stabilize this protein and promote lipogenesis, on the other hand mediates H4R3me2 to repress Pnpla2 expression and limit lipolysis in myofibers. Thus, PRMT5 should normally promote IMCL deposition through stimulating lipogenesis and limiting lipolysis. Subsequently, concomitant deletion of Pnpla2 restored muscle functions of the Prmt5 MKO mice (Fig 8). These results establish a new role of PRMT5 in linking the contractile and metabolic function of myofibers.
Figure 8. Schematic model depicting the role of PRMT5 in the skeletal muscle.
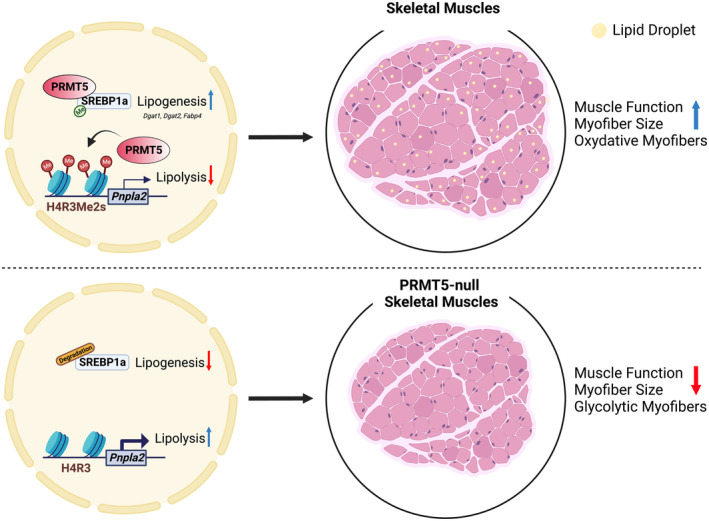
PRMT5 is highly expressed in skeletal muscle and necessary to mediate symmetric dimethylation of repressive H4R3 at the Pnpla2 gene, therefore inhibiting lipolysis. PRMT5 also methylates and stabilizes mSREBP1a to promote LD biogenesis. Genetic knockout of Prmt5 attenuates physical activity and decreases myofiber size accompanied by reduced LD deposition. The deletion of Pnpla2 in vivo can restore the decreased muscle function due to Prmt5 loss.
Previous work has reported a key role of PRMT5 in regulating proliferation of muscle progenitor cells, and the deletion of Prmt5 impairs progenitor cell‐mediated muscle regeneration (Zhang et al, 2015). In vitro studies on PRMT5 have revealed its role in regulating COPR5‐mediated cell proliferation and BRG1/MyoD‐dependent chromatin remodeling for myogenic activation within myoblasts (Dacwag et al, 2007; Paul et al, 2012). Although PRMT5 level has been reported to be influenced by exercise in rodent and human skeletal muscles (Vanlieshout et al, 2018, 2019), the specific role of PRMT5 in myofibers has been unknown. This represents a critical knowledge gap given the elevated Prmt5 expression during myogenic differentiation (Fig EV1). In this work, we used muscle‐specific Myl1 cre mice to drive the deletion of Prmt5 in postdifferentiation myofibers. Myl1 gene is activated at E9 during embryonic development within most skeletal muscles in vivo and is expressed in mononuclear myofibers during differentiation in vitro (Kelly et al, 1997; Bi et al, 2016). Therefore, the muscle atrophy of the Prmt5 MKO mice is independent of myogenic differentiation.
In our study, we observed the muscle atrophy of Prmt5 MKO mice is associated with elevated levels of ATGL, which promotes lipolysis of lipid droplets in myofibers. PRMT5‐dependent mSREBP1a methylation in nucleus is reported to upregulate de novo lipogenesis in adipocytes and cancer cells (Liu et al, 2016, 2021; Zhang et al, 2018; Jia et al, 2020; Webb et al, 2020). Our study clearly demonstrated that mSREBP1a is stabilized through methylation by PRMT5, and co‐overexpression of Prmt5 and Srebp1a upregulates lipogenic genes. Our results suggest that a normal lipid droplet content is necessary for proper function of the muscle. Lipid accumulation in myofibers has been associated with functional declines of muscle in lipid storage myopathies (Vasiljevski et al, 2018). Our results demonstrate that a lack of lipids in the myofibers severely compromises muscle contractile function and reduces muscle mass. Our study further suggests that targeting PRMT5 using commercially available pharmacological inhibitors could be a potential therapy for patients with lipid myopathies.
Muscle fiber type switching occurs in response to a variety of genetic, physiological, and metabolic condition (Schiaffino & Reggiani, 2011). A decrease in the proportion of slow‐oxidative myofibers is, in general, correlated with reduced exercise plasticity (Park et al, 2021). Several PRMTs have been reported to affect fiber type composition (Stouth et al, 2018). An increase in the proportion of glycolytic fibers was reported in Prmt7 KO mice, resulting in reduced endurance exercise capacities (Jeong et al, 2016). In our study, loss of PRMT5 protein also converted oxidative myofibers to glycolytic fiber type, suggesting that PRMT5 is essential for specification or maintenance of the oxidative myofiber types and exercise endurance. Oxidative myofibers normally have a higher mitochondrial content than glycolytic myofibers to enable cellular energy production through oxidative phosphorylation (Hawley, 2002). In pharmacological and genetic inactivation studies in vivo, mitochondrial enzyme activity has been shown to be positively associated with exercise capacity (Marcinko et al, 2015; Park et al, 2021). Consistently, the reduction in oxidative phosphorylation in skeletal muscle tissues and reduced OCR in myofibers of Prmt5 MKO mice are associate with reduced exercise performance. Glycolytic myofibers normally have higher rate of ATP hydrolysis and generate larger contractile force than slow‐twitching oxidative myofibers (Schiaffino & Reggiani, 2011), but the glycolytic fiber type switching in our Prmt5 MKO mice did not improve muscle force production. This can be explained by the atrophy of these Prmt5‐null glycolytic myofibers, manifested by significantly reduced myofiber diameter compared with WT glycolytic myofibers. In addition, the mutant glycolytic myofibers are devoid of LDs, which would reduce muscle energy supply to support contraction. These metabolic alterations may have together accounted for the impaired exercise capacity, as Pnpla2 KO in Prmt5 MKO mice rescues not only the lipid droplet content but also muscle contractile functions.
Gene expression and transcription initiation are regulated by numerous epigenetic markers (Ng et al, 2009; Moore et al, 2013). An epigenetic role of PRMT5 has been shown to regulate chromatin remodeling through histone modification during myogenesis (Tao et al, 2011; Paul et al, 2012; Gan et al, 2019). We show that in terminally differentiated myofibers, PRMT5‐mediated H4R3Me2s represents a significant epigenetic regulatory mechanism underlying muscle function and metabolism. We reveal that PRMT5 represses Pnpla2 expression through directly binding to its promoter. Consistent with our results, PRMT7 and PRMT5 mediate H4R3Me2 represses expression of Dnmt3b and Flip1L, respectively (Fan et al, 2014; Cai et al, 2020). Interestingly, SIRT7‐mediated desuccinylation at K387 enhances methyltransferase activity of PRMT5 by promoting formation of PRMT5‐MEP5 complex to regulate lipid metabolism, and PRMT5 facilitates fatty acid biogenesis through mSREBP1a methylation and BSCL2‐mediated lipid droplet formation through methylating SPT5 in adipocytes (Jia et al, 2020; Yuan et al, 2022). However, the protein levels of ATGL are positively regulated by PRMT5 in adipose tissue but negatively regulated by PRMT5 in myofibers, suggesting tissue‐dependent roles of PRMT5 (Jia et al, 2020).
Although we show that PRMT5 represses lipolysis in myofibers, whether it also regulates mitochondrial fatty acid oxidation (FAO) remains unknown. Lipid dynamics are modulated by mitochondrial activity, and oxidation of FAs is linked to ATP production for proper muscle function (Eaton, 2002). Patients with lipid storage disorder show disrupted mitochondrial activity in respiratory complexes, and it leads to muscle wasting (Debashree et al, 2018; Ji & Yeo, 2019). Furthermore, mitochondrial‐targeted antioxidants improved muscle atrophy by preventing reactive oxygen (ROS) production (Min et al, 2011). Future studies will be needed to address the involvement of PRMT5 in regulating mitochondrial activity in myofibers.
Materials and Methods
Mice
All procedures involving mice were performed in compliance with the institutional guidelines of Purdue University Animal Care and Use Committee. Myl1 cre (Stock # 024713) mouse strains were provided by Steven Burden (Scribal Institute of Biomolecular Medicine, NYU), Rosa26‐Cre ER (Stock # 008463) mouse strains were bought from Jackson Laboratory, and Prmt5 flox/flox (Stock # 034414) and Pnpla2 flox/flox (Stock # 024278) mouse strains were obtained as described previously (Jia et al, 2020; Yue et al, 2022). The genotypes of experimental WT and KO animals are as follows: WT (Prmt5 flox/flox ), Prmt5 MKO (Myl1 cre ; Prmt5 flox/flox ), and Prmt5/Pnpla2 MKO (Myl1 cre ; Prmt5 flox/flox ; Pnpla2 flox/flox ). The Prmt5 flox/flox mice are phenotypically indistinguishable from the Myl1 Cre and syngeneic wildtype mice. The primers for genotyping are listed in Table EV1. Mice were housed in the animal facility with free access to water and standard rodent chow food or high fat diet (HFD, TD.06414 Harlan). Two‐month‐old mice were used unless otherwise indicated. Food intake was calculated by measuring weekly food consumption normalized to body weight in each cage.
Indirect calorimetry study
Oxygen consumption (VO2) and carbon dioxide production (VCO2) levels were assessed by using an indirect calorimetry system (Oxymas, Columbus instruments), as previously described (Nie et al, 2015). Mice were individually housed in chambers and had free access to food and water under a constant environmental room temperature.
Isolation and culture of primary myoblasts
Primary myoblasts were isolated from hind limb skeletal muscles of 4‐week‐old mice as previously described (Kim et al, 2020). Muscle tissues were minced and digested in type II collagenase and dispase B mixture (Roche). Digestion was neutralized by adding growth media containing F‐10 Ham's medium (ThermoFisher Scientific), 20% fetal bovine serum (FBS), 1% penicillin, 4 ng/ml basic fibroblast growth factor (ThermoFisher Scientific), and cells were cultured on collagen‐coated plates. Preplating was performed to purify primary myoblasts. For differentiation, primary myoblasts were plated on the BD Matrigel‐coated culture plates and differentiated in DMEM supplemented with 2% horse serum and 1% penicillin.
Single myofiber isolation
Single myofibers were isolated from EDL muscles of WT and Prmt5 MKO mice. Briefly, EDL muscles were carefully dissected and incubated in digestion medium containing 1.5 mg/ml collagenase I in Dulbecco's Modified Eagle's Medium (DMEM, Sigma) at 37°C at the indicated mins (WT for 50 min and Prmt5 MKO mice for 80 min). EDL muscles were carefully transferred to a preheated plate with 5 ml of DMEM, and single myofibers were released by gently flushing the muscles with a large pore glass pipette. Freshly isolated myofibers were collected for immunofluorescent staining.
Cell cultures and transfection
C2C12 cells were cultured in Dulbecco's modified Eagle's medium (DMEM) supplemented with 10% FBS (Hyclone) and 1% penicillin, in a 37°C humidified incubator with 5% CO2. For differentiation, C2C12 cells were plated on the BD Matrigel‐coated culture plates and differentiated in DMEM supplemented with 2% horse serum, 400 nM insulin, and 1% penicillin. Plasmids and lipofectamine 2000 mixture were transfected in C2C12, based on the manufacturer's instructions, and harvested after 24 h. For transfection, pcDNA‐GFP‐PRMT5 plasmid and pcDNA3.1‐2xFLAG‐SREBP1a plasmid were mixed with lipofectamine 2000 Reagent in Opti‐MEM media (Giobco) and transfected into 60% confluent cells following the protocol from manufacture. Opti‐MEM media was changed to growth medium after 4 h and cells were harvested after 24 h for further analysis.
scRNA‐Seq data analysis
scRNA‐seq datasets for muscle satellite cell differentiation were downloaded from publicly available data (GSE150366). For data analysis, barcodes and reads were aligned to mm10 (Mus Musculus) using CellRanger v3.1, and data analysis was performed using Seurat v3.1 as previously described (Yue et al, 2022).
H&E, immunofluorescence, and oil red O (ORO) staining
Whole muscle tissues were immediately frozen in optical cutting temperature compound (OCT compound), and subsequently cut into 10‐μm‐thick cross sections using a Leica CM1850 cryostat for H&E, immunofluorescence, and Oil red O staining. For H&E staining, the slides were stained in hematoxylin and eosin for 15 and 1 min, respectively, and dehydrated in xylene as previously indicated (Wang et al, 2017). For immunofluorescence staining, cross sections of muscle tissues (TA, EDL, SOL) were fixed in 4% PFA for 15 min and quenched with 100 mM glycine for 10 min. Fixed tissue sections were then incubated with Blocking Buffer (5% goat serum, 2% bovine serum albumin, 0.1% Triton X‐100, and 0.1% sodium azide, 1X PBS) for 2 h. Tissue sections were incubated with primary antibodies diluted in blocking buffer overnight at 4°C and incubated with secondary antibodies and DAPI for 1 h at room temperature. For Oil Red O (ORO) staining, muscle tissues were fixed in 4% PFA for 30 min and stained using Oil red O working solutions for 60 min. After washing with running water for 2 min, it was counterstained with hemoxylin, and imaged. All images are representative results of at least four biological replicates. For Succinate dehydrogenase (SDH) staining, muscle tissues were stained with SDH solution (10 ml 0.2 M phosphate buffer, 270 mg sodium succinate, 10 mg NBT) for 10–15 min. The slides were rinsed with deionized H2O and mount the coverslips with mounting medium.
Muscle injury and regeneration
Muscle injury was induced by CTX injection. After mice were anesthetized by ketamine‐xylazine cocktail injection, CTX (50 μl of 10 μM solution, Sigma) was injected into TA muscle, and TA muscle was harvested at 5.5‐day postinjury to determine regeneration capacity.
Treadmill test and grip strength measurement
Treadmill exercise testing was performed as previously described (Castro & Kuang, 2017). WT, Prmt5 MKO and Prmt5/Pnpla2 MKO mice (2 months old), were placed on a treadmill (Eco3/6; Columbus Instruments, Columbus, OH) for 10 min for 3 consecutive days at constant 10 m/min speed for acclimation. On the testing day, mouse ran on the treadmill at 10 m/min for 5 min and the speed was then increased by 2 m/min every 2 min until mice were exhausted. Exercise capacity, including running distance, running time, and maximum speed, was measured. For grip strength, WT, Prmt5 MKO , and Prmt5/Pnpla2 MKO mice (2 months old) were tested to measure using a DFE II series Digital Force Gauge (Ametek DFE II 2‐LBF 10‐N) with an attached metal grid. The mouse was allowed to grasp the metal grid an, and the mouse tail was gently pulled along the axis of the grid. The peak tension at the time of release was recorded. The grip strength was measured three times and the average strength was normalized to body weight (N/g).
Co‐immunoprecipitation, protein extraction, and western blot analysis
For Co‐IP, C2C12 cells were transfected with pcDNA‐GFP‐PRMT5 and pcDNA3.1‐2xFLAG‐SREBP1a, and cells were harvested after 24 h. A total of 500 μg protein lysate was precleared with protein A/G agarose bead at 4°C for 2 h, and 1 μg of primary anti‐FLAG, or anti‐GFP was added into the protein lysate, and rotate for 4 h, followed by addition of protein A/G agarose bead and rotate for overnight.
Total protein was extracted from homogenized muscle tissue using RIPA buffer containing 25 mM Tris–HCl (pH 8.0), 150 mM NaCl, 1 mM EDTA, 0.5% NP‐40, and 0.1% SDS, supplemented with proteinase inhibitor and phenylmethylsulphonyl fluoride (PMSF). The concentration of supernatant proteins was quantified using Peirce BCA Protein Assay Reagent (Pierce Biotechnology). Proteins were separated by electrophoresis, transferred to polyvinylidene fluoride (PVDF) membrane, blocked with 5% fat‐free milk for 1 h at room temperature and incubated with primary antibodies overnight at 4°C. Antibodies used for western blot analysis were listed in Table EV2. Immunodetection was detected using enhanced chemiluminescence western blotting substrate (Santa Cruz Biotechnology) on a FluorChem R system (Proteinsimple).
Chromatin immunoprecipitation
C2C12 cell‐derived myotubes and muscle tissue from both WT and Prmt5 MKO mice were crosslinked with 1% formaldehyde for 10 min at room temperature and quenched by the addition of 125 mM glycine for 5 min at room temperature. After the samples were washed cold PBS, they were incubated with ChIP cell lysis buffer (20 mM Tris pH 8.0, 0.1%, 85 mM KCl, 0.5% NP40) supplemented with protease inhibitor. After centrifugation, the nuclei were resuspended in nuclei lysis buffer (50 mM Tris pH 8.0, 10 mM EDTA, 1% SDS) and sonicated. The supernatant was used for immunoprecipitation with the indicated antibodies (PRMT5, H4R3Me2s). The immunoprecipitants were eluted and reverse crosslinked overnight at 65°C. Phenol–chloroform method was used to purify DNA fragments and qRT‐PCR was performed as indicated. A list of primers used is provided in Table EV1. Results were presented as mean ± SD from three independent experiments.
Assessment of muscle contractile function
Contractile properties of the slow‐twitch soleus and the fast‐twitch EDL muscles were measured by using an in vitro muscle test system (1200A Intact Muscle Test System, Aurora Scientific). Briefly, the hindlimb was excised under isoflurane anesthesia, and placed in a bicarbonate‐buffered solution (137 mM NaCl, 5 mM KCl, 1 mM MgSO4, 1 mM NaH2PO4, 24 mM NaHCO3, and 2 mM CaCl2) equilibrated with 95% O2‐5% CO2. The assessment of contractile function of the EDL muscle was performed first followed by the Soleus muscle. After surgical isolation, braided silk suture thread (4–0, Fine Science Tools) was tied around each end of the muscle tendons. The muscles were then transferred to a tissue bath apparatus containing a bicarbonate‐buffered solution at room temperature continuously bubbled with carbogen (95% O2‐5%CO2) and mounted between two platinum electrodes (1200A Intact Muscle Test System; Aurora Scientific). After the optimal muscle length was determined, the temperature of the glass bath was increased to 32°C, and the muscles were thermally equilibrated for 10 min. The force–frequency relationship was then generated by selected frequencies between 1 and 300 Hz for the EDL muscle, and 1–200 Hz for Soleus muscle. After completion of the assessment, the muscle was removed from the organ bath, trimmed of connective tissue, blotted dry, and weighed. Muscle cross‐sectional area (CSA) was determined by dividing the wet muscle mass by the product of Lo and muscle‐specific density (1.056 g/cm3). Specific force (N/cm2) was calculated by dividing the muscle force (N) by the CSA (cm2).
Whole body composition analysis
The Echo‐MRI 130 analyzer (EchoMRI LLC, Houston, TX, USA) was used to measure body composition of live mice. After the calibrating the instrument with corn oil, the mouse was gently placed into a cylindrical holder. The holder was inserted into the EcoMRI™ system to measure lean mass, fat mass, and water weight.
Total RNA extraction and qRT‐PCR
Total RNA was extracted from cells and tissues using TRIzol reagent (Thermo Fisher Scientific) according to the manufacturer's instruction. A total of 2 μg of total RNA was reversed transcribed with random primers, M‐MLV reverse transcriptase and DTT. Real‐time qPCR was carried out in a Roche Light cycler 480 PCR system with SYBR green master mix and gene‐specific primers, listed in Table EV2. Relative changes in gene expression were analyzed using the method and normalized to β‐actin.
Seahorse OCR measurement
Primary myoblasts cells (1 × 10⁵ cells) isolated from WT and Prmt5 MKO mice were seeded in Matrigel coated XF24 microplates (SeaHorse, bioscience). After differentiation for 3 days, myotubes were washed three times with XF medium (supplemented with SeaHorse XF RPMI medium, 5 mM glucose, 2 mM pyruvate, 1 mM glutamine, pH 7.4), and pre‐incubated in XF medium for 1 h at 37°C in a non‐CO2 incubator. Oligomycin (3 μM), FCCP (3 μM), Rotenone (1.5 μM), Antimycin A (1.5 μM) were preloaded into cartridges and injected sequentially into XF wells to monitor oxygen consumption rate, OCR (pmol/min). All mitochondria respiration rates were calculated by the SeaHorse Wave software and normalized to the cellular protein contents.
Statistical analysis
All data are presented as mean ± standard error of the mean (SEM). All quantitative analyses were conducted with Student's t‐test and a two‐tail distribution calculated using the GraphPad Prism. Comparisons with P‐values < 0.05 were considered statistically significant.
Author contributions
Kun Ho Kim: Conceptualization; data curation; formal analysis; validation; investigation; visualization; writing – original draft; project administration. Zhihao Jia: Conceptualization. Madigan Snyder: Formal analysis; investigation. Jingjuan Chen: Formal analysis; investigation. Jiamin Qiu: Formal analysis; investigation. Stephanie N Oprescu: Formal analysis; investigation. Xiyue Chen: Formal analysis; investigation. Sabriya A Syed: Formal analysis; investigation. Feng Yue: Conceptualization. Bruno T Roseguini: Formal analysis; methodology. Anthony N Imbalzano: Conceptualization; methodology. Changdeng Hu: Conceptualization; methodology. Shihuan Kuang: Conceptualization; formal analysis; supervision; project administration; writing – review and editing.
Disclosure and competing interests statement
The authors declare that they have no conflict of interest.
Supporting information
Appendix S1
Expanded View Figures PDF
Table EV1
Table EV2
PDF+
Acknowledgments
This work was supported by grants from the US National Institutes of Health to S.K. (R01AR078695, R01DK132819, R01AR079235) and S.O. (F31AR077424), and Purdue University Center for Cancer Research (P30CA023168). We also thank Jun Wu, and Mary Larimore for mouse colony maintenance and technical support, and members of the Kuang Laboratory for critical comments.
EMBO reports (2023) 24: e57306
Footnotes
Correction added on 3 August 2023, after first online publication: “similar” has been added to this sentence.
Data availability
No new data or codes were generated for this study.
References
- Ancelin K, Lange UC, Hajkova P, Schneider R, Bannister AJ, Kouzarides T, Surani MA (2006) Blimp1 associates with Prmt5 and directs histone arginine methylation in mouse germ cells. Nat Cell Biol 8: 623–630 [DOI] [PubMed] [Google Scholar]
- Badin P‐M, Loubière C, Coonen M, Louche K, Tavernier G, Bourlier V, Mairal A, Rustan AC, Smith SR, Langin D et al (2012) Regulation of skeletal muscle lipolysis and oxidative metabolism by the co‐lipase CGI‐58. J Lipid Res 53: 839–848 [DOI] [PMC free article] [PubMed] [Google Scholar]
- Baskin KK, Winders BR, Olson EN (2015) Muscle as a “mediator” of systemic metabolism. Cell Metab 21: 237–248 [DOI] [PMC free article] [PubMed] [Google Scholar]
- Bassel‐Duby R, Olson EN (2006) Signaling pathways in skeletal muscle remodeling. Annu Rev Biochem 75: 19–37 [DOI] [PubMed] [Google Scholar]
- Bi P, Yue F, Sato Y, Wirbisky S, Liu W, Shan T, Wen Y, Zhou D, Freeman J, Kuang S (2016) Stage‐specific effects of notch activation during skeletal myogenesis. Elife 5: e17355 [DOI] [PMC free article] [PubMed] [Google Scholar]
- Bonaldo P, Sandri M (2013) Cellular and molecular mechanisms of muscle atrophy. Dis Model Mech 6: 25–39 [DOI] [PMC free article] [PubMed] [Google Scholar]
- Cai S, Wang P, Xie T, Li Z, Li J, Lan R, Ding Y, Lu J, Ye J, Wang J et al (2020) Histone H4R3 symmetric di‐methylation by Prmt5 protects against cardiac hypertrophy via regulation of Filip1L/β‐catenin. Pharmacol Res 161: 105104 [DOI] [PubMed] [Google Scholar]
- Castro B, Kuang S (2017) Evaluation of muscle performance in mice by treadmill exhaustion test and whole‐limb grip strength assay. Bio Protoc 7: e2237 [DOI] [PMC free article] [PubMed] [Google Scholar]
- Chargé SBP, Rudnicki MA (2004) Cellular and molecular regulation of muscle regeneration. Physiol Rev 84: 209–238 [DOI] [PubMed] [Google Scholar]
- Choi S, Jeong H‐J, Kim H, Choi D, Cho S‐C, Seong JK, Koo S‐H, Kang J‐S (2019) Skeletal muscle‐specific Prmt1 deletion causes muscle atrophy via deregulation of the PRMT6‐FOXO3 axis. Autophagy 15: 1069–1081 [DOI] [PMC free article] [PubMed] [Google Scholar]
- Consitt LA, Bell JA, Houmard JA (2009) Intramuscular lipid metabolism, insulin action, and obesity. IUBMB Life 61: 47–55 [DOI] [PMC free article] [PubMed] [Google Scholar]
- Dacwag CS, Ohkawa Y, Pal S, Sif S, Imbalzano AN (2007) The protein arginine methyltransferase Prmt5 is required for myogenesis because it facilitates ATP‐dependent chromatin remodeling. Mol Cell Biol 27: 384–394 [DOI] [PMC free article] [PubMed] [Google Scholar]
- Das SK, Eder S, Schauer S, Diwoky C, Temmel H, Guertl B, Gorkiewicz G, Tamilarasan KP, Kumari P, Trauner M et al (2011) Adipose triglyceride lipase contributes to cancer‐associated cachexia. Science 333: 233–238 [DOI] [PubMed] [Google Scholar]
- Debashree B, Kumar M, Keshava Prasad TS, Natarajan A, Christopher R, Nalini A, Bindu PS, Gayathri N, Srinivas Bharath MM (2018) Mitochondrial dysfunction in human skeletal muscle biopsies of lipid storage disorder. J Neurochem 145: 323–341 [DOI] [PubMed] [Google Scholar]
- Deng X, Shao G, Zhang H‐T, Li C, Zhang D, Cheng L, Elzey BD, Pili R, Ratliff TL, Huang J et al (2017) Protein arginine methyltransferase 5 functions as an epigenetic activator of the androgen receptor to promote prostate cancer cell growth. Oncogene 36: 1223–1231 [DOI] [PMC free article] [PubMed] [Google Scholar]
- Dubé JJ, Sitnick MT, Schoiswohl G, Wills RC, Basantani MK, Cai L, Pulinilkunnil T, Kershaw EE (2015) Adipose triglyceride lipase deletion from adipocytes, but not skeletal myocytes, impairs acute exercise performance in mice. Am J Physiol Endocrinol Metab 308: E879–E890 [DOI] [PMC free article] [PubMed] [Google Scholar]
- Eaton S (2002) Control of mitochondrial β‐oxidation flux. Prog Lipid Res 41: 197–239 [DOI] [PubMed] [Google Scholar]
- Fan H, Zhang Z, Wang N, Cui Y, Sun H, Liu Y, Wu H, Zheng S, Bao S, Ling H (2014) SKB1/PRMT 5‐mediated histone H 4 R 3 dimethylation of I b subgroup bHLH genes negatively regulates iron homeostasis in Arabidopsis thaliana . Plant J 77: 209–221 [DOI] [PubMed] [Google Scholar]
- Gan YM, Zhou J, Quan R, Hong LJ, Li ZC, Zheng EQ, Liu W, Wu ZF, Cai GY, Gu T (2019) Histone H3K27me3 in the regulation of skeletal muscle development. Yi Chuan 41: 285–292 [DOI] [PubMed] [Google Scholar]
- Guccione E, Richard S (2019) The regulation, functions and clinical relevance of arginine methylation. Nat Rev Mol Cell Biol 20: 642–657 [DOI] [PubMed] [Google Scholar]
- Hagen RM, Rodriguez‐Cuenca S, Vidal‐Puig A (2010) An allostatic control of membrane lipid composition by SREBP1. FEBS Lett 584: 2689–2698 [DOI] [PubMed] [Google Scholar]
- Hawley JA (2002) Adaptations of skeletal muscle to prolonged, intense endurance training. Clin Exp Pharmacol Physiol 29: 218–222 [DOI] [PubMed] [Google Scholar]
- Jeong H‐J, Lee H‐J, Vuong TA, Choi K‐S, Choi D, Koo S‐H, Cho SC, Cho H, Kang J‐S (2016) Prmt7 deficiency causes reduced skeletal muscle oxidative metabolism and age‐related obesity. Diabetes 65: 1868–1882 [DOI] [PubMed] [Google Scholar]
- Jeong H‐J, Lee S‐J, Lee H‐J, Kim H‐B, Vuong TA, Cho H, Bae G‐U, Kang J‐S (2020) Prmt7 promotes myoblast differentiation via methylation of p38MAPK on arginine residue 70. Cell Death Differ 27: 573–586 [DOI] [PMC free article] [PubMed] [Google Scholar]
- Ji LL, Yeo D (2019) Mitochondrial dysregulation and muscle disuse atrophy. F1000Res 8: [DOI] [PMC free article] [PubMed] [Google Scholar]
- Jia Z, Yue F, Chen X, Narayanan N, Qiu J, Syed SA, Imbalzano AN, Deng M, Yu P, Hu C et al (2020) Protein arginine methyltransferase PRMT5 regulates fatty acid metabolism and lipid droplet biogenesis in white adipose tissues. Adv Sci 7: 2002602 [DOI] [PMC free article] [PubMed] [Google Scholar]
- Jocken JWE, Smit E, Goossens GH, Essers YPG, van Baak MA, Mensink M, Saris WHM, Blaak EE (2008) Adipose triglyceride lipase (ATGL) expression in human skeletal muscle is type I (oxidative) fiber specific. Histochem Cell Biol 129: 535–538 [DOI] [PMC free article] [PubMed] [Google Scholar]
- Kelly RG, Zammit PS, Schneider A, Alonso S, Biben C, Buckingham ME (1997) Embryonic and fetal myogenic programs act through separate enhancers at the MLC1F/3F locus. Dev Biol 187: 183–199 [DOI] [PubMed] [Google Scholar]
- Kim G, Kim JH (2020) Impact of skeletal muscle mass on metabolic health. Endocrinol Metab 35: 1–6 [DOI] [PMC free article] [PubMed] [Google Scholar]
- Kim J, Wei Y, Sowers JR (2008) Role of mitochondrial dysfunction in insulin resistance. Circ Res 102: 401–414 [DOI] [PMC free article] [PubMed] [Google Scholar]
- Kim KH, Qiu J, Kuang S (2020) Isolation, culture, and differentiation of primary myoblasts derived from muscle satellite cells. Bio Protoc 10: e3686 [DOI] [PMC free article] [PubMed] [Google Scholar]
- Lee DY, Teyssier C, Strahl BD, Stallcup MR (2005) Role of protein methylation in regulation of transcription. Endocr Rev 26: 147–170 [DOI] [PubMed] [Google Scholar]
- Litt M, Qiu Y, Huang S (2009) Histone arginine methylations: their roles in chromatin dynamics and transcriptional regulation. Biosci Rep 29: 131–141 [DOI] [PMC free article] [PubMed] [Google Scholar]
- Liu L, Zhao X, Zhao L, Li J, Yang H, Zhu Z, Liu J, Huang G (2016) Arginine methylation of SREBP1a via PRMT5 promotes de novo lipogenesis and tumor growth. Cancer Res 76: 1260–1272 [DOI] [PubMed] [Google Scholar]
- Liu L, Yan H, Ruan M, Yang H, Wang L, Lei B, Sun X, Chang C, Huang G, Xie W (2021) An AKT/PRMT5/SREBP1 axis in lung adenocarcinoma regulates de novo lipogenesis and tumor growth. Cancer Sci 112: 3083–3098 [DOI] [PMC free article] [PubMed] [Google Scholar]
- di Lorenzo A, Bedford MT (2011) Histone arginine methylation. FEBS Lett 585: 2024–2031 [DOI] [PMC free article] [PubMed] [Google Scholar]
- Marcinko K, Bujak AL, Lally JS, Ford RJ, Wong TH, Smith BK, Kemp BE, Jenkins Y, Li W, Kinsella TM et al (2015) The AMPK activator R419 improves exercise capacity and skeletal muscle insulin sensitivity in obese mice. Mol Metab 4: 643–651 [DOI] [PMC free article] [PubMed] [Google Scholar]
- Meex RC, Hoy AJ, Mason RM, Martin SD, McGee SL, Bruce CR, Watt MJ (2015) ATGL‐mediated triglyceride turnover and the regulation of mitochondrial capacity in skeletal muscle. Am J Physiol Endocrinol Metab 308: E960–E970 [DOI] [PubMed] [Google Scholar]
- Min K, Smuder AJ, Kwon O, Kavazis AN, Szeto HH, Powers SK (2011) Mitochondrial‐targeted antioxidants protect skeletal muscle against immobilization‐induced muscle atrophy. J Appl Physiol 111: 1459–1466 [DOI] [PMC free article] [PubMed] [Google Scholar]
- Moore LD, Le T, Fan G (2013) DNA methylation and its basic function. Neuropsychopharmacology 38: 23–38 [DOI] [PMC free article] [PubMed] [Google Scholar]
- Morales PE, Bucarey JL, Espinosa A (2017) Muscle lipid metabolism: role of lipid droplets and perilipins. J Diabetes Res 2017: 1–10 [DOI] [PMC free article] [PubMed] [Google Scholar]
- Murn J, Shi Y (2017) The winding path of protein methylation research: milestones and new frontiers. Nat Rev Mol Cell Biol 18: 517–527 [DOI] [PubMed] [Google Scholar]
- Ng SS, Yue WW, Oppermann U, Klose RJ (2009) Dynamic protein methylation in chromatin biology. Cell Mol Life Sci 66: 407–422 [DOI] [PMC free article] [PubMed] [Google Scholar]
- Nie Y, Gavin TP, Kuang S (2015) Measurement of resting energy metabolism in mice using oxymax open circuit indirect calorimeter. Bio Protoc 5: e1602 [DOI] [PMC free article] [PubMed] [Google Scholar]
- Olzmann JA, Carvalho P (2019) Dynamics and functions of lipid droplets. Nat Rev Mol Cell Biol 20: 137–155 [DOI] [PMC free article] [PubMed] [Google Scholar]
- Onal G, Kutlu O, Gozuacik D, Dokmeci Emre S (2017) Lipid droplets in health and disease. Lipids Health Dis 16: 1–15 [DOI] [PMC free article] [PubMed] [Google Scholar]
- Park B‐H, Song M‐Y, Han CY, Moon YJ, Bae EJ (2021) Sirt6 reprograms myofibers to oxidative type through CREB‐dependent Sox6 suppression. Nat Commun 13: 1808 [DOI] [PMC free article] [PubMed] [Google Scholar]
- Paul C, Sardet C, Fabbrizio E (2012) The histone‐and PRMT5‐associated protein COPR5 is required for myogenic differentiation. Cell Death Differ 19: 900–908 [DOI] [PMC free article] [PubMed] [Google Scholar]
- Sandri M (2008) Signaling in muscle atrophy and hypertrophy. Phys Ther 23: 160–170 [DOI] [PubMed] [Google Scholar]
- Schiaffino S, Reggiani C (2011) Fiber types in mammalian skeletal muscles. Physiol Rev 91: 1447–1531 [DOI] [PubMed] [Google Scholar]
- Seibert JT, Najt CP, Heden TD, Mashek DG, Chow LS (2020) Muscle lipid droplets: cellular signaling to exercise physiology and beyond. Trends Endocrinol Metab 31: 928–938 [DOI] [PMC free article] [PubMed] [Google Scholar]
- Sitnick MT, Basantani MK, Cai L, Schoiswohl G, Yazbeck CF, Distefano G, Ritov V, DeLany JP, Schreiber R, Stolz DB et al (2013) Skeletal muscle triacylglycerol hydrolysis does not influence metabolic complications of obesity. Diabetes 62: 3350–3361 [DOI] [PMC free article] [PubMed] [Google Scholar]
- Stouth DW, Manta A, Ljubicic V (2018) Protein arginine methyltransferase expression, localization, and activity during disuse‐induced skeletal muscle plasticity. Am J Physiol Cell Physiol 314: C177–C190 [DOI] [PMC free article] [PubMed] [Google Scholar]
- Tao Y, Neppl RL, Huang Z‐P, Chen J, Tang R‐H, Cao R, Zhang Y, Jin S‐W, Wang D‐Z (2011) The histone methyltransferase Set7/9 promotes myoblast differentiation and myofibril assembly. J Cell Biol 194: 551–565 [DOI] [PMC free article] [PubMed] [Google Scholar]
- Uhlén M, Fagerberg L, Hallström BM, Lindskog C, Oksvold P, Mardinoglu A, Sivertsson Å, Kampf C, Sjöstedt E, Asplund A et al (2015) Tissue‐based map of the human proteome. Science 347: 1260419 [DOI] [PubMed] [Google Scholar]
- Vanlieshout TL, Stouth DW, Tajik T, Ljubicic V (2018) Exercise‐induced protein arginine methyltransferase expression in skeletal muscle. Med Sci Sports Exerc 50: 447–457 [DOI] [PubMed] [Google Scholar]
- VanLieshout TL, Bonafiglia JT, Gurd BJ, Ljubicic V (2019) Protein arginine methyltransferase biology in humans during acute and chronic skeletal muscle plasticity. J Appl Physiol 127: 867–880 [DOI] [PMC free article] [PubMed] [Google Scholar]
- Vasiljevski ER, Summers MA, Little DG, Schindeler A (2018) Lipid storage myopathies: current treatments and future directions. Prog Lipid Res 72: 1–17 [DOI] [PubMed] [Google Scholar]
- Wang Y, Pessin JE (2013) Mechanisms for fiber‐type specificity of skeletal muscle atrophy. Curr Opin Clin Nutr Metab Care 16: 243–250 [DOI] [PMC free article] [PubMed] [Google Scholar]
- Wang L, Pal S, Sif S (2008) Protein arginine methyltransferase 5 suppresses the transcription of the RB family of tumor suppressors in leukemia and lymphoma cells. Mol Cell Biol 28: 6262–6277 [DOI] [PMC free article] [PubMed] [Google Scholar]
- Wang S‐CM, Dowhan DH, Eriksson NA, Muscat GEO (2012) CARM1/PRMT4 is necessary for the glycogen gene expression programme in skeletal muscle cells. Biochem J 444: 323–331 [DOI] [PubMed] [Google Scholar]
- Wang C, Yue F, Kuang S (2017) Muscle histology characterization using H&E staining and muscle fiber type classification using immunofluorescence staining. Bio Protoc 7: e2279 [DOI] [PMC free article] [PubMed] [Google Scholar]
- Watt MJ, Hoy AJ (2012) Lipid metabolism in skeletal muscle: generation of adaptive and maladaptive intracellular signals for cellular function. Am J Physiol Endocrinol Metab 302: E1315–E1328 [DOI] [PubMed] [Google Scholar]
- Webb LM, Sengupta S, Edell C, Piedra‐Quintero ZL, Amici SA, Miranda JN, Bevins M, Kennemer A, Laliotis G, Tsichlis PN et al (2020) Protein arginine methyltransferase 5 promotes cholesterol biosynthesis–mediated Th17 responses and autoimmunity. J Clin Invest 130: 1683–1698 [DOI] [PMC free article] [PubMed] [Google Scholar]
- Welte MA, Gould AP (2017) Lipid droplet functions beyond energy storage. Biochim Biophys Acta Mol Cell Biol Lipids 1862: 1260–1272 [DOI] [PMC free article] [PubMed] [Google Scholar]
- Yuan H, Zhao M, Zhao L, Yun H, Yang G, Geng Y, Wang Y, Zheng W, Yuan Y, Song T et al (2022) PRMT5 confers lipid metabolism reprogramming, tumour growth and metastasis depending on the SIRT7‐mediated desuccinylation of PRMT5 K387 in tumours. Acta Pharmacol Sin 43: 1–13 [DOI] [PMC free article] [PubMed] [Google Scholar]
- Yue F, Oprescu SN, Qiu J, Gu L, Zhang L, Chen J, Narayanan N, Deng M, Kuang S (2022) Lipid droplet dynamics regulate adult muscle stem cell fate. Cell Rep 38: 110267 [DOI] [PMC free article] [PubMed] [Google Scholar]
- Zhang T, Günther S, Looso M, Künne C, Krüger M, Kim J, Zhou Y, Braun T (2015) Prmt5 is a regulator of muscle stem cell expansion in adult mice. Nat Commun 6: 1–14 [DOI] [PMC free article] [PubMed] [Google Scholar]
- Zhang X, Wu J, Wu C, Chen W, Lin R, Zhou Y, Huang X (2018) The LINC01138 interacts with PRMT5 to promote SREBP1‐mediated lipid desaturation and cell growth in clear cell renal cell carcinoma. Biochem Biophys Res Commun 507: 337–342 [DOI] [PubMed] [Google Scholar]