Abstract
Cryo-electron microscopy (cryo-EM) allows a macromolecular structure such as protein-DNA/RNA complexes to be reconstructed in a three-dimensional coulomb potential map. The structural information of these macromolecular complexes forms the foundation for understanding the molecular mechanism including many human diseases. However, the model building of large macromolecular complexes is often difficult and time-consuming. We recently developed DeepTracer-2.0, an artificial-intelligence-based pipeline that can build amino acid and nucleic acid backbones from a single cryo-EM map, and even predict the best-fitting residues according to the density of side chains. The experiments showed improved accuracy and efficiency when benchmarking the performance on independent experimental maps of protein-DNA/RNA complexes and demonstrated the promising future of macromolecular modeling from cryo-EM maps. Our method and pipeline could benefit researchers worldwide who work in molecular biomedicine and drug discovery, and substantially increase the throughput of the cryo-EM model building. The pipeline has been integrated into the web portal https://deeptracer.uw.edu/.
Keywords: cryo-EM, macromolecular modeling, protein-DNA/RNA, machine learning, artificial intelligence
Introduction
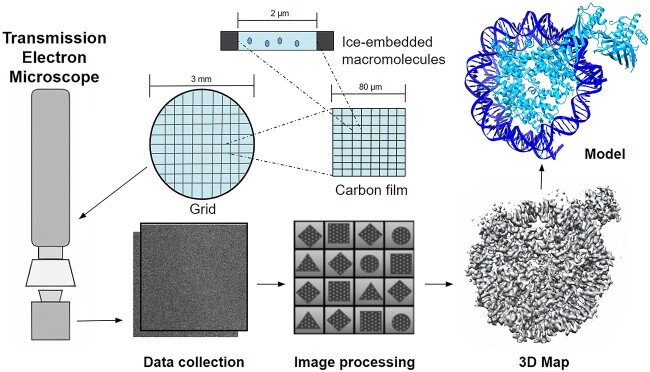
In 2003, the Worldwide Protein Data Bank [1] (wwPDB) was formed to ensure that the PDB data would be publicly available and archived for researchers to use [2]. In 2012, the resolution revolution in cryo-electron microscopy (cryo-EM) allowed an exponential growth of biological macromolecules structural data, which also extended the protein structure to other types of macromolecules such as RNA/DNA. As of 24 August 2022, there are currently 21807 published cryo-EM maps. However, only 12166 structural models are available to these maps [3, 4]. Figure 1 shows an overall process of how Cryo-EM data are processed to make a protein-DNA/RNA complex model (Figure 1).
Figure 1.
The overall cryo-em macromolecular data processing pipeline. This process illustrates the use of the microscope to analyze a portion of a biological structure, get the area of interest and transform the image data into a 3D density map. Once complete, the map will contain both the protein-DNA/RNA complex.
DeepTracer is a fully automated deep-learning-based method for a fast de novo multi-chain protein complex structure modeling from cryo-EM maps [5]. When comparing DeepTracer with the state-of-the-art methods of Phenix [4], Rosetta [6] and MAINMAST modeling [7], DeepTracer’s protein carbon alpha (Cα) prediction is more accurate, with higher percent matching averages of Cα at 85–90% and lower root-mean-square deviation (RMSD) values based on the Cα position [5]. However, the previous DeepTracer-1.0 did not account for map regions that involve other macromolecules, such as nucleic acids. This could lead to problems as DNA/RNA, carbohydrates and fatty acids can potentially be misidentified as amino acids, thereby making an inaccurate prediction with a given cryo-EM map. In this paper, we propose DeepTracer-2.0 to extend the functionality of DeepTracer-1.0 by incorporating the identification of nucleic acids along with amino acids. DeepTracer-2.0 adds segmentation steps for separating cryo-EM maps and a nucleotide U-Net architecture that identifies phosphate and carbon atom positions in the segmented nucleotide cryo-EM map [8]. Combined with the preprocessing and postprocessing steps, the DeepTracer-2.0 pipeline achieves fast and accurate macromolecular structure prediction given variable-size cryo-EM inputs. The website https://deeptracer.uw.edu allows users to perform automated macromolecular complex modeling using 3D cryo-EM maps and provides them the option to choose between predicting a complex of amino acids and nucleotides, an amino-acid-only or a nucleotide-only structure.
Challenges of protein-DNA/RNA macromolecular modeling
In our early work, we have recognized several key challenges of protein-DNA/RNA macromolecular modeling from cryo-EM maps. This includes separating out the voxels, identifying the critical atoms for each type of macromolecule and then building the correct chains of macromolecules based on atom positions. It is challenging to distinguish different macromolecules without the accurate separation of the voxels, leading to false positive predictions and the misinterpretation of the voxels as part of the structure.
Several computational methods have been proposed to reconstruct macromolecular structures from cryo-EM maps [9]. Phenix’s Map_To_Model is the only other software that takes a cryo-EM map and then converts the map into a macromolecular model that contains both Protein and DNA/RNA [4]. The other modeling systems either predict one macromolecule type, or identify the secondary structure of the cryo-EM map, but they do not predict both. For clarification, Phenix [4], Rosetta de-novo [6], MAINMAST [7] and EM-Fold [10] utilize Cryo-EM to predict proteins. Programs like AAnchor [11] and RENNSH [12] focus on secondary structure building. CR-I-TASSER [13] and EMBuild [14] build 3D protein structures. Emap2sec+ is capable of predicting DNA/RNA along with protein, but it only predicts secondary structures [15].
Amino acids are building blocks that combine to form the protein. Each amino acid has a carbon alpha (Cα) also known as the central carbon, an amino group and carboxyl group. For each amino acid variation, their R-group defines their characteristic, such as nonpolar, polar acidic, basic or aromatic. Results are better when the resolution is at 4 Å or higher. High resolution has allowed for strategies such as atomic structure modeling, de novo main-chain tracing, structure refinement or a combination of the strategies to identify amino acids [16]. Fasta files are text-based that represent either nucleotide or peptide sequences, in which base pairs or amino acids represent a single-letter code, the description line and sequence are distinguished by a greater than (>) symbol [17]. In fasta files, they are represented as a single letter abbreviation. Although there are 21 different common amino acids in proteins, the previous DeepTracer-1.0 pipeline [5] focuses on identifying 20 amino acids from the density maps, with selenocystene (SeH), left out of predictions [18]. Each amino acid is attached to another amino acid by a peptide bond, through the carboxyl group and amino group. This resulting chain of amino acids is called a polypeptide chain. Each polypeptide will have a free amino end, the N terminal, as well as a free carboxyl group, the C terminal [19].
In 2021, about 13% of cryo-EM maps had protein–nucleic acid interactions [16]. Currently, around 3046 released cryo-EM maps with either DNA or RNA included out of 21 806 maps, which brings the map total to 14% of experimental maps [20]. Nucleic acids are macromolecules made up of building blocks called nucleotides. They carry the genetic information of a cell and the instructions for a functioning cell. The two main types of nucleic acids are deoxyribonucleic acid (DNA) and ribonucleic acid (RNA). Each nucleotide consists of three components: a nitrogenous base, a pentose sugar and a phosphate group. DNA consists of four possible nitrogenous bases, adenine, cytosine, guanine and thymine, while RNA has the same three bases, but has uracil in place of thymine. The nitrogenous base is attached to the 1′ carbon and the phosphate group is attached to the 5′ carbon. Nucleic acids are linear chains of nucleotides, and are held together by phosphodiester linkages between the 3′ carbon nucleotide and 5′ carbon nucleotide phosphate group of another nucleotide. The first nucleotide will have a free phosphate at the end of its 5′ carbon, whereas the last nucleotide will have a free 3′ hydroxyl group at its 3′ carbon [21]. Figure 2 shows the overview of an amino acid and a DNA structure, followed by a closeup of a chain of three amino acids and a chain of three nucleic acids (Figure 2).
Figure 2.
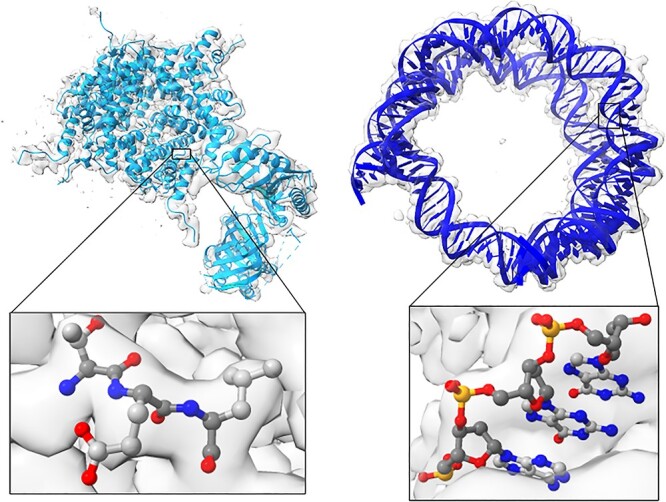
Structural models of amino acids and nucleotides. The left figure shows a protein structure and a closeup of three amino acids. The right figure shows the nucleic structure of DNA. Blue represents nitrogen atoms, red represents oxygen atoms, orange represents phosphates, light gray shows the side chain carbons and dark gray shows the backbone carbons. Each side chain can have 20 different conformations for amino acids and five different kinds of DNA/RNA nucleotides.
The U-Net architecture is a strategy that allows it to work with a moderate number of cryo-EM maps to identify the position of critical atoms for proteins and nucleotides. The U-Net architecture is used in the segmentation steps as well as atom location predictions for amino acids and nucleic acids. The main idea is to supplement a contracting network by successive layers in order to increase the resolution of the output. The high-resolution features from the contracting path are combined with the up-sampled output, and the successive convolutional layer can make a more precise output based on the information. One important modification is upsampling a large number of feature channels. A segmentation map only contains the pixels, for which the full context is available in the input image. Cropping is necessary due to the loss of border pixels in every convolution. It is important to select the input tile size such that all 2 × 2 max-pooling operations are applied to a layer with an even x- and y- size [22]. The amino acid consists of four U-Nets and the Nucleotide U-Net would consist of two to capture the atom positions.
Once the atoms are identified from their amino acid and nucleotide U-Net architectures, the amino acid inputs and nucleotide inputs proceed to their postprocessing steps. Although the locations of the critical atoms are determined, each macromolecular type requires corresponding steps to connect the backbone atoms correctly. Amino acid and nucleotide chains can have a number of ways to connect each atom to form the backbone, and this makes it impossible to have an exhaustive search of all possible solutions that connect the atoms into chains [5]. Additionally, DeepTracer-2.0 requires a way of respecting the input sequence when building the structural model from cryo-EM maps. Aligning amino acids is challenging due to the fact that some amino acid types have a similar appearance. At lower resolutions, cryo-EM maps lead to the U-Net mismatching the frequency of certain amino acid types [5] [23]. Nucleotides have four bases pairs compared with the 20 different amino acid side chain atom types, but still have to correctly distinguish between and pyrimidines as well as distinguish the sugar ribose as DNA or RNA. Therefore, the pipeline adds in nucleotide postprocessing strategies to make the phosphate atoms fit a DNA/RNA structure.
DeepTracer-2.0 pipeline
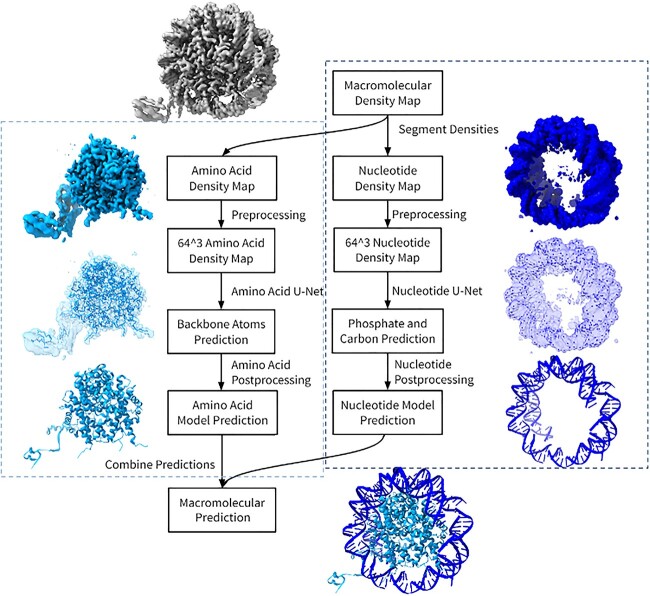
After the nucleotide U-Net was created, all of the U-Net components could be used to separate the macromolecular densities and then predict each macromolecule density as a structure. Our project development uses Python and machine learning algorithms provided by TensorFlow. There are three main processes that allow the prediction of the amino acid and nucleotide macromolecule, see Figure 3. The first step is the segmentation to extract the density maps for separate macromolecules. Once separated, the amino acid and nucleotide pipeline work on modeling their structure from their respective density map. When both predictions finish, the protein and DNA/RNA structures can be combined to give a final prediction of the macromolecular model (Figure 3).
Figure 3.
The system design of the macromolecular pipeline. The pipeline is organized into four major steps: segmentation, preprocessing, their respective machine learning and postprocessing steps. Both amino acids and nucleotides share the same segmentation and preprocessing of their density maps. Once the cryo-EM maps values are normalized and resized to fit a 64 [3] shape, the amino acid U-Net determines the positions of the Cα and other backbone atoms, while the nucleotide U-Net determines the position of phosphate atoms and sugar carbon atoms. Both outputs will be processed through separate postprocessing steps to add on atoms and complete a structure. The models are then combined to generate a complete macromolecular structure. The cyan indicates DeepTracer-1.0’s amino acid pipeline and the dark blue are DeepTracer-2.0’s nucleotide pipeline.
Convolutional neural network and macromolecular density segmentation
Most strategies utilize convolutional neural networks (CNNs) to categorize the voxels [24]. Haruspex utilizes CNN to combine traditional image analysis with machine learning and convolutional filters to obtain high-resolution cryo-EM maps that annotate the protein’s secondary structure and DNA/RNA voxel regions. To do this, Haruspex employs a state-of-the-art U-Net architecture to take input that contains the input of 40 [3] voxels segments. The volume is passed through multiple convolutional layers and pooling features which determine the relevant secondary structure elements for proteins or nucleotides. In the second upconvolutional part of the network, activators recover the spatial detail. The output has four channels that annotate the voxel data α-helical, β-strand, nucleotide or unassigned which is used for the segmentation process. Haruspex’s work which reconstructs each cryo-EM density map based on a protein’s secondary structure and DNA/RNA voxel regions [25]. To utilize the output data, the α-helical, β-strand protein and unassigned probabilities are combined to represent the amino acid density of the map. Meanwhile, the nucleotide density probabilities are used to represent the nucleic acid structure. The segmentation network architecture separates density maps that allow each pipeline to model its respective macromolecule in the DeepTracer-2.0 pipeline. Figure 4 shows the result of density segmentation (Figure 4).
Figure 4.
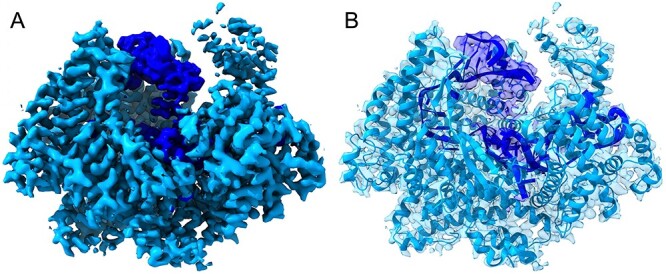
Density segmentation and model structure of EMD-6777. (A) The cyan and dark blue densities are used to solve both the amino acids and nucleic acids structures. On the left is the density map that needs to be separated; the cyan color depicts amino acids where α-helical, β-strand and other data have been combined. The dark blue color depicts RNA density. (B) On the right is the model structure embedded in the density.
Nucleic acid network architecture
Because DeepTracer focuses on high resolution, only maps with a resolution of 4 Å or better were selected. The initial amino acid network was trained with 1800 experimental maps and their corresponding deposited model structures [5]. For the nucleotide network training, 293 EMDB/PDB pairs were selected if the cryo-EM map and model represented the same structure and it fit visually well [20]. These maps required at least one protein chain as an α-helix or β-sheet one nucleotide chain that is at least 20 base pairs or larger, and the resolution was 4 Å or better [8]. With these parameters, it narrows down the number of solved structures to a few hundred maps and their respective PDBs.
After separating the densities, each macromolecule would undergo preprocessing to normalize the density value of each voxel from a range of 0 to 1 and resize each map into a 64 [3] voxel size. The preprocessed density map would proceed to the nucleotide U-Net for its atom and backbone prediction. Due to the different molecular structure of nucleotides and amino acids, amino acids use an amino acid U-Net and DNA/RNA use a separate nucleotide U-Net to define the structural aspects of the nucleic acid. Preprocessed cryo-EM maps are fed into the 64 [3] input layer for each U-Net. The atoms for the nucleotide U-Net focus on whether each voxel contains a phosphate atom (P), a carbon one atom (C1’), a carbon four atom (C4’) or no atom. This has a total of four channel outputs. The backbone U-Net determines if each voxel is part of the sugar phosphate backbone, part of the nitrogenous base or not in either group. This has three different channel outputs. The network architecture for both the atom and backbone U-Nets was heavily focused on determining the structure of the DNA/RNA phosphate backbone. After nucleotide postprocessing is used to refine the phosphate and carbon atom positions, the DeepTracer-2.0 pipeline predicts the nucleotide structure from a cryo-EM map and nucleotide sequence.
Nucleotide postprocessing strategies
Postprocessing steps attempt to reduce the number of phosphates predicted by the U-Net and construct a sugar-phosphate backbone that is consistent with DNA/RNA biological principles. The sugar pucker is predominantly in the C3’ endo (A-DNA or RNA) or a C2’ endo, which corresponds to the DNA’s form (either A or B DNA). Most DNA and RNA conformations fall within the 5.9 Å range as this confirms an A-conformation [26]. However, with larger distances that can appear in B conformations, the postprocessing model allows phosphate atoms that are within 8 Å from each other.
Pseudotorsions were also used to model connecting phosphates to each other. The pseudotorsion simplifies the RNA dihedral angles using the angles between C1’ atoms and P to distinguish and simplify the construction of the backbone [27]. The presence of the sugar pucker seems to impact the distance between neighboring P atoms.
The Brickworx model then uses the P atoms and Cryo-EM map to finish modeling the nucleotide. Brickworx finds the matching position of double-stranded helical motifs in the cell, and if the structure is RNA, the helical fragments extend to recurrent RNA motifs that can contain single-stranded segments [28].
Evaluation metrics
We examine the results of structure predictions based on their accuracy of amino acid and nucleotide metrics. Testing and training datasets were collected from the publicly available EMDR search tool [20]. DNA samples involving the keywords Repair, Replication and Splicing, with the filters ‘has DNA’ and ‘<4 Å’. RNA samples had the filters ‘has RNA(no ribosome)’ and ‘<4 Å’ and had no keywords. Ribosomes were avoided for evaluations due to their large size and having nucleotides mixed in with protein density, making ribosomes the hardest samples to predict. From the hundreds of EMDB map entries, the 20 selected cryo-EM maps have a deposited model structure, a fasta sequence and fall within the resolution of 2–4 Å with a balance of complexes containing DNA and RNA structures. The metric comparisons are made between Phenix’s pipeline performance and DeepTracer’s pipeline performance. The density map tested has both amino acids and nucleotides, and the nucleotide chains are at least 10 nucleic acids or larger. For map comparisons, no modifications or density map adjustments were made, and were run on the default settings. For Phenix, this was the autosharp and gives the resolution of the density map. Our method compared our metrics with Phenix’s map_to_model in their version 1.19 of the Phenix Suite, using the density maps that are generated from the original density. The metrics comparing the quality of amino acids are RMSD, % matching, % sequence matching and % false positives [29]. The nucleotides metrics are phosphate precision and nucleotide precision. The runtime total was combined for the total length to give an assessment of how long the overall process takes.
For amino acids, accuracy of the atom’s position is measured by the RMSD for Cα in amino acid structures. RMSD serves to magnify the significance of errors in the prediction based on the Cα, a lower RMSD value represents a better result.
 |
RMSD is expressed in angstrom units (Å) which equals 10−10 m. v and w represent two sets of points, v is for the model atoms and w is for the predicted atoms. n represents the number of equivalent atoms of the reference structure [30]. The second is matching percentage;
 |
r is the matching residue divided by m the solved structure and multiplied by 100%. A matching residue is included, if the position of the predicted Cα is within 3 Å of the model. The third metric is a sequence matching percent, which compares if the predicted amino acid has the same type of amino acid. s is the sequence at the amino acid and m refers to the solved structure residue.
 |
Lastly, the amino acids measure false positives % of predicted residue, where p is the predicted residue and a is where no matching residue is found.
 |
Rules for judging nucleotides were taken from Brickworx’s modeling assessment. These general rules were adapted by Gruene and Sheldrick’s Geometric properties of nucleic acids with potential for autobuilding [31]. For nucleotides, a P-atom position v is considered correct if the distance to the reference structure m is within 1.5 Å. The nucleotide position n is considered correct if both the P and C1’ atom positions are less than 1.5 and 1.0 Å, respectively [28].
 |
 |
Both the phosphate and nucleotides were judged on their precision, which refers to the percentage of predicted structure’s phosphate and nucleotide C1’ atoms positions that are correct.
Results and comparisons
The quantitative results for amino acids are displayed in Figure 5, a through d. For the amino acids scatter plots, the average of the map results shows DeepTracer having a lower RMSD, % Matching, % Sequence matching and % False Positive for the amino acids. Without parameters or manual processing steps, the details on cryo-EM maps are paired with a fasta sequence. In Figure 5, e and f, macromolecules involved in DNA replication had good results. These structures are usually dsDNA on the outside with multiple protein chains coupled on the inside (Figure 5).
Figure 5.
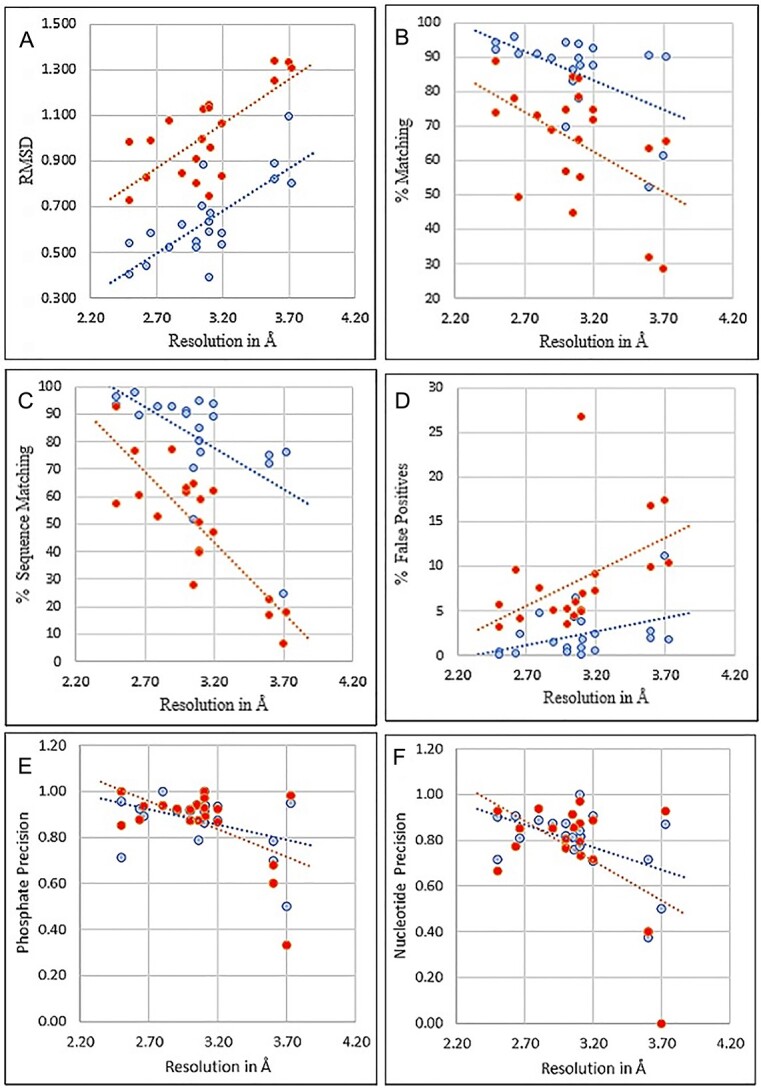
Amino acid and Nucleotide modeling comparison of 20 experimental protein-RNA/DNA cryo-EM maps. DeepTracer models are blue and Phenix models are red. The dotted line represents the trend for each pipeline. (A) RMSD for Cα in amino acid structures. (B) Matching % shows the proportion of residues that have a matching residue, within 3 Å. (C) Sequence matching % shows if the predicted amino acid has the same type of amino acid. (D) False positive % predicted from deposited residues. (E) Nucleotide prediction if the phosphate atom is within 1.5 Å. (F) Nucleotide prediction if the phosphate and C1’ atom are within 1.5 and 1.0 Å, respectively. For subfigure f, EMD-11550 and EMD-24428 shared the same Nucleotide-CC score (0.4), their phosphate scores were different (0.68 and 0.6).
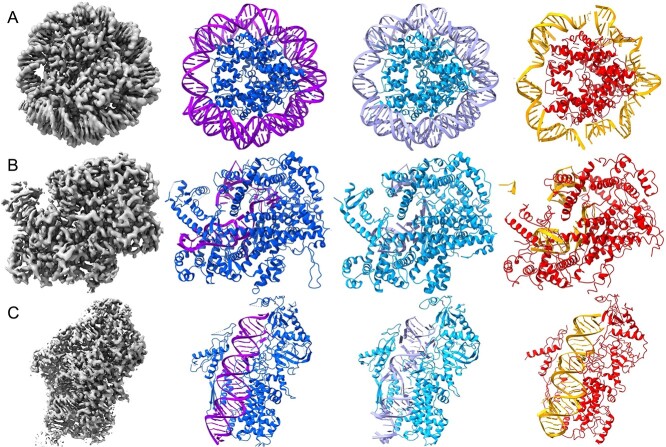
The amino acid U-Net was capable of performing its prediction as the separated macromolecular densities were tracked well. Notable examples are EMD-6777, EMD-12900 and EMD-31963, which show low RMSD values and great metrics, shown in Figure 6 [32–34]. These results indicate the capability of DeepTracer’s pipeline to segment the density from the maps and accurately predict the portion of amino acids. Additionally, the nucleotide U-Net was capable of getting a majority of the phosphates required to place the nucleotides in a double-helix structure. EMD-12900 demonstrates a segmented density sample and prediction result with great results. Structures that were nucleosomes, amino acids at the center and nucleotides that surrounded its outside, also have good metrics. In EMD-31963, there are structures that can improve with regards to RNA and single stranded nucleotides. Our training model performs better for DNA and nucleosome structures, likely because they have many more high-resolution datasets available for training. In addition to the separation of densities at the first step, the model did not pick up the RNA and instead mistakenly predicted the density as protein (Figure 6). After more high-resolution cryo-EM maps containing RNA are released in the future, we expect the overall DeepTracer-2.0 performance on the RNA region will significantly improve. These reasons caused some of Phenix’s individual results to be better when compared with DeepTracer-2.0’s results.
Figure 6.
A visual comparison of DeepTracer and Phenix models from experimental protein-RNA/DNA cryo-EM maps. There are three cryo-EM maps that go through each pipeline in order to predict the structure. Each model is colored differently, DeepTracer uses light blue for amino acids and mauve for nucleotides, Phenix uses red for amino acids and orange for nucleotides, and the deposited model uses blue for amino acids and purple for nucleotides. (A) Result of DNA model EMD-12900. Both the DNA and amino acids appear more complete in the DeepTracer pipeline. (B) Result of RNA model EMD-6777. Both maps had issues tracking the single stranded nucleotides. Additionally, Phenix also had a few false positive nucleotides. (C) Result of RNA model EMD-31963. Phenix had a better prediction for the double helix RNA structure, but DeepTracer did better with the amino acid structure.
Figure 7 shows the overall runtime of the pipeline process. DeepTracer’s pipeline was exponentially faster when compared with Phenix’s pipeline in giving a prediction of the complex structure. The smallest structure EMD-25198 took 5 min to generate for DeepTracer’s Pipeline, whereas Phenix’s pipeline required 6 h. For the longer macromolecular complexes, EMD-6941 and EMD-24428, DeepTracer was quickly able to predict both macromolecules taking a bit over 6 min, while Phenix required over a day to predict the overall structure (Figure 7).
Figure 7.
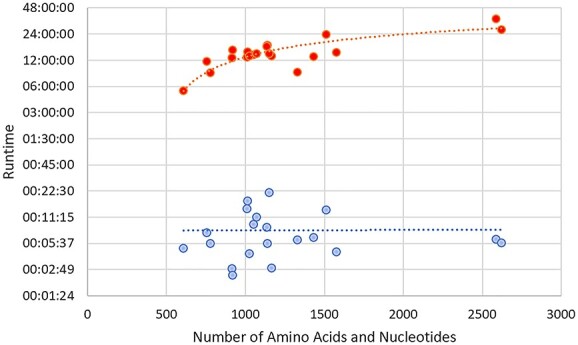
Computational runtime comparison of 20 experimental protein-RNA/DNA maps. The dotted lines represent the trend for each method. The times are shown on a logarithmic scale and combine the runtime totals of amino acid and nucleotide methods. DeepTracer models are blue and Phenix models are red.
The summary of comparison between DeepTracer and Phenix is provided in Table 1 and details of the comparison can be found in the Supplementary Tables. The amino acid and nucleotide density that is used for each method comes from the original density map, with each map resolution in the range of 2.0–4.0 Å. Each program uses its methods of using the density to perform its evaluation of the macromolecule. Each pipeline lists the average values for the total 20 maps tested. The 2nd to 6th columns of the table shows amino acids metrics and the last two columns show nucleotide metrics. The results for each individual density map can be found on the supplementary page (Table 1).
Table 1.
Summary of comparison between DeepTracer and Phenix
| Pipeline | RMSD | % matching | % Sequence matching | % False positives | % False connections | Phosphate precision | Nucleotide precision |
|---|---|---|---|---|---|---|---|
| DeepTracer | 0.638 | 85.32 | 81.49 | 2.467 | 1.848 | 0.872 | 0.793 |
| Phenix | 1.017 | 65.44 | 49.71 | 8.416 | 4.102 | 0.866 | 0.752 |
Ribosomes are difficult targets because the mixture of protein and DNA/RNA densities make it difficult to distinguish the secondary structures of each macromolecule. The Phenix’s run with EMD-32801, and other large ribosome samples end up crashing due to the large size of the macromolecule. DeepTracer’s pipeline progress slows down when the Cryo-EM map exceeds around 1000 nucleotides or more. However, DeepTracer’s model managed to obtain a prediction with EMD-32801 by modifying the nucleotide Cryo-EM density into smaller portions (Figure 8).
Figure 8.
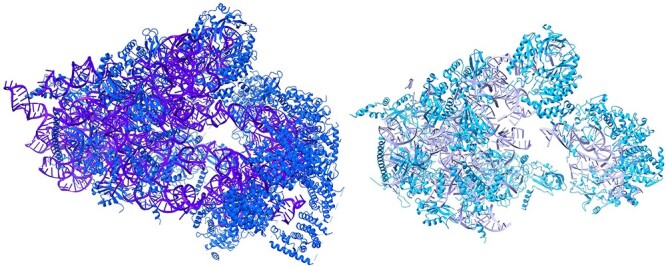
A visualization of DeepTracer’s ribosome sample and EMD-32801 solved model. The left model is the solved structure, with blue for amino acids and purple for nucleotides. The right model is the DeepTracer version, with a light blue for amino acid and mauve for nucleotides.
Discussion
With the new implementation of the macromolecular density segmentation and nucleic acid modeling, DeepTracer-2.0 pipeline is capable of predicting protein-DNA/RNA macromolecular complexes from the cryo-EM maps. The concept of accurate density segmentation allows the researchers to submit cryo-EM maps that can contain different macromolecules in order to identify the types of macromolecules involved in each voxel. As shown by previous results, the amino acids were able to have low RMSD and DNA/RNA contained a high phosphate precision. It is also observed that low map quality could lead to suboptimal segmentation and modeling results.
Our search from the EMDB database did include larger samples, but since these were difficult it was hard to create a large benchmark of macromolecular molecules. Additionally, DNA and RNA samples frequently fall within a lower resolution, which limited the number of high-resolution datasets that contained both proteins and nucleotides. These EMD samples should become more accessible in the future.
For challenges to address, DeepTracer-2.0 needs to aim for more efficient postprocessing techniques that will mitigate the amount of falsely predicted phosphates, and aim for a more reasonable amount of phosphate atoms when predicted by the U-Net. This can be addressed by improving the logic within the postprocessing steps and utilizing more training data to begin to include more Protein-DNA/RNA Cryo-EM maps, also including ribosome data.
Ribosomes remain difficult targets due to their protein and DNA/RNA mixed densities. Haruspex and Phenix have some success in distinguishing secondary structures but can improve. For DeepTracer-2.0 and later versions, postprocessing steps involving partitioning the chains of nucleotides could speed up the analysis of large nucleotides complex. Additionally, training ribosomes can be one part that could be improved to make DeepTracer-2.0 more effective in predicting large ribosome models.
Additionally, our work should move to become less dependent on 3rd party postprocessing for DNA/RNA. The Brickworx system has had success with the nucleosome models but is restricted by the library of DNA and RNA. As noted by a majority of the runs, the main time bottleneck comes from brickwork’s postprocessing. Setting up our nucleotide postprocessing to use our predicted phosphates and carbon atom placements and sequence data can lead to a more accurate and efficient macromolecular complex modeling.
For future work, other deep learning and artificial intelligence methods could be explored to train on the accumulated amino acid density map and nucleic acid density map data and target on single-strand RNA as well as larger complexes. In addition, refining the sugar phosphate backbone to model the secondary structure of DNA/RNA could lead to more accurate models.
Key Points
The DeepTracer team has developed an artificial-intelligence-based pipeline that builds amino acids and nucleic acids from a cryo-EM map.
When compared with other pipelines, our work shows results of accurate and effective macromolecular models.
Our webpage allows users to utilize this pipeline to perform their own macromolecular modeling from their cryo-EM maps.
Supplementary Material
Author Biographies
Andrew Nakamura received Master’s degree from Division of Computing and Software Systems at the University of Washington Bothell. He is interested in macromolecular complex modeling in the DeepTracer project.
Hanze Meng received Bachelor’s degree from Department of Mathematics at the University of Washington Seattle and is now pursuing Computer Science Master’s degree at the Duke University. He is interested in system development in the DeepTracer project.
Minglei Zhao is a faculty at Department of Biochemistry and Molecular Biophysics at the University of Chicago.
Fengbin Wang is a faculty at Department of Biochemistry and Molecular Genetics at the University of Alabama Birmingham.
Jie Hou is a faculty at Department of Computer Science at the Saint Louis University.
Renzhi Cao is a faculty at Department of Computer Science at the Pacific Lutheran University.
Dong Si is a faculty at Division of Computing and Software Systems and an eScience affiliated professor at the University of Washington. He is the Director of the Data Analysis & Intelligent Systems (DAIS) group and Principal Investigator of the DeepTracer project.
Contributor Information
Andrew Nakamura, Division of Computing and Software Systems, University of Washington Bothell, Bothell, WA 98011, USA.
Hanze Meng, Department of Computer Science, Duke University, Durham, NC 27708, USA.
Minglei Zhao, Department of Biochemistry and Molecular Biology, The University of Chicago, Chicago, IL 60637, USA.
Fengbin Wang, Department of Biochemistry and Molecular Genetics, University of Alabama Birmingham, Heersink School of Medicine, Birmingham, AL 35233, USA.
Jie Hou, Department of Computer Science, Saint Louis University, Saint Louis, MO 63103, USA.
Renzhi Cao, Department of Computer Science, Pacific Lutheran University, Tacoma, WA 98447, USA.
Dong Si, Division of Computing and Software Systems, University of Washington Bothell, Bothell, WA 98011, USA.
Data availability
Availability of data and materials Software, documentation, and datasets are available at the DeepTracer website: https://deeptracer.uw.edu/.
Funding
This material is based upon work supported by the Graduate Research Award of Computing and Software Systems Division and the SRCP Seed Grant at University of Washington Bothell to D.S.
References
- 1. Berman HM, Westbrook J, Feng Z, et al. The protein data Bank. Nucleic Acids Res 2000;28:235–42. [DOI] [PMC free article] [PubMed] [Google Scholar]
- 2. Berman HM, Kleywegt GJ, Nakamura H, et al. The protein data Bank archive as an open data resource. J Comput Aided Mol Des 2014;28:1009–14. [DOI] [PMC free article] [PubMed] [Google Scholar]
- 3. Lawson CL, Kryshtafovych A, Adams PD, et al. Cryo-EM model validation recommendations based on outcomes of the 2019 EMDataResource challenge. Nat Methods 2021;18:156–64. [DOI] [PMC free article] [PubMed] [Google Scholar]
- 4. Liebschner D, Afonine PV, Baker ML, et al. Macromolecular structure determination using X-rays, neutrons and electrons: recent developments in Phenix. Acta Cryst D 2019;75:861–77. [DOI] [PMC free article] [PubMed] [Google Scholar]
- 5. Pfab J, Phan NM, Si D. DeepTracer for fast de novo cryo-EM protein structure modeling and special studies on CoV-related complexes. PNAS 2021;118:1–4 [DOI] [PMC free article] [PubMed] [Google Scholar]
- 6. Watkins AM, Rangan R, Das R. FARFAR2: improved de novo rosetta prediction of complex global RNA folds. Structure 2020;28(8):963–76.e6. 10.1016/j.str.2020.05.011. [DOI] [PMC free article] [PubMed] [Google Scholar]
- 7. Terashi G, Kihara D. De novo main-chain modeling for EM maps using MAINMAST. Nat Commun 2018;9:1618. [DOI] [PMC free article] [PubMed] [Google Scholar]
- 8. Mostosi P, Schindelin H, Kollmannsberger P, et al. Haruspex: a neural network for the automatic identification of oligonucleotides and protein secondary structure in Cryo-electron microscopy maps. Angew Chem Int Ed Engl 2020;59:14788–95. [DOI] [PMC free article] [PubMed] [Google Scholar]
- 9. Giri N, Roy RS, Cheng J. Deep learning for reconstructing protein structures from cryo-EM density maps: recent advances and future directions. 2022. 10.48550/arXiv.2209.08171. [DOI] [PMC free article] [PubMed]
- 10. Lindert S, Alexander N, Wotzel N, et al. EM-fold: de novo atomicdetail protein structure determination from medium-resolution density maps. Structure 2012;20(3):464–78. [DOI] [PMC free article] [PubMed] [Google Scholar]
- 11. Rozanov M, Wolfson HJ. AAnchor: CNN guided detection of anchor amino acids in high resolution cryo-EM density maps. In: 2018 IEEE International Conference on Bioinformatics and Biomedicine (BIBM). Madrid, Spain: IEEE, 2018, 88–91.
- 12. Ma L, Reisert M, Burkhardt H. RENNSH: a novel α-helix identification approach for intermediate resolution electron density maps. In IEEE/ACM Transactions on Computational Biology and Bioinformatics. Germany: IEEE, 2012;9(1):228–39. [DOI] [PubMed] [Google Scholar]
- 13. Zhang X, Zhang B, Freddolino PL, et al. CR-I-TASSER: assemble protein structures from cryo-EM density maps using deep convolutional neural networks. Nat Methods 2022;19(2): 195–204. [DOI] [PMC free article] [PubMed] [Google Scholar]
- 14. He J, Lin P, Chen J, et al. Model building of protein complexes from intermediateresolution cryo-EM maps with deep learning-guided automatic assembly. Nat Commun 2022;13(1):1–16. [DOI] [PMC free article] [PubMed] [Google Scholar]
- 15. Subramaniya MV, Raghavendra S, Terashi G, et al. Protein secondary structure detection in intermediate-resolution cryo-EM maps using deep learning. Nat Methods 2019;16(9):911–7. [DOI] [PMC free article] [PubMed] [Google Scholar]
- 16. Wang X, Alnabati E, Aderinwale TW, et al. Detecting protein and DNA/RNA structures in cryo-EM maps of intermediate resolution using deep learning. Nat Commun 2021;12:2302. [DOI] [PMC free article] [PubMed] [Google Scholar]
- 17. Yang Zhang. FASTA format. What is FASTA format? Accessed September 9, 2022. https://zhanggroup.org/FASTA/ (2022).
- 18. Lopez MJ, Mohiuddin SS. Biochemistry, Essential Amino Acids. In: StatPearls. Treasure Island (FL): StatPearls Publishing, 2022. Accessed August 29, 2022. [PubMed] [Google Scholar]
- 19.3.8: Proteins - Amino Acids. Biology LibreTexts. Published July 5, 2018. Accessed July 24, 2022. https://bio.libretexts.org/@go/page/12699 s . [Google Scholar]
- 20. Lawson CL, Patwardhan A, Berman HM, et al. EMDataBank unified data resource for 3DEM. Nucleic Acids Res 2016;44:D396–403. 10.1093/nar/gkv1126 PMID: 26578576; PMCID: PMC4702818. [DOI] [PMC free article] [PubMed] [Google Scholar]
- 21. Mattaini K. Chapter 5. Nucleotides & Nucleic Acids. Attribution 40 International. 2020. Accessed July 24, 2022.
- 22. Ronneberger O, Fischer P, Brox T. U-Net: convolutional networks for biomedical image segmentation. In: Navab N, Hornegger J, Wells WM, Frangi AF, (eds) Medical Image Computing and Computer-Assisted Intervention – MICCAI 2015. Lecture Notes in Computer Science. Springer International Publishing. Freiburg, Germany, 2015, 234–41. 10.1007/978-3-319-24574-4_28. [DOI] [Google Scholar]
- 23. Mirarab S, Nguyen N, Guo S, et al. PASTA: ultra-large multiple sequence alignment for nucleotide and amino-acid sequences. J Comput Biol 2015;22:377–86. [DOI] [PMC free article] [PubMed] [Google Scholar]
- 24. Verbeke EJ, Zhou Y, Horton AP, et al. Separating distinct structures of multiple macromolecular assemblies from cryo-EM projections. J Struct Biol 2020;209:107416. [DOI] [PMC free article] [PubMed] [Google Scholar]
- 25. Mostosi P, Schindelin H, Kollmannsberger P, Thorn A. Haruspex: a neural network for the automatic identification of oligonucleotides and protein secondary structure in cryo-electron microscopy maps. Angewandte Chemie International Edition. 2020;59;(35):14788–95. 10.1002/anie.202000421. [DOI] [PMC free article] [PubMed] [Google Scholar]
- 26. Colasanti AV, Lu X-J, Olson WK. Analyzing and building nucleic acid structures with 3DNA. Journal of visualized experiments: no. 74 (2013): JoVE e4401. 10.3791/4401. [DOI] [PMC free article] [PubMed] [Google Scholar]
- 27. Lu X-J, Bussemaker HJ, Olson WK. DSSR: an integrated software tool for dissecting the spatial structure of RNA. Nucleic Acids Res 2015;e142. 10.1093/nar/gkv716. [DOI] [PMC free article] [PubMed] [Google Scholar]
- 28. Chojnowski G, Waleń T, Piątkowski P, et al. Brickworx builds recurrent RNA and DNA structural motifs into medium- and low-resolution electron-density maps. Acta Cryst D 2015;71:697–705. [DOI] [PMC free article] [PubMed] [Google Scholar]
- 29. Terwilliger TC, Adams PD, Afonine PV, et al. A fully automatic method yielding initial models from high-resolution cryo-electron microscopy maps. Nat Methods 2018;15:905–8. [DOI] [PMC free article] [PubMed] [Google Scholar]
- 30. Coutsias EA, Wester MJ. RMSD and symmetry. J Comput Chem 2019;40:1496–508. [DOI] [PubMed] [Google Scholar]
- 31. Gruene T, Sheldrick GM. Geometric properties of nucleic acids with potential for autobuilding. Acta Cryst A 2011;67:1–8. [DOI] [PMC free article] [PubMed] [Google Scholar]
- 32. Liu L, Li X, Ma J, et al. The molecular architecture for RNA-guided RNA cleavage by Cas13a. Cell 2017;170:714–726.e10. [DOI] [PubMed] [Google Scholar]
- 33. Wang H, Xiong L, Cramer P. Structures and implications of TBP–nucleosome complexes. Proc Natl Acad Sci USA 2021;118:e2108859118. [DOI] [PMC free article] [PubMed] [Google Scholar]
- 34. Wang Q, Xue Y, Zhang L, et al. Mechanism of siRNA production by a plant dicer-RNA complex in dicing-competent conformation. Science 2021;374:1152–7. [DOI] [PMC free article] [PubMed] [Google Scholar]
Associated Data
This section collects any data citations, data availability statements, or supplementary materials included in this article.
Supplementary Materials
Data Availability Statement
Availability of data and materials Software, documentation, and datasets are available at the DeepTracer website: https://deeptracer.uw.edu/.


