Abstract
Understudied or dark proteins have the potential to shed light on as-yet undiscovered molecular mechanisms that underlie phenotypes and suggest innovative therapeutic approaches for many diseases. The Reactome-IDG (Illuminating the Druggable Genome) project aims to place dark proteins in the context of manually curated, highly reliable pathways in Reactome, the most comprehensive, open source biological pathway knowledgebase, facilitating the understanding of dark proteins’ functions and predicting their therapeutic potentials. The Reactome-IDG web portal, deployed at https://idg.reactome.org, provides a simple, interactive web page for users to search pathways that may functionally interact with dark proteins, enabling the prediction of functions of dark proteins in the context of Reactome pathways. Enhanced visualization features implemented at the portal allow users to investigate the functional contexts for dark proteins based on tissue specific gene or protein expression, drug-target interactions, or protein or gene pairwise relationships in the original Reactome’s SBGN (Systems Biology Graph Notation) diagrams or the new simplified functional interaction (FI) network view of pathways. The protocols in this chapter describe step-by-step procedures to use the web portal to learn biological functions of dark proteins in the context of Reactome pathways.
Basic Protocol 1:
Search for Interacting Pathways of a Protein
Support Protocol 1:
Interacting Pathway Results for an Annotated Protein
Alternate Protocol 1:
Use Individual Pairwise Relationships to Predict Interacting Pathways of a Protein
Basic Protocol 2:
Using the IDG Pathway Browser to Study Interacting Pathways
Basic Protocol 3:
Overlaying Tissue Specific Expression Data
Basic Protocol 4:
Overlaying Protein/Gene Pairwise Relationships in the Pathway Context
Basic Protocol 5:
Visualizing Drug/Target Interactions
Keywords: Dark Proteins, Druggable Genome, Interacting Pathways, Reactome, Tissue Specific Expression
INTRODUCTION
There is currently a limited understanding of biological functions of about one third of protein coding genes in humans (Oprea et al., 2018). These understudied proteins are referred to as “dark proteins”, which have no experimental evidence linking to diseases and have no known small molecules binding to relatively high potency. However, these proteins may have the potential to reveal new molecular mechanisms underlying biological processes and phenotypes and may provide a more thorough understanding of many diseases and their therapeutics. Biological pathways serve as a structured representation of molecular interactions and processes, facilitating researchers to collect prior knowledge into a system that is understood by both humans and computers. This system can be used to conduct advanced studies such as large-scale omics data analysis and visualization and in silico mathematical modeling for drug discovery. Reactome (Gillespie et al., 2022) is the most comprehensive, open-source biological pathway knowledgebase, covering over 50 percent of total human protein coding genes. Its pathways extensively span crucial areas in human biology, including cell cycle, DNA repair and replication, signaling pathways, gene regulation, apoptosis, among many others.
The Reactome-IDG (Illuminating the Druggable Genome, https://commonfund.nih.gov/idg) project aimed to predict functions of dark proteins from their interactions with components of Reactome pathways, therefore facilitating more informed hypotheses about their functions and therapeutic potentials. The protocols described here explain step-by-step procedures to use the Reactome-IDG web portal, deployed at https://idg.reactome.org, to search for interacting pathways for dark proteins, to overlay tissue specific gene or protein expression data to determine their tissue specific context, and to study drug/target interactions to identify potential therapeutics related to interacting pathways. Users may study interacting pathways interactively in detail in the original Reactome’s Systems Biology Graph Notation (SBGN)-based pathway diagrams (Le Novère et al., 2009) or in the simplified functional interaction (FI) network view of pathways (Wu et al., 2014). Pathways in Reactome are manually curated to ensure high quality. The manual annotation is labour intensive, limiting the coverage of the human proteome. Researchers may also use the Reactome-IDG portal to infer pathways for those non-dark proteins that have not been annotated yet in Reactome.
Five Basic Protocols, one Support Protocol, and one Alternate Protocol are provided in this section. Basic Protocol 1 describes how to search for and examine pathways that may functionally interact with a protein at the Reactome-IDG web portal homepage. Support Protocol 1 further describes how a Reactome-annotated protein is displayed on the Reactome-IDG homepage. Alternative Protocol 1 extends Basic Protocol 1 by detailing use of pairwise relationships directly for interacting pathway searches. Basic Protocol 2 describes use of the Reactome-IDG pathway browser. Basic Protocols 3 and 4 explain how to overlay tissue specific expression data and pairwise relationships, respectively, onto pathway diagrams. Finally, Basic Protocol 5 describes visualization of drug interactions with target proteins.
BASIC PROTOCOL 1
Search for Interacting Pathways of a Protein
An interacting pathway of a protein is defined as a Reactome pathway with which the protein may functionally interact to activate or inhibit the pathway’s activity. The interacting pathways are inferred based on predicted functional interactions (Wu., Feng, & Stein, 2010) using a trained machine learning model. The functional interaction score calculated by the machine learning model measures how likely two proteins may functionally relate or interact each other. See the COMMENTARY section at the end for more details. Examining a dark protein in the context of Reactome pathways starts with searching for interacting pathways for a query gene or protein on the Reactome-IDG web portal at https://idg.reactome.org. This protocol describes how to do this. For the purpose of illustrating expected results, the dark protein TANC1 (https://pharos.ncats.nih.gov/targets/TANC1) is used as an example:
| Protein: Gene name: TANC1 |
| UniProt accession number: Q9C0D5 |
| Search parameters: Functional interaction score ≥ 0.8 (To choose proteins that are predicted to functionally interact with TANC1 with a score ≥ 0.8 for interacting pathway analysis) |
| FDR of interacting pathways < 0.05 (To select statistically significant interacting pathways) |
Necessary Resources
Hardware:
Computer capable of supporting a Web browser and an Internet connection.
Software:
A modern Web browser such as Chrome, FireFox, or Safari with JavaScript enabled to display Reactome-IDG pages.
Protocol steps with step annotations
-
Navigate to the Reactome-IDG homepage at https://idg.reactome.org.
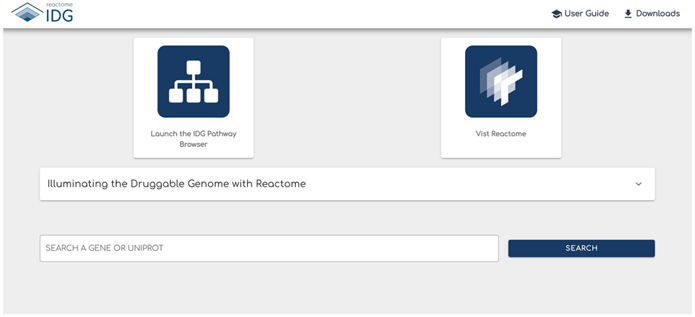
The homepage (Fig.1) contains multiple distinct elements.
The Navigation Bar at the top of the page contains links to resources for the Reactome-IDG website. The “reactome IDG” logo redirects the user to this home page when clicked. The “User Guide” provides an overview of the website and a step-by-step explanation of site features and functionality. "Downloads" has two files. The mongodb database dump file has data such as predicted functional interactions that support the IDG website, while the zipped csv file contains the pairwise features used to train the machine learning model to predict the protein functional interactions for interacting pathway inference.
The IDG Pathway Browser can be launched by clicking the “Launch the IDG Pathway Browser” card. Functionality of the IDG Pathway Browser will be explained in Protocol 2.
The Visit Reactome card will redirect users to the main Reactome website (https://reactome.org) when clicked.
The Dropdown labeled “Illuminating the Druggable Genome with Reactome” provides an overview of the Reactome-IDG project and its web tools.
The Search Bar allows the user to enter the gene name or UniProt accession of a protein that is to be analyzed. This is the main entry point for users to learn biological functions of dark proteins at the Reactome-IDG web portal.
-
Type the gene name (TANC1) or UniProt accession (Q9C0D5) into the search bar at the Reactome-IDG portal, https://idg.reactome.org, and click the “Search” button to the right of the bar. This will load the results section for interacting pathways.
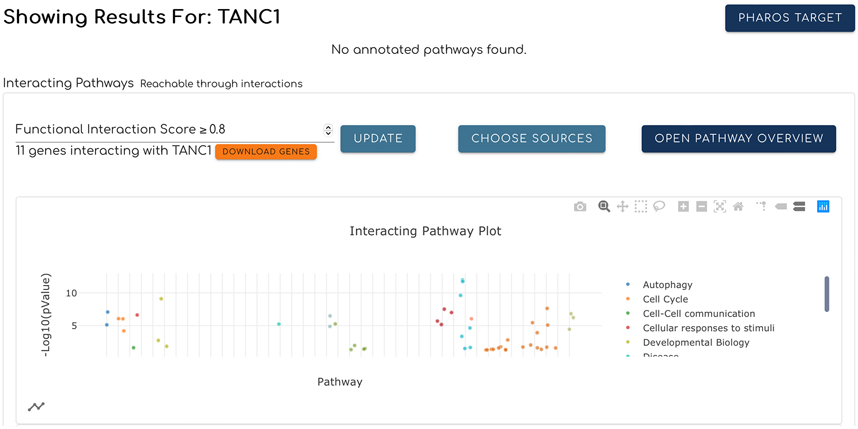
The pathways predicted to interact with the searched protein or gene are presented in a card, where they are displayed in a scatter plot view (Fig. 2) by default. Users can view predicted interacting pathways in a network view (Fig. 3) and toggle between the two views by clicking the small plot icon at the bottom left corner of the card as shown in Fig. 2. In order to present a better visualization for interacting pathways and facilitate the comparison study, only pathways having entities laid out in their SBGN diagrams are displayed here.
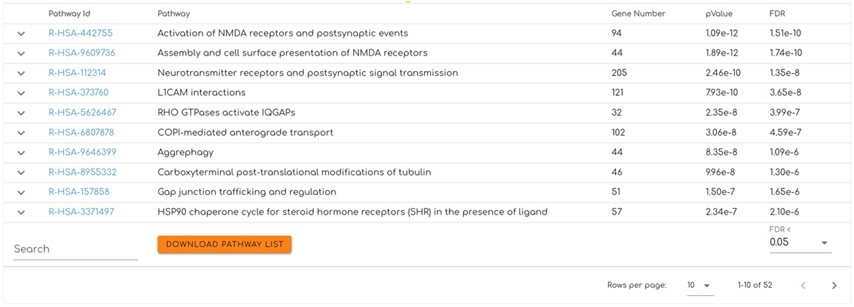
In the scatter plot view (Fig. 2) interacting pathways are plotted as points that are colored and grouped based on their top-level pathways annotated in Reactome. Pathway points can be clicked to filter the table view below (Fig. 4) to show the pathway represented by the clicked point. The legend to the right of the plot displays the top level pathway names for each point. Clicking a name will add or remove the points associated with the top level pathway from the plot. The user can zoom in or out, reset the plot axis, and further adjust the plot view using the buttons at the top right corner of the plot. The user can also download the plot view into a PNG image by clicking the “download plot as a png” button (shown as a camera icon).
The network view (Fig. 3) displays individual pathways as nodes and overlaps between pathways as edges. Clicking the gear icon located at the top left corner of the network view (Fig. 3) displays a panel for users to adjust the network view. This panel contains a drop down menu to perform automatic layout of the network using one of five algorithms: cose (i.e. force-directed layout), random, circle, concentric, and grid. The panel also contains a field to adjust the pValue threshold for the pathway overlaps shown as edges. Increasing this pValue will add more edges between pathways while decreasing it reduces edges. The reset button will recenter and rescale the network. The map icon at the top right corner displays the legend for the network when clicked. The user may select one or multiple (press and hold ctrl while clicking) nodes and their represented pathways are exclusively displayed in the table (Fig. 4). A panel with information about the overlap between two pathways linked by an edge in the network is displayed in the bottom right corner when the edge is clicked. The user may select multiple edges to view their overlap information by pressing and holding the control key while clicking.
The “Pharos Target” button (Fig. 2), located at the top right corner of the card, will take the user to the target page of the searched term at the PHAROS website (e.g. https://pharos.ncats.nih.gov/targets/TANC1), the official website of the NIH IDG program.
A list of interacting pathways is shown at the bottom of the card in the table view (Fig. 4). The first column in the table lists the pathway stable identifiers, which can be clicked to open the pathway diagram for the selected pathway in the pathway browser, as described in Basic Protocol 2. The “Pathway” column shows the pathway names. The “Gene Number” column lists the number of genes that are annotated in the pathway. The “pValue” column displays the statistical significance of each pathway based on interacting pathway prediction using predicted functional interactions between the searched term and the proteins in the pathway. The “FDR” column is the false discovery rate of the pathway listed. The arrow icon to the left of each row in the table can be expanded to show more information about the pathway. Additional rows can be displayed using the controls at the bottom right in the table view. The “DOWNLOAD PATHWAY LIST” button at the bottom of the table will download the table in the CSV format when clicked.
-
Adjust the interacting pathways shown for the searched term with the Functional Interaction Score located at the top left corner of the Interacting Pathways card.
The threshold of Functional Interaction (FI) Score can be adjusted with the clickable arrows or by typing in a value (Fig. 2). Click the “Update” button to update the results. The FI Score is a measure of the likelihood of functional interaction between two proteins. The score was calculated by a random forest model trained with 106 protein/gene pairwise relationship features. A higher FI score will select proteins that are more likely to functionally interact with the searched protein. The selected FI partners are then used for interacting pathway analysis for the searched protein (Brunson, Sanati, Matthews, et al., 2023).
The “DOWNLOAD GENES” button below the Functional Interaction Score value will download the related genes together with their support pairwise features used to predict FIs in the CSV format.
-
Filter interacting pathways shown for the searched term by adjusting the False Discovery Rate (FDR) located at the bottom right corner of the card.
The threshold of FDR at the bottom right corner in the table has a list of values to filter the displayed pathways. The results will update automatically once a value is selected. The user can also enter a value manually for filtering.
Figure 1.
The Reactome-IDG home page (https://idg.reactome.org) features a navigation bar, link cards, a drop down, and a search bar for interacting pathway analysis.
Figure 2.
Interacting pathways for a query gene or protein are displayed as a scatter plot according to the pValues of the pathways. Each dot represents a pathway and is colored based on its top level pathway assignment as annotated in Reactome. These top level pathways are shown in a legend to the right of the plot. Dots are grouped based on their top level pathways and sorted based on the original pathway hierarchy structure on the Reactome website. Clicking the network icon at the bottom-left corner switches the view to the network (Fig. 3).
Figure 3.
Interacting pathways are displayed in a network view. Pathways are rendered as nodes whose size vary based on the pathway size. Nodes are linked through edges whose width varies based on the extent of overlapping of their annotated genes. Users may click the gear button at the top-left corner to control the network view, the legend button at the top-right corner to view network legends, and an edge for detailed overlap information. Clicking the plot icon at the bottom-left corner switches the view to the scatter plot (Fig. 2).
Figure 4.
Interacting pathways are displayed in an interactive table where the user may read detailed descriptions about the pathways, search for specific pathways, and filter them based on an FDR value.
SUPPORT PROTOCOL 1
Interacting Pathway Results for an Annotated Protein
The Reactome-IDG website supports analysis of proteins annotated in Reactome in addition to dark proteins or non-dark proteins that are not in Reactome. Exploring interacting pathways for a protein annotated in Reactome may help users to better know the protein’s potential functional involvement in pathways that may crosstalk with pathways where the queried protein is annotated. Predicted interacting pathways are displayed together with annotated pathways for annotated proteins as demonstrated in this support protocol. For the purpose of illustrating expected results, the protein “aldolase, fructose-bisphosphate B” (Gene name: ALDOB; UniProt accession: P05062) is used. Note: This protein has been annotated in Reactome while TANC1 in Basic Protocol 1 has not.
| Protein: | Gene name: ALDOB |
| UniProt accession: P05062 | |
| Search parameters: Functional interaction score ≥ 0.9 (To choose proteins that are predicted to functionally interact with ALDOB with a score ≥ 0.9 for interacting pathway analysis) | |
| FDR of interacting pathways < 0.05 (To select statistically significant interacting pathways) | |
Necessary Resources
Hardware:
Computer capable of supporting a Web browser and an Internet connection.
Software:
A modern Web browser such as Chrome, FireFox, or Safari with JavaScript enabled to display Reactome-IDG pages.
Protocol steps with step annotations
Navigate to the Reactome-IDG homepage at https://idg.reactome.org.
-
Type the gene name, ALDOB, or Uniprot identifier, P05062, into the search bar and click the “Search” button to the right of the bar. This will load the results section for interacting pathways as outlined in Basic Protocol 1. The results will include an additional “Annotated Pathways” section (Fig. 5) located above the “Interacting Pathways”.
Annotated Pathways (Fig. 5) shows a hierarchical view of the Reactome annotated pathways that contain the searched gene or protein. The last top-level pathway is expanded by default. To view lower level pathways in other top level pathways, click the arrow to the left of these top-level pathways. Clicking on a pathway name from the list will open the Reactome pathway diagram for the selected pathway in another browser window, as described in Basic Protocol 2.
Figure 5.
The Annotated Pathways section shows hierarchical relationships of pathways where the searched gene or protein is annotated.
ALTERNATE PROTOCOL 1
Use Individual Pairwise Relationships to Predict Interacting Pathways of a Protein
Basic Protocol 1 describes how to find interacting pathways for a gene or protein based on Functional Interactions (FIs) predicted based on a set of protein/gene pairwise relationships. The Reactome-IDG web portal also allows users to predict interacting pathways based on the original individual pairwise relationships (e.g. protein-protein interactions, or tissue or cancer specific gene expression correlations) that are used for the FI prediction. This is useful if the user wants to find pathways that may be functionally related in one specific tissue (e.g. based on GTEx tissue-specific gene co-expression) or cancer (e.g. based on TCGA cancer specific gene co-expression). This protocol describes how to select one or more individual protein/gene pairwise relationships and then to predict interacting pathways for a query gene or protein based on the selected relationships.
Necessary Resources
Hardware:
Computer capable of supporting a Web browser and an Internet connection.
Software:
A modern Web browser such as Chrome, FireFox, or Safari with JavaScript enabled to display Reactome-IDG pages.
Protocol steps with step annotations
Search for a term, such as TANC1, on the Reactome-IDG homepage at https://idg.reactome.org (described in Basic Protocol 1).
-
Click on the “CHOOSE SOURCES” button at the top of the card (Fig. 6) to choose one or more gene/protein pairwise relationships.
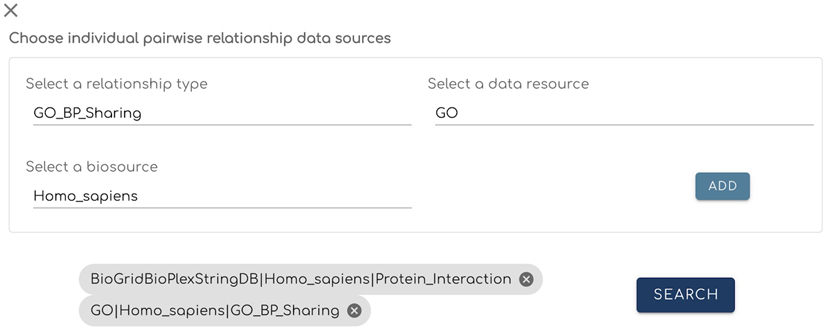
A form will be displayed with drop down lists to choose individual gene/protein pairwise relationship datasets; click “ADD” to register the selection (Fig. 7). Up to six datasets can be added for a single analysis. Clicking the “x” at the top left corner will close this form.
-
Click on the “SEARCH” button to conduct interacting pathway analysis based on the selected pairwise relationships.
A list of interacting pathways will be displayed similar to the results shown in Basic Protocol 1. To close the view of this analysis, click the “x” at the top left corner and return to the view of results based on FIs.
Figure 6.
The “CHOOSE SOURCES” button is located towards the top of the Interacting Pathways Panel, which is displayed after searching for a term.
Figure 7.
The panel used for users to choose individual sources. This panel is opened using the “CHOOSE SOURCES” button (Fig. 6).
BASIC PROTOCOL 2
Using the Reactome-IDG Pathway Browser to Study Interacting Pathways
Based on knowledge levels and clinical applications of proteins, human proteins can be grouped into the four target development level categories (Oprea et al., 2018): 1). Tclin (for "clinical") represents the most-studied proteins, ones that have known interactions with approved drugs and for which there is an identified mechanism of action. These represent just 3 percent of the human proteome; 2). Tchem (for "chemical") includes proteins that are known to bind to small molecules with relatively high potency. This group accounts for 6 percent of the proteome; 3). Tbio (for “biology”) refers to proteins for which there is experimental evidence of disease relevance, and some understanding concerning their structure and function, but which have not been fully developed as drug targets. About 53 percent of the proteome belongs to this category; 4). Tdark (referring to the "dark genome") includes all proteins that do not meet the criteria for inclusion in any of the other categories. These proteins account for 38 percent of the proteome. The Reactome-IDG pathway browser highlights proteins annotated in pathways according to these knowledge levels in different colors as default. Further, the browser also offers additional new features, including a simplified FI network view of pathways, drug interaction overlay, and tissue specific gene and protein expression overlay, allowing users to interactively explore possible functions and therapeutic potentials of dark proteins in the context of Reactome pathways. This protocol describes how to navigate and use the pathway browser to visualize predicted interacting pathways for a protein. The following protocols describe how to use overlay features.
For the purpose of illustrating expected results, the dark protein TANC1 will be used as an example:
| Protein: | Gene name: TANC1 |
| UniProt accession number: Q9C0D5 | |
| Search parameters: | Functional interaction score ≥ 0.8 |
| FDR of interacting pathways < 0.05 | |
| Chosen sources: none |
Necessary Resources
Hardware:
Computer capable of supporting a Web browser and an Internet connection.
Software:
A modern Web browser such as Chrome, FireFox, or Safari with JavaScript enabled to display Reactome-IDG pages.
Protocol steps with step annotations
-
Search for a term (TANC1) on the Reactome-IDG homepage at https://idg.reactome.org (described in Basic Protocol 1).
The Reactome-IDG homepage directly connects pathways to the IDG pathway browser, facilitating seamless access for users through pathway links. We recommend using the Reactome-IDG pathway browser as described in this protocol with features highlighted for a search term. The “Launch the IDG Pathway Browser” card at the top of the Reactome-IDG homepage will launch the pathway browser. However, features for a searched term will not be loaded .
-
Click a pathway link (e.g. R-HAS-442755, https://idg.reactome.org/PathwayBrowser/#/R-HSA-442755&FLG=TANC1&FLGINT&DSKEYS=0&SIGCUTOFF=0.8&FLGFDR=0.05) on the Reactome-IDG homepage to visualize the interacting pathway for the searched term in the pathway browser. There are several links located on the Reactome-IDG homepage to view pathways at various levels: from the annotated pathways section, from the interacting pathways section, and the “Open Pathway Browser” button. Each section is described below.
In the annotated pathways section (Fig. 8) all top and lower-level pathways are displayed as links to the pathway browser. Click a pathway and the web browser will open the pathway browser page to the clicked pathway. The annotated pathways panel is only displayed for annotated proteins so ALDOB is used instead of TANC1 in Fig. 8.
The table displayed within the Interacting Pathways card (Fig. 9) lists the pathway stable ids for each of the interacting pathways as hyperlinks. Clicking one of these links will show the related pathway diagram in the pathway browser in another web browser tab. The table also provides an arrow on the far left of each row that displays the pathway hierarchy for each interacting pathway when clicked (Fig. 9). Each of the higher-level pathways can also be clicked and the pathway browser page will redirect to the corresponding pathway diagram.
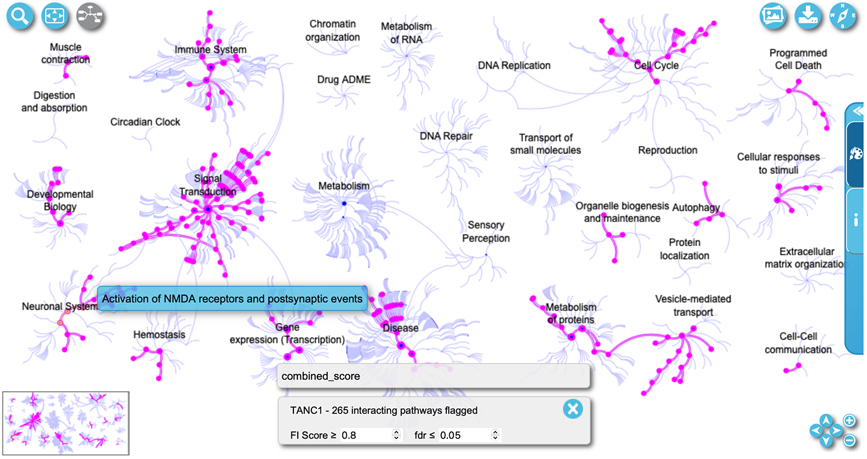
The “Open Pathway Overview” button towards the top of the interacting pathways panel (Fig. 10) will also open the pathway browser with an overview of all pathways in Reactome, where the pathways that interact with the queried protein are highlighted magenta (Fig. 11). Users can adjust the FI score or the FDR thresholds of interacting pathways for highlighting. The control panel is located at the bottom of the overview.
-
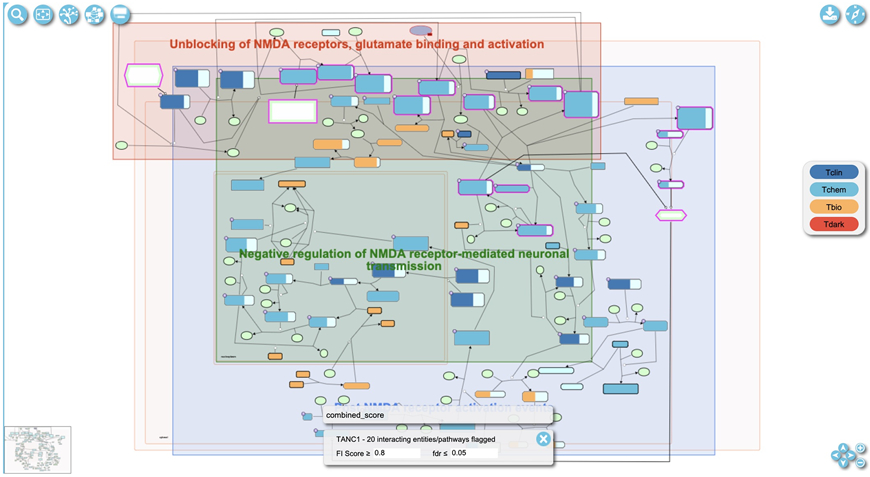
Select a pathway of interest (e.g. Activation of NMDA receptors and postsynaptic events) in the pathway overview (Fig. 11) to view detailed information about it. The “Open pathway diagram” button is located at the top left corner of the pathway overview as shown in Fig. 11. The button is disabled if no pathway is selected in the overview and enabled after a pathway is selected. Clicking this button will open the pathway diagram view (Fig. 12). The user may also double click a pathway in the pathway overview to open the diagram in the pathway browser.
In the diagram view (Fig. 12) entities with magenta borders are colored to indicate that they are predicted to functionally interact with TANC1 at the given parameters. The gray box in the lower middle of Fig. 12 displays the flag for what types of interactions are displayed. The “combined_score” flag is displayed by default, indicating the predicted FIs are used for interacting pathways. Other flags are added as pairwise relationships overlaid (described in Basic Protocol 4). If the current flag indicated is for a combined score of all interactions, the user can adjust the score to be more or less strict and thus adjust the interactors shown. The score cutoff can be adjusted in the control panel at the bottom of the diagram labeled “FI score” for functional interaction score. To the right of the “FI score” the false discovery rate labelled “fdr”of interacting pathways can also be adjusted.
-
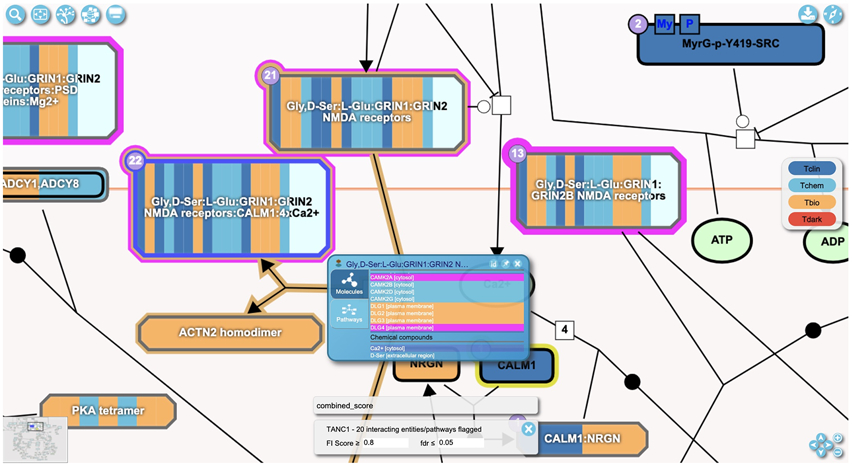
Zoom into the diagram by scrolling with a mouse or using the “+” button at the lower right corner (Fig. 12) to view detailed annotation of the pathway (e.g. complex compositions and numbers of interacting drugs). Fig. 13 shows an example of a zoomed-in view of three complexes (“Gly,D-Ser:L-Glu:GRIN1:GRIN2 NMDA receptors”, “Gly,D-Ser:L-Glu:GRIN1:GRIN2B NMDA receptors” and “Gly,D-Ser:L-Glu:GRIN1:GRIN2 NMDA receptors:CALM1:4xCa2+”) in the “Ca2+ influx into the post-synaptic cell” pathway accessible via https://idg.reactome.org/PathwayBrowser/#/R-HSA-442755&SEL=R-HSA-432164&PATH=R-HSA-112316,R-HSA-112315,R-HSA-112314&FLG=TANC1&FLGINT&DSKEYS=0&SIGCUTOFF=0.8&FLGFDR=0.05. The borders of these three complexes are colored in magenta, indicating that proteins annotated in these complexes are predicted to functionally interact with the query protein (here TANC1). The numbers at the top left purple corner of the complex indicate the numbers of drugs that can bind to any proteins annotated in the complex.
A complex is displayed with multiple vertical bars, each of which represents a subunit of the complex. Proteins of the complex are colored according to their knowledge level (Tclin, Tchem, Tbio and Tdark) (Opera et al., 2018) as shown in the legend at the right of Fig. 13. A popup panel will open after right-clicking an entity. The “Molecules” tab in the panel shows the annotated entities (proteins and chemical compounds) that comprise the complex entity. The “Pathways” tab lists other pathways the entity is involved in.
Drugs are indicated by a purple circle at the top left corner of an entity. The number inside the circle is the number of drugs that interact with the entity. To visualize the interaction of a drug with an entity in a pathway, see Basic Protocol 5.
-
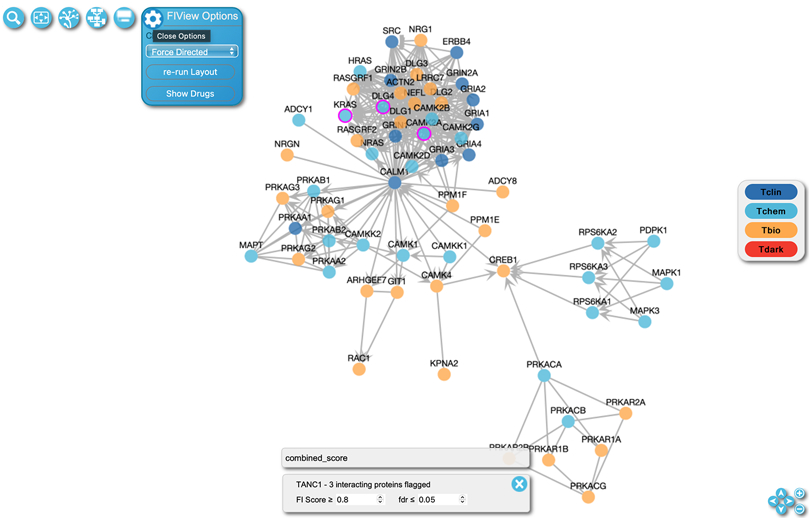
Click the “Cytoscape View” button in the top left button bar (the second from right button as shown in Fig. 13) to view the pathway as a functional interaction network of proteins (Fig. 14).
The nodes in the FI network view represent the proteins annotated in the pathway. The node’s gene name and UniProt accession will be displayed when the user hovers over it. The “FIView Options” button on the top left of the view opens the network configuration panel when clicked as shown in Fig. 14. The user may perform automatic layout using one of four algorithms: force directed, grid, circle, and random. The user may overlay drug interactions on the network by clicking “Show Drugs” as described in Basic Protocol 5. By default, nodes are colored based on their knowledge levels as indicated in the key on the left of the panel. The borders of nodes for proteins that are predicted to functionally interact with the query protein (e.g. TANC1) are colored in magenta as shown for KRAS. The user may adjust the FI Score cutoff to select interacting proteins to highlight.
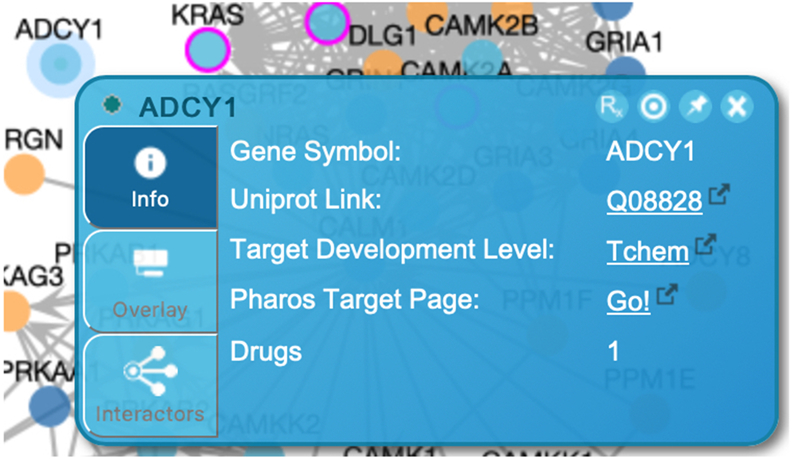
To view more information about the protein, right click the node and a panel will be displayed (Fig. 15). This panel contains three tabs. The first tab provides identifier information about the protein and links to other resources. Information about existing tissue specific expression overlay is located in the second tab (described below in Basic Protocol 3). The third tab describes overlaid pairwise interactions (described below in Basic Protocol 4). The second and third tabs will not display information if the Overlay Tool has not been used. In the top right corner there are three buttons. The leftmost button will open the protein in an interaction popup panel if pairwise relationships have been added using the Overlay Tool (described in Basic Protocol 4). The center button will pin the panel so the panel does not close during other clicks, and the rightmost button closes this panel.
The Edges in the FI network view (Fig. 14) represent functional interactions extracted from complexes and biochemical reactions annotated in the Reactome pathway. Edges are displayed with a tee’d end to indicate inhibition, or an arrowed end to indicate catalysis or activation. Edges having neither of these are interactions extracted from complexes or inputs participating in the same reactions. The UniProt accession numbers of the proteins involved in the functional interaction will be shown when hovering over an edge. Right clicking an edge will display a panel listing the Reactome sources (i.e. reactions and complexes) the clicked FI is extracted from. An FI may be extracted from multiple reactions or complexes, and users can choose a reaction or complex to visualize its detailed information in the “Details Panel” at the bottom of the pathway browser.
Figure 8.
The annotated pathway section where each pathway links to the pathway browser.
Figure 9.
The table in the “Interacting Pathways” card displays the stable ids of pathways and their corresponding higher-level pathways, accessible by clicking the arrows located on the far left of each row. The pathways listed under “Hierarchy” are displayed as links to the pathway browser.
Figure 10.
The top of the interacting pathways panel contains a button labeled “OPEN PATHWAY OVERVIEW” that will launch the pathway browser.
Figure 11.
The interacting pathways of TANC1 with FI Score ≥ 0.8 and fdr ≤ 0.05 are highlighted in magenta in the pathway overview at the Reactome-IDG pathway browser.
Figure 12.
The pathway diagram for “Activation of NMDA receptors and postsynaptic events”, an interacting pathway of TANC1. This pathway can be accessed with the link, https://idg.reactome.org/PathwayBrowser/#/R-HSA-442755&FLG=TANC1&FLGINT&DSKEYS=0&SIGCUTOFF=0.8&FLGFDR=0.05.
Figure 13.
Zooming into the pathway diagram shows more details about the entities in the diagram. The user can also right-click an entity to open a popup panel to visualize even more information about the clicked entity (shown for complex, Gly,D-Ser:L-Glu:GRIN1:GRIN2 NMDA receptors:CALM1:4xCa2+).
Figure 14.
The Function Interaction (FI) View for the “Activation of NMDA receptors and postsynaptic events” pathway. This FI view of the pathway can be accessed with the link, https://idg.reactome.org/PathwayBrowser/#/R-HSA-442755&PATH=R-HSA-112316,R-HSA-112315,R-HSA-112314&FLG=TANC1&FLGINT&DSKEYS=0&SIGCUTOFF=0.8&FLGFDR=0.05&FIVIZ.
Figure 15.
Protein information panel for ADCY1, a protein displayed in the FI network view for the “Activation of NMDA receptors and postsynaptic events” pathway (Fig. 14).
BASIC PROTOCOL 3
Overlaying Tissue Specific Expression Data
The Reactome-IDG web portal integrates "the Target Central Resource Database (TCRD)" database (Sheils, Mathias, Kelleher, et al. 2021), which collects 19 tissue specific gene and protein expression datasets from a variety of data sources, such as CCLE (Barretina, Caponigro, Stransky, Venkatesan, et al. 2012), GTEx (GTEx Consortium. 2013), HPA (Uhlén, Fagerberg, Hallström, Lindskog, et al. 2015), and many others. Visualizing tissue specific gene or protein expression data in combination with dark protein interactions directly on the top of a pathway displayed as a SBGN diagram or a FI network facilitates the understanding of the functional relationships between the dark protein and its interacting pathways. This protocol describes how to use the overlay tool to overlay tissue specific expression data on the pathway diagram view and the FI network view.
Necessary Resources
Hardware:
Computer capable of supporting a Web browser and an Internet connection.
Software:
A modern Web browser such as Chrome, FireFox, or Safari with JavaScript enabled to display Reactome-IDG pages.
Protocol steps with step annotations
-
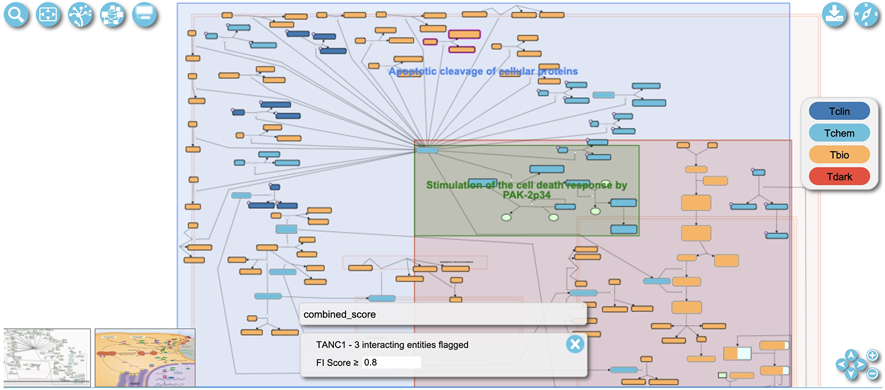
Select a pathway of interest in the pathway browser (described in Basic Protocol 2) and use the “Open pathway diagram” button located at the top left of the page (Fig. 11) to open the pathway diagram view (Fig. 16). The pathway used in this protocol is “Apoptotic execution phase”, which is accessible via the link, https://idg.reactome.org/PathwayBrowser/#/R-HSA-75153&FLG=TANC1&FLGINT&DSKEYS=0&SIGCUTOFF=0.8&FLGFDR=0.05. The link opens the pathway directly in the diagram view. Click the Overlay Tool button located in the top left of the Pathway Diagram view (the rightmost button as shown in Fig. 16) to open the Overlay Tool panel (Fig. 17).
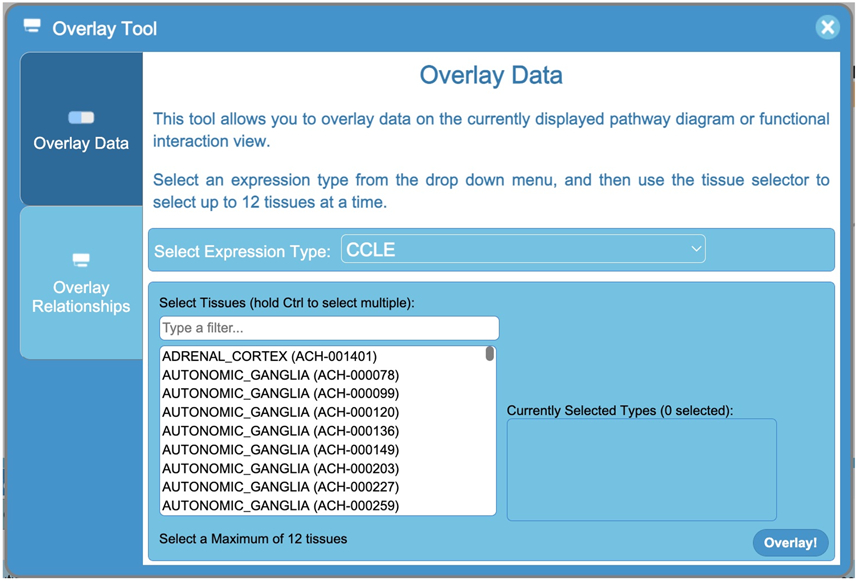
The Overlay Tool panel (Fig. 17) contains two tabs. The first tab, Overlay Data, provides interfaces for users to choose tissue specific gene and protein expression data to overlay on the diagram, and its use will be described in this Protocol. The second tab, Overlay Relationships, implements interfaces for users to choose pairwise relationships to overlay (See Basic Protocol 4 on how to overlay relationships). In the Overlay Data tab, the “Select Expression Type” drop down list allows users to select an expression type from the listed data sources. Once an expression type is selected, the user can select up to 12 tissue types or cell lines in the “Select Tissues” list to overlay. To select multiple tissues at once, the user can hold the control (or command on mac) key. The user can also hold the shift key while clicking one tissue and then another to select all tissues between the two clicked tissues. There is a filter box above the tissue selection list that allows users to filter for tissues based on entered letters.
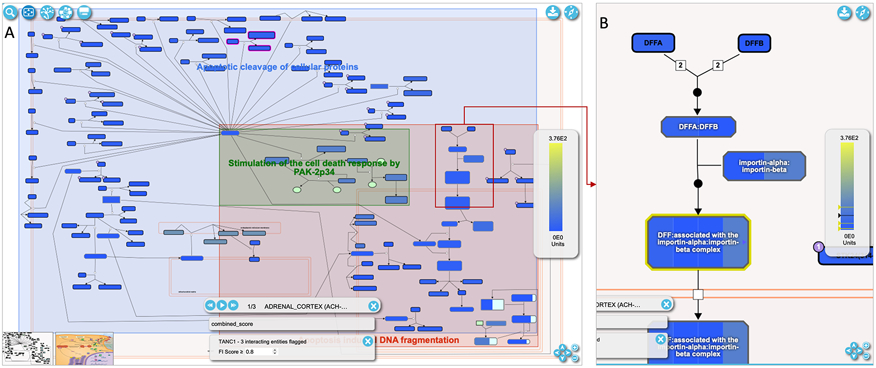
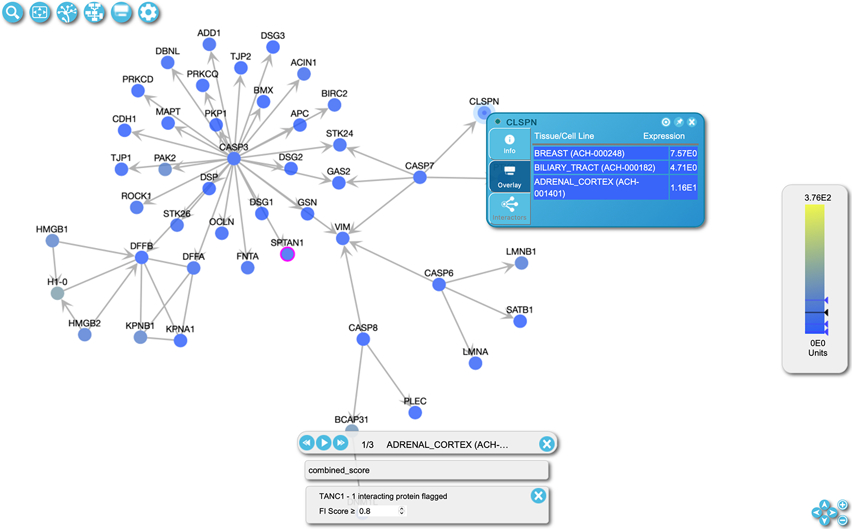
Fig. 18A shows the pathway diagram with tissue specific expression data overlaid. The scale for the expression values is shown at the right side of the diagram. There is also a control at the bottom of the diagram view to cycle through each of the overlaid tissues. Users can use the forward and backward buttons to observe overlaid data for each of the tissues, or use the play button to visualize the tissues sequentially. There is a close button at the top right of the control panel to remove the overlay when finished.
Within the diagram view the average expression value of the proteins in the complex are used to recolor the complexes when the view is zoomed out into a large scale. The overlay on a complex will become segmented when the user zooms in, with each segment’s color representing the expression value of a single protein annotated in that complex (e.g. four proteins, DFFA, DFFB, KPNA1, KPNB1, in the “DFF:associated with the importin-alpha:importin-beta complex” complex as shown in Fig. 18B). To view the expression values for individual proteins in each of the selected tissues, users can right click any complex or protein and a table showing these expression values will be displayed.
-
Click the “Cytoscape View” button located at the top left corner of the diagram view (the second button to the right as shown in Fig. 18) to switch the pathway diagram view to the FI network view. The overlaid expression values stay with proteins that are displayed as nodes in the network view. The user can also overlay the expression values directly by clicking the Overlay Tool button located at the top left corner of the FI network view (Fig. 19). The overlay data panel described in the previous step (Fig. 17) will appear with the same functionality.
In the FI network view, each protein is recolored according to its expression after overlaying (Fig. 19). The proteins that don’t have expression values reported for the given expression type are colored green. Expression values for individual proteins for all selected tissues can be viewed in the “Overlay” tab in the panel displayed in Fig. 19 by right clicking a protein.
When the FI view is switched to the pathway diagram view or vice versa, all overlaid data is kept.
Figure 16.
The pathway diagram view. The pathway in this view is “Apoptotic execution phase”, accessible via the link, https://idg.reactome.org/PathwayBrowser/#/R-HSA-75153&FLG=TANC1&FLGINT&DSKEYS=0&SIGCUTOFF=0.8&FLGFDR=0.05.
Figure 17.
The Overlay Data tab in the Overlay Tool panel allows users to overlay tissue specific gene and protein expression data onto the displayed pathway diagrams or the FI network.
Figure 18.
A. Tissue specific expression data overlaid on the diagram view of the “Apoptotic execution phase” pathway, which is accessible via the link, https://idg.reactome.org/PathwayBrowser/#/R-HSA-75153&PATH=R-HSA-5357801,R-HSA-109581&FLG=TANC1&FLGINT&DSKEYS=0&SIGCUTOFF=0.8&FLGFDR=0.05. B. A zoomed-in view of the pathway diagram highlights a reaction with complexes annotated. These complexes have annotated proteins with their expression displayed in segments (e.g. DFF:associated with the importin-alpha:importin-beta complex having four segments corresponding to four proteins, DFFA, DFFB, KPNA1, KPNB1).
Figure 19.
Tissue specific data overlaid on the FI network view for the “Apoptotic execution phase” pathway. The FI network view of this pathway is accessible via https://idg.reactome.org/PathwayBrowser/#/R-HSA-75153&PATH=R-HSA-5357801,R-HSA-109581&FLG=TANC1&FLGINT&DSKEYS=0&SIGCUTOFF=0.8&FLGFDR=0.05&FIVIZ.
BASIC PROTOCOL 4
Overlaying Protein/Gene Pairwise Relationships
The Reactome-IDG web portal provides pairwise relationship datasets collected from multiple sources (e.g. GTEx, TCGA, StringDB and Harmonizome) (Brunson, Sanati, Matthews, et al., 2023) to overlay on existing diagrams. The pairwise datasets can be varied by relationship type, data source, and bioSource (i.e. species, organ, tissue or cell line) and the users may choose them based on these criteria. The overlaid pairwise relationships may be investigated further by opening the pairwise popup, a network view of the overlaid pairwise relationships for an entity in the pathway diagram or a protein in the FI network view. This protocol describes how to use the overlay tool to overlay pairwise relationships on the displayed pathway diagrams or the FI network view.
Necessary Resources
Hardware:
Computer capable of supporting a Web browser and an Internet connection.
Software:
A modern Web browser such as Chrome, FireFox, or Safari with JavaScript enabled to display Reactome-IDG pages.
Protocol steps with step annotations
Select a pathway of interest in the pathway browser overview (described in Basic Protocol 2) and use the “Open pathway diagram” button in the top left of the page (Fig. 11) to open the pathway diagram view (Fig. 20). The pathway used in this protocol is “Transcriptional regulation by RUNX3”, which can be accessed via https://idg.reactome.org/PathwayBrowser/#/R-HSA-8878159&FLG=TANC1&FLGINT&DSKEYS=0&SIGCUTOFF=0.8&FLGFDR=0.05. This link opens the pathway directly in the diagram view.
-
Click the Overlay Tool button located in the top left of the Pathway Diagram view (the rightmost button as shown in Fig. 20) to open the Overlay Tool panel and then select the “Overlay Relationships” tab in the panel (Fig. 21).
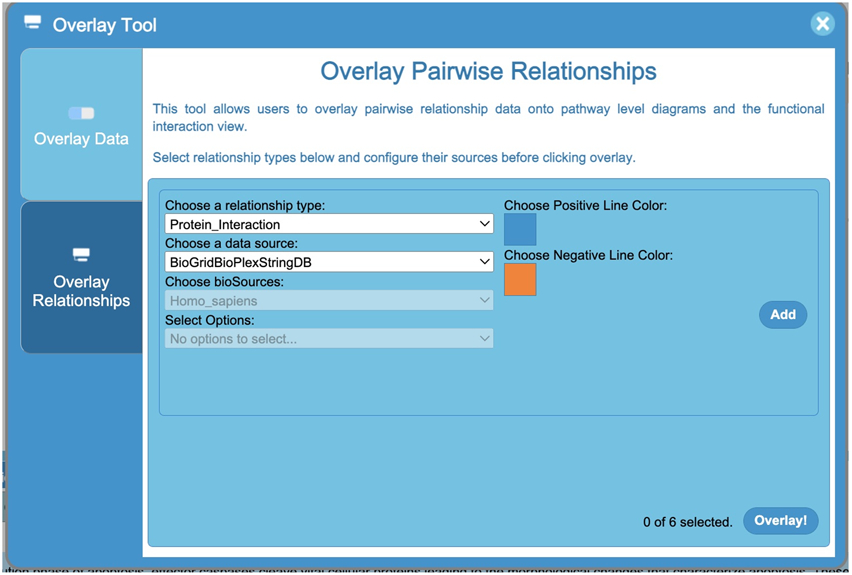
The Overlay Pairwise Relationships Tool (Fig. 21) in the bottom tab of the Overlay Tool panel allows pathway diagrams to be overlaid with pairwise relationship data. The relationship datasets may be selected by first choosing a relationship type, then a data source, and a BioSource. For “Gene_Similarity”, the user may select the datasets according to the data sources originally collected by the Harmonizome project (e.g. achilles, encodetf or hpo) (For more information about the Harmonizome data sources, see https://maayanlab.cloud/Harmonizome/download). The options included in each dropdown list will be populated based on the previous selections made. To differentiate between positive and negative interactions if available, users can select a line color for each added interactor set. Up to 6 sets of interactions can be overlaid at a time. Click the “Add” button to add a relationship for overlaying and click the “Overlay!” button to overlay the added pairwise relationships.
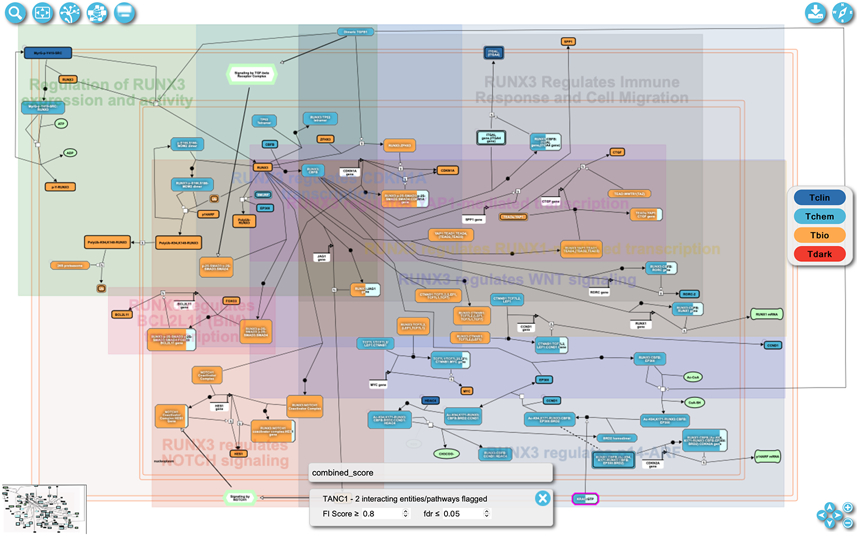
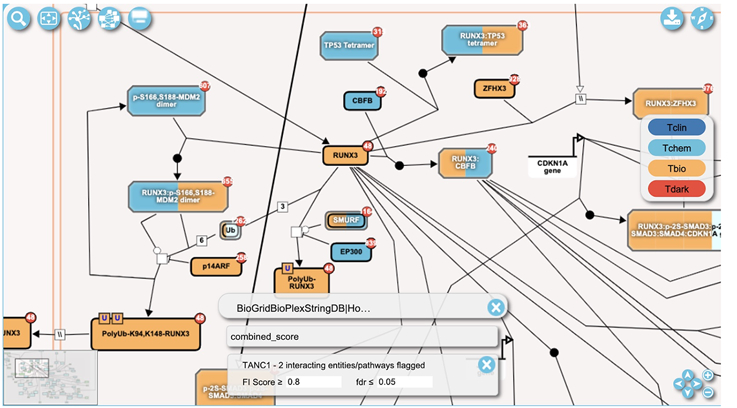
In the pathway diagram view a control panel appears at the bottom once a set of pairwise relationships have been overlaid. The control panel contains a close button to remove the overlaid data and a message about the loaded relationship datasets. In the pathway diagram view (Fig. 22) entities display red circles at the top right corners showing the numbers of pairwise interactors that exist. The user can click a circle to open a “pairwise popup” for the chosen entity as described in step 4.
-
Click the “Cytoscape View” button (the second to the right) located in the top left of the diagram view (Fig. 22) to switch to the FI network view to visualize overlaid results in the network view (Fig. 23).
The pairwise relationships can also be overlaid directly in the FI network view of the pathway. Click the Overlay Tool button located in the top left of the FI network view (Fig. 23). The overlay data panel described in the previous step (Fig. 21) will appear with the same functionality.
-
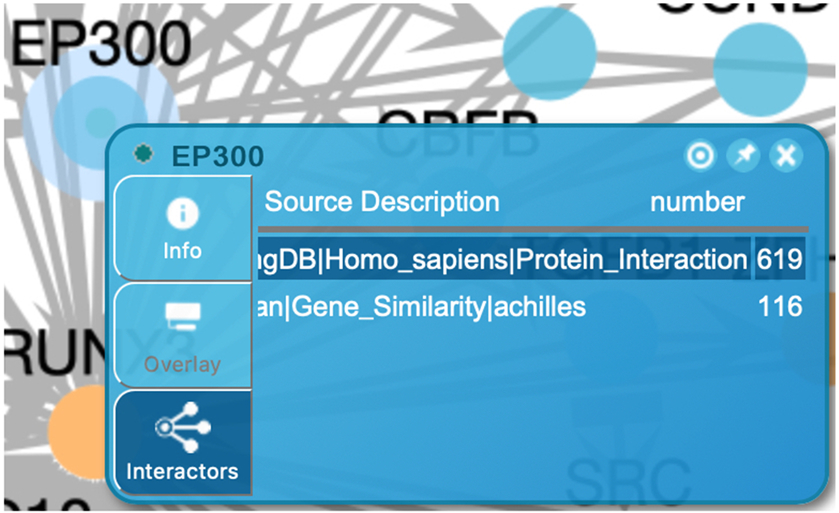
Right click a node in the FI network view to open a popup panel (Fig. 24) and then click the “Show Pairwise Relationships” button (target icon, the leftmost button) in the top right corner of the panel to open the pairwise popup (Fig. 25).
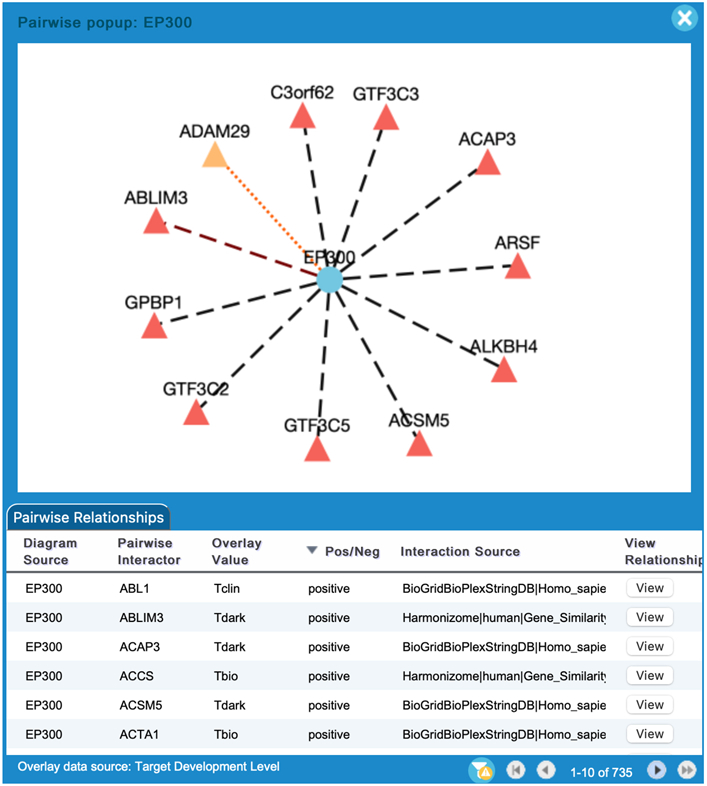
In the pairwise popup a functional interaction network (Fig. 25) shows the clicked protein at the center and its interactions. When many interactors are available the first 10 will be shown for the clicked protein. Dark (Tdark) proteins will be displayed before other interactors. The source node (i.e. the clicked protein, EP300 in Fig. 25) is represented by circles and interactors are represented by triangles. The nodes are colored according to the tissue specific expression overlaid when expression data is overlaid. Otherwise, they are colored according to their knowledge levels. The edges are colored according to the interaction set, which is configured in the Overlay Pairwise Relationships panel (see step 2). The dash lines represent positive relationships while the dotted lines represent negative relationships. The user can remove interactors that are not of interest by right clicking on the node and selecting “remove”. The source node cannot be removed.
In the pairwise relationships table as shown at the bottom of Fig. 25, users can view all of the available interactions for the source node. The table lists the diagram source node, the interaction source, the current overlay value if existing, and the interaction type (positive or negative) for the chosen interactor. Interactors can be added to the network by clicking the “View” button.
The pairwise popup can also be opened by clicking the red circle located at the top right corner of an entity drawn in the pathway diagram view (e.g. the red circle labeled with 48 in protein RUNX3 in Fig. 22).
Figure 20.
The pathway diagram view. The pathway in this view is “Transcriptional regulation by RUNX3”, which can be accessed via https://idg.reactome.org/PathwayBrowser/#/R-HSA-8878159&FLG=TANC1&FLGINT&DSKEYS=0&SIGCUTOFF=0.8&FLGFDR=0.05.
Figure 21.
The Overlay Data Tool for Pairwise Relationships for users to choose the relationship datasets based on the relationship type, data source, and BioSource (e.g. species, tissue, cell type or cell line).
Figure 22.
Protein/Gene Pairwise relationships overlaid on the pathway diagram view of the “Transcriptional regulation by RUNX3” pathway. The view has been zoomed in around protein “RUNX3”.
Figure 23.
Protein/Gene Pairwise relationships overlaid onto the FI network view of the “Transcriptional regulation by RUNX3” pathway.
Figure 24.
The information panel with the “Interactors” tab selected. The tab shows the "Show Pairwise Relationships” button at the top right (the target icon). Clicking this button opens the pairwise relationship network view (Fig. 25).
Figure 25.
The pairwise relationship view contains a network and a table. The network displays the original protein in the circle (here EP300) at the center and the overlaid interactors in the triangles around the circle. The nodes are colored based on the knowledge levels. The edges are colored according to the colors configured when the data is selected in the Overlay Data Tool pane (Fig. 21). The dash lines represent positive relationships while the dotted lines represent negative relationships. The table lists all overlaid interactions for the original protein.
BASIC PROTOCOL 5
Visualizing Drug/Target Interactions in the Pathway Context
One of the major functions of the Reactome-IDG portal is to reveal therapeutic potential of dark proteins to guide experimentally testable hypotheses. To this end, drug/target interactions can be overlaid on the pathway diagram and the FI network in the Reactome-IDG pathway browser. Drug/target relationships are also displayed in the pairwise popup. This protocol describes how to visualize drug/target interactions in the diagram, FI network, and pairwise popup.
Necessary Resources
Hardware:
Computer capable of supporting a Web browser and an Internet connection.
Software:
A modern Web browser such as Chrome, FireFox, or Safari with JavaScript enabled to display Reactome-IDG pages.
Protocol steps with step annotations
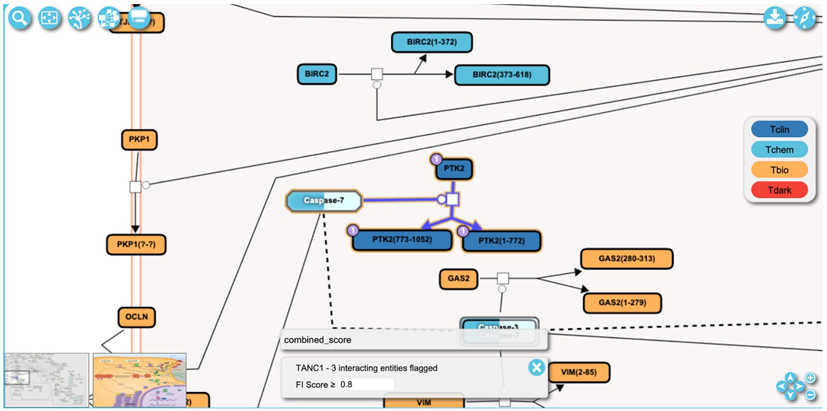
In the pathway diagram view of the Reactome-IDG pathway browser (Basic Protocol 2), zoom into the diagram to view more detailed information of the pathway. The pathway used in this protocol is “Apoptotic execution phase” accessible via this link, https://idg.reactome.org/PathwayBrowser/#/R-HSA-75153&SEL=R-HSA-201634&PATH=R-HSA-5357801,R-HSA-109581&FLG=TANC1&FLGINT&DSKEYS=0&SIGCUTOFF=0.8&FLGFDR=0.05 (Fig. 26). The detailed information includes drug-target interactions, which are represented by a purple circle at the top left corner of an entity. The number inside the circle is the number of drugs that interact with the entity. For example, number 1 inside the purple circle at the top left corner of protein PTK2 indicates there is one drug interacting with PTK2 (Fig. 26).
-
Click a purple circle to open a popup for interactions between the drug(s) and the entity (Fig. 27).
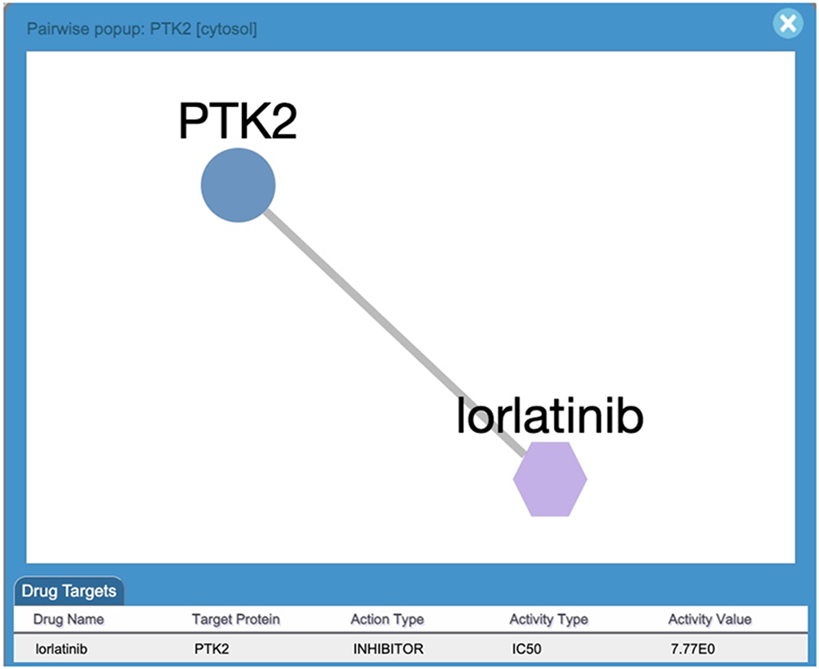
Users can view information for each of the displayed interactions between the drugs and the entity in the “Drug Targets” table. This information includes: the protein target the drug interacts with, the action type (e.g. inhibitor or activator), and the drug activity measure method (activity type , e.g. IC50) and activity value collected in the original TCRD database (Sheils, , Mathias, Kelleher, et al. 2021). The drugs are represented as purple hexagons.
-
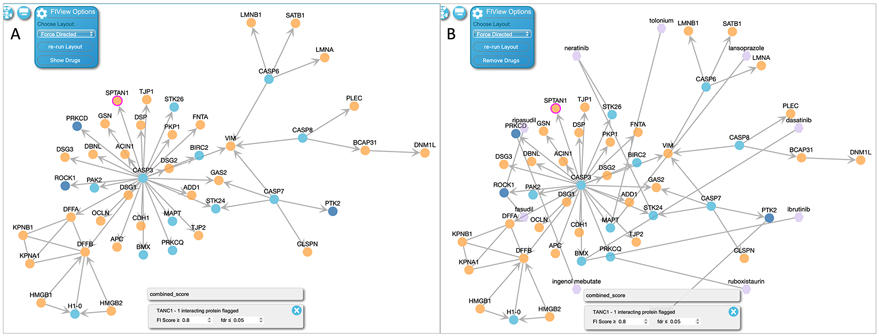
In the FI network view the user can select the “Show Drugs” button at the bottom of the network configurations panel as shown at the top left of Fig. 28A. The nodes representing drugs are hexagon shaped and colored purple (Fig. 28B).
To remove drugs from the network, click “Remove Drugs” in the network configuration panel (Fig. 28B).
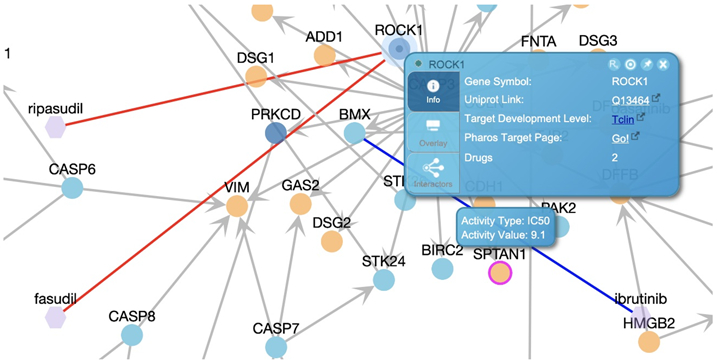
In the FI network view of the pathway overlaid with drug and target interactions (Fig. 28B), right click a protein or drug node to open up the information panel for the clicked node. Fig. 29 shows such an information panel for protein ROCK1, where clicking the “Rx” icon located in the top right will open the pairwise popup showing interactions between ROCK1 and drugs targeting it.
Figure 26.
A zoomed in view of the pathway diagram shows overlaid drug interactions as purple circles at the top-left corner of entities. The number indicates the number of drugs that can interact with the entity. The reaction highlighted in this diagram is “Caspase-mediated cleavage of FADK 1” and can be accessed via https://idg.reactome.org/PathwayBrowser/#/R-HSA-75153&SEL=R-HSA-201634&PATH=R-HSA-5357801,R-HSA-109581&FLG=TANC1&FLGINT&DSKEYS=0&SIGCUTOFF=0.8&FLGFDR=0.05.
Figure 27.
A Pairwise Popup of drug/target interactions containing a network and a table. The network shows the protein target (e.g. PTK2) in circle and the drug (e.g Iorlatinib) in purple hexagon. The target is colored according to its knowledge level. The table lists all drug/target interactions.
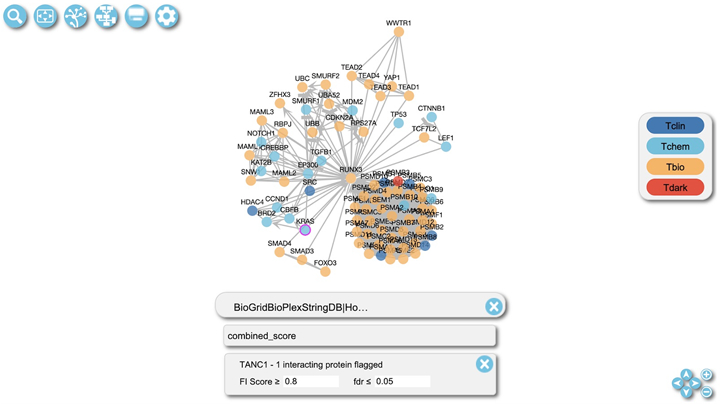
Figure 28.
A: The FI network view of the pathway where the user can overlay drugs by clicking “Show Drugs” in the network setting. B: The FI network view with drugs overlaid. The user can remove drugs by clicking “Remove Drugs” in the network setting. This FI network view is for the “Apoptotic execution phase” pathway and can be accessed via the link, https://idg.reactome.org/PathwayBrowser/#/R-HSA-75153&PATH=R-HSA-5357801,R-HSA-109581&FLG=TANC1&FLGINT&DSKEYS=0&SIGCUTOFF=0.8&FLGFDR=0.05&FIVIZ.
Figure 29.
The FI network view with a target (ROCK1) selected to show drug interactions in red edges. The information panel is shown by right clicking the target.
COMMENTARY:
Background Information:
The Reactome-IDG web portal was designed to place understudied or dark proteins in the context of the Reactome annotated pathways, facilitating the inference and learning of the functions of these proteins in the framework of human annotated pathways. The portal can also be used for proteins that have not been annotated in Reactome. To build this portal, we expanded our original functional interaction prediction workflow (Wu & Haw, 2017) by collecting 106 protein/gene pairwise features from multiple resources and training a random forest machine learning model using the FIs extracted from Reactome annotated biochemical reactions and complexes as the training dataset. After that, the trained random forest model was used to predict functional interactions for protein pairs, and predicted interaction partners were collected for pathway enrichment analysis. The analysis results, which are reported as pValues based on binomial tests and FDRs (False Discovery Rates) after multiple hypothesis correction using the Benjamini-Hochberg procedure (Benjamini & Hochberg, 1995) as shown in the Reactome-IDG web portal, measure the likelihood and strength of the interaction pathways for dark proteins quantitatively (Brunson, Sanati, Matthews, et al., 2023).
Pathways in Reactome are organized hierarchically as they are in standard biochemistry textbooks for easy data management, curation, and visualization. Higher level pathways contain more entities than lower level pathways. In the Reactome pathway browser, higher level pathways are presented with high-level SVG (scalable vector graph)-based diagrams while lower level pathways are visualized with SBGN-based diagrams with detailed information of reactions, including inputs, outputs, catalysts, regulators and reaction types, laid out (Gillespie et al., 2022). Some lower level pathways don’t have their own SBGN-based diagrams and are drawn as parts of their higher level containing pathways. To facilitate the visualization, the Reactome-IDG portal analyzes pathways that have their own SBGN-based diagrams only at its homepage. In total, 524 pathways were chosen as potential interacting pathways for dark proteins.
To validate the predicted interacting pathways, we conducted two systematic analyses: 1). We analyzed a single cell RNA-seq dataset, which is independent of any pairwise features used to train the random forest model, to build a gene co-expression network and then analyzed interacting pathways for proteins using their co-expression partners. Correlation analysis between the interaction pathway scores from this scRNA-seq data and the scores from predicted functional interactions showed a significantly positively skewed distribution, supporting our prediction results; 2). We developed an NLP (natural language processing) workflow to compare PubMed abstracts and Reactome’s text summaries of pathways and reactions after embedding them into numeric vectors using BERT, a pre-trained deep learning language model (Devlin et al., 2019). For individual genes, we calculated the top pathways where the gene may be annotated based on the similarity of abstracts and Reactome pathways and then calculated the correlation between the annotation possibilities and interaction pathway scores based on predicted FIs. Similar to the results from the scRNA-seq analysis, we observed a significantly positively skewed distribution of the correlation. In addition to these two computation-based approaches, we also randomly chose 20 dark proteins and performed literature searches for evidence supporting their involvement in the predicted interacting pathways. In the majority of cases, direct experimental evidence was found linking the function of the protein to a possible role in at least one of the predicted interacting pathways. These validation results provide overall support for the predicted interacting pathways. However, it is important to note that Reactome's pathways are annotated through the collection of evidence from diverse experimental systems, encompassing various tissues and cell types. Likewise, the training of the random forest model incorporated over 100 features, representing numerous cell types. As a result, our prediction results of interacting pathways are not specific to any particular tissue or cell type and should be interpreted with caution when applied to such contexts (Brunson, Sanati, Matthews, et al., 2023).
Pharos (Sheils, Mathias, Kelleher, et al., 2021) is the official web site of the NIH IDG program, providing a collection of resources for all proteins, including understudied proteins and well studied proteins. A protocol has been published to describe how to use Pharos for the druggable genome study (Sheils, Mathias, Siramshetty, et al. 2020). The enhanced Reactome IDG pathway diagram widget has been integrated into Pharos (e.g. https://pharos.nih.gov/targets/NTN1#pathways), allowing researchers to investigate dark proteins using Reactome without leaving Pharos. However the Reactome IDG web portal provides a dedicated place for users to study understudied proteins in the context of Reactome pathways with other Reactome analysis and visualization features as well as better performance. The homepage of the portal provides a much enhanced user experience for researchers to explore interaction pathways without constraints of limited space at Pharos. Furthermore, the Reactome IDG web portal uses the same backend database, TCRD (Sheils, Mathias, Kelleher, et al. 2021), as Pharos, to provide tissue specific protein and gene expression data and drug/target interactions for overlay.
Very recently, a new initiative has been launched to study understudied proteins (https://understudiedproteins.org, Kustatscher, 2022) with a focus on using proteomics technologies for detailed mechanistic insights. The predicted interacting Reactome pathways for understudied proteins will provide some starting points to undertake such studies. We expect to work with other groups in the community to integrate our results with their resources to create a more sophisticated, integrative workspace to learn about understudied proteins’ functions and their therapeutic potentials.
Critical Parameters:
The interacting pathways of a protein are predicted and scored based on the functional interactions of the protein. In order to collect those function interactions, a FI score threshold needs to be used. This threshold determines how many FIs are used for interacting pathways prediction. Different thresholds may yield different results. Users are recommended to try different thresholds and compare the final results.
Troubleshooting:
The Reactome-IDG portal’s search for interacting pathways (Basic Protocol 1) supports human proteins and genes only. It accepts UniProt accession numbers and standard human gene symbols. Users have to make sure they are using these two types of identifiers to return the results.
ACKNOWLEDGEMENTS:
(mandatory for NIH, optional for all others)
The Reactome-IDG project is supported by grants from the U.S. National Institutes of Health (U01CA239069 and U24 HG0012198).
Footnotes
CONFLICT OF INTEREST STATEMENT:
None declared.
DATA AVAILABILITY STATEMENT:
The data that support the Reactome-IDG are available at the Download page: https://idg.reactome.org/documentation/downloads. These data were derived from the following resources available in the public domain:
GTEx portal: https://gtexportal.org/home/
TCGAportal: http://www.tcgaportal.org/
Harmonizome: https://maayanlab.cloud/Harmonizome/
StringDB: https://string-db.org/
BioGrid: https://thebiogrid.org/
BioPlex: https://bioplex.hms.harvard.edu/
TCRD: http://juniper.health.unm.edu/tcrd/
Gene ontology annotation: http://geneontology.org/
pFam: https://www.ebi.ac.uk/interpro/
ENSEMBL Compara: http://ensembl.org/info/genome/compara/index.html
Panther: http://www.pantherdb.org/
Reactome: https://reactome.org
LITERATURE CITED:
- Barretina J, Caponigro G, Stransky N, Venkatesan K, Margolin AA, Kim S, Wilson CJ, Lehár J, Kryukov GV, Sonkin D, Reddy A, Liu M, Murray L, Berger MF, Monahan JE, Morais P, Meltzer J, Korejwa A, Jané-Valbuena J, … Garraway, L.A. (2012). The Cancer Cell Line Encyclopedia enables predictive modelling of anticancer drug sensitivity. Nature, 483(7391), 603–7. 10.1038/nature11003 [DOI] [PMC free article] [PubMed] [Google Scholar]
- Benjamini Y, & Hochberg Y (1995). Controlling the false discovery rate: A practical and powerful approach to multiple testing. Journal of the Royal Statistical Society: Series B (Methodological), 57(1), 289–300. 10.1111/j.2517-6161.1995.tb02031.x [DOI] [Google Scholar]
- Brunson T, Sanati N, Matthews L, Haw R, Beavers D, Shorser S, Sevilla C, Viteri G, Conley P, Rothfels K, Hermjakob H, Stein L, D'Eustachio P, & Wu G (2023). bioRxiv, 2023.06.05.543335 10.1101/2023.06.05.543335 [DOI] [PMC free article] [PubMed] [Google Scholar]
- Devlin J, Chang M-W, Lee K, & Toutanova K (2019). Bert: Pre-training of deep bidirectional transformers for language understanding. Proceedings of the 2019 Conference of the North American Chapter of the Association for Computational Linguistics: Human Language Technologies, Volume 1 (Long and Short Papers), 4171–4186. 10.18653/v1/N19-1423 [DOI] [Google Scholar]
- Gillespie M, Jassal B, Stephan R, Milacic M, Rothfels K, Senff-Ribeiro A, Griss J, Sevilla C, Matthews L, Gong C, Deng C, Varusai T, Ragueneau E, Haider Y, May B, Shamovsky V, Weiser J, Brunson T, Sanati N, … D’Eustachio P (2022). The Reactome pathway knowledgebase 2022. Nucleic Acids Research, 50(D1), D687–D692. 10.1093/nar/gkab1028 [DOI] [PMC free article] [PubMed] [Google Scholar]
- GTEx Consortium. (2013). The Genotype-Tissue Expression (GTEx) project. Nat Genet, 45(6), 580–5. 10.1038/ng.2653 [DOI] [PMC free article] [PubMed] [Google Scholar]
- Kustatscher G, Collins T, Gingras A-C, Guo T, Hermjakob H, Ideker T, Lilley KS, Lundberg E, Marcotte EM, Ralser M, & Rappsilber J (2022). An open invitation to the understudied proteins initiative. Nature Biotechnology, 40(6), 815–817. 10.1038/s41587-022-01316-z [DOI] [PubMed] [Google Scholar]
- Le Novère N, Hucka M, Mi H, Moodie S, Schreiber F, Sorokin A, Demir E, Wegner K, Aladjem MI, Wimalaratne SM, Bergman FT, Gauges R, Ghazal P, Kawaji H, Li L, Matsuoka Y, Villéger A, Boyd SE, Calzone L, … Kitano H (2009). The systems biology graphical notation. Nature Biotechnology, 27(8), 735–741. 10.1038/nbt.1558 [DOI] [PubMed] [Google Scholar]
- Oprea TI, Bologa CG, Brunak S, Campbell A, Gan GN, Gaulton A, Gomez SM, Guha R, Hersey A, Holmes J, Jadhav A, Jensen LJ, Johnson GL, Karlson A, Leach AR, Ma’ayan A, Malovannaya A, Mani S, Mathias SL, … Zahoránszky-Köhalmi G (2018). Unexplored therapeutic opportunities in the human genome. Nature Reviews. Drug Discovery, 17(5), 317–332. 10.1038/nrd.2018.14 [DOI] [PMC free article] [PubMed] [Google Scholar]
- Sheils TK, Mathias SL, Kelleher KJ, Siramshetty VB, Nguyen D-T, Bologa CG, Jensen LJ, Vidović D, Koleti A, Schürer SC, Waller A, Yang JJ, Holmes J, Bocci G, Southall N, Dharkar P, Mathé E, Simeonov A, & Oprea TI (2021). TCRD and Pharos 2021: Mining the human proteome for disease biology. Nucleic Acids Research, 49(D1), D1334–D1346. 10.1093/nar/gkaa993 [DOI] [PMC free article] [PubMed] [Google Scholar]
- Sheils T, Mathias SL, Siramshetty VB, Bocci G, Bologa CG, Yang JJ, Waller A, Southall N, Nguyen D-T, & Oprea TI (2020). How to illuminate the druggable genome using pharos. Current Protocols in Bioinformatics, 69(1), e92. 10.1002/cpbi.92 [DOI] [PMC free article] [PubMed] [Google Scholar]
- Uhlén M, Fagerberg L, Hallström BM, Lindskog C, Oksvold P, Mardinoglu A, Sivertsson Å, Kampf C, Sjöstedt E, Asplund A, Olsson I, Edlund K, Lundberg E, Navani S, Szigyarto CA, Odeberg J, Djureinovic D, Takanen JO, Hober S, … Pontén F (2015). Proteomics. Tissue-based map of the human proteome. Science, 347(6220), 1260419. 10.1126/science.1260419 [DOI] [PubMed] [Google Scholar]
- Wu G, Dawson E, Duong A, Haw R, & Stein L (2014). ReactomeFIViz: A Cytoscape app for pathway and network-based data analysis. F1000Research, 3, 146. 10.12688/f1000research.4431.2 [DOI] [PMC free article] [PubMed] [Google Scholar]
- Wu G, Feng X, & Stein L (2010). A human functional protein interaction network and its application to cancer data analysis. Genome Biology, 11(5), R53. 10.1186/gb-2010-11-5-r53 [DOI] [PMC free article] [PubMed] [Google Scholar]
- Wu G, & Haw R (2017). Functional interaction network construction and analysis for disease discovery. Methods in Molecular Biology (Clifton, N.J.), 1558, 235–253. 10.1007/978-1-4939-6783-4_11 [DOI] [PubMed] [Google Scholar]
Associated Data
This section collects any data citations, data availability statements, or supplementary materials included in this article.
Data Availability Statement
The data that support the Reactome-IDG are available at the Download page: https://idg.reactome.org/documentation/downloads. These data were derived from the following resources available in the public domain:
GTEx portal: https://gtexportal.org/home/
TCGAportal: http://www.tcgaportal.org/
Harmonizome: https://maayanlab.cloud/Harmonizome/
StringDB: https://string-db.org/
BioGrid: https://thebiogrid.org/
BioPlex: https://bioplex.hms.harvard.edu/
TCRD: http://juniper.health.unm.edu/tcrd/
Gene ontology annotation: http://geneontology.org/
pFam: https://www.ebi.ac.uk/interpro/
ENSEMBL Compara: http://ensembl.org/info/genome/compara/index.html
Panther: http://www.pantherdb.org/
Reactome: https://reactome.org


