

Abstract
HTLV‐I‐associated myelopathy/tropical spastic paraparesis (HAM/TSP) is a chronic, progressive, neuroinflammatory demyelinating condition of the spinal cord. We have previously shown that aberrant expression and activity of immune checkpoint (ICP) molecules such as PD‐1 and PD‐L1/PD‐L2, negatively associates with the cytolytic potential of T cells in individuals with HAM/TSP. Interestingly, ICPs can exist in a soluble cell‐free form and can be carried on extracellular vesicles (EVs) and exosomes (small EVs, <300 nm) while maintaining their immunomodulatory activity. Therefore, we investigated the role of soluble and exosomal ICPs in HTLV‐1 associated neuroinflammation. For the very first time, we demonstrate a unique elevated presence of several stimulatory (CD27, CD28, 4‐1BB) and inhibitory (BTLA, CTLA‐4, LAG‐3, PD‐1, PD‐L2) ICP receptors in HAM/TSP sera, and in purified exosomes from a HAM/TSP‐derived HTLV‐1‐producing (OSP2) cells. These ICPs were found to be co‐localized with the endosomal sorting complex required for transport (ESCRT) pathway proteins and exhibited functional binding with their respective ligands. Viral proteins and cytokines (primarily IFNγ) were found to be present in purified exosomes. IFNγ exposure enhanced the release of ICP molecules while antiretroviral drugs (Azidothymidine and Lopinavir) significantly inhibited this process. HTLV‐1 b‐Zip protein (HBZ) has been linked to factors that enhance EV release and concurrent knockdown here led to the reduced expression of ESCRT associated genes (e.g., Hrs, Vsp4, Alix, Tsg101) as well as abrogated the release of ICP molecules, suggesting HBZ involvement in this process. Moreso, exosomes from OSP2 cells adversely affected CD8 T‐cell functions by diminishing levels of cytokines and cytotoxic factors. Collectively, these findings highlight exosome‐mediated immunomodulation of T‐cell functions with HBZ and ESCRT pathways as an underlying mechanism in the context of HTLV‐1‐induced neuroinflammation.
Keywords: BTLA, HTLV‐1, HAM/TSP, immune checkpoints, PD‐1, PD‐L1/2
1. INTRODUCTION
Estimates predict 15–20 million individuals globally are infected with human T‐cell leukaemia virus type 1 (HTLV‐1). While approximately 90% of infected individuals remain as asymptomatic carriers, devastating clinical manifestations amongst symptomatic populations can emerge, such as HTLV‐1‐associated myelopathy/tropic spastic paraparesis (HAM/TSP) and adult T‐cell leukaemia/lymphoma (ATLL) (Malpica et al., 2018). HAM/TSP is a chronic, progressive demyelinating neuroinflammatory condition of the spinal cord (Maloney et al., 1998; Tsutsumi et al., 2019) that leads to a significant loss in quality of life, often manifesting in individuals, predominantly females, of 40–50 years of age. Although symptomology mimics Multiple Sclerosis (MS), the immunopathology of HAM/TSP remains elusive. Previous studies have shown that a high proviral load, virus‐specific cytotoxic T cells (CTLs), and associated inflammatory responses play a pivotal role in disease development (Ahuja et al., 2006, 2007; Alefantis et al., 2007, 2005; Aliya et al., 2012; Boukli et al., 2012; Grant et al., 2006; Irish et al., 2009; Jain et al., 2007, 2009, 2015; Kampani et al., 2007; Lepoutre et al., 2009; Manuel et al., 2007, 2009, Manuel, Sehgal, Connolly et al., 2013; Mostoller et al., 2004; Pustylnikov et al., 2014; Rahman et al., 2010; Rahman, Khan, Wigdahl et al., 2011; Rahman, Connolly et al., 2011; Rahman, Khan, Jain et al., 2011; Rahman et al., 2012; Sagar et al., 2014; Sehgal et al., 2013, 2014; Shetty et al., 2011; Shirazi et al., 2013; Tran et al., 2011; Yao et al., 2006). It is also established that immune checkpoint (ICP) pathways play a major role in CTL dysfunctions seen in HAM/TSP patients (Tsutsumi et al., 2019; Tropical Spastic Paraparesis Information Page [Internet]. NIH, 2019), but the mechanism of this process remains to be fully understood.
HTLV‐1 pathogenesis is primarily mediated by two viral proteins, the trans activator Tax and HTLV b‐Zip factor (HBZ, reviewed in (Enose‐Akahata et al., 2017)). Tax can act as an immune modulator and is the primary antigen recognized by HTLV‐1 specific CTLs in HAM/TSP (Ross et al., 2000). However, little is known about the role of HBZ in the development of HAM/TSP. Studies have shown patients do exhibit a higher level of hbz mRNA expression in the nucleus that corelate with disease severity (Andrade et al., 2013; Saito et al., 2009). HBZ mRNA has been shown to promote T‐cell proliferation by activating anti‐apoptotic and IL‐2‐independent pathways (Satou et al., 2006). HBZ is known to modulate the expression of inhibitory ICP molecules such as programmed cell death protein 1 (PD‐1) and T Cell Immunoglobulin and ITIM Domain (TIGIT) (Yasuma et al., 2016) by interacting with SHP1/2 and Grb‐2, the downstream adaptor proteins for several inhibitory pathways (Kinosada et al., 2017). Additionally, HBZ was found to positively regulate the induction of interferons (IFN), which is elevated in sera and cerebrospinal fluid of HAM/TSP patients along with other cytokines and chemokines (Montanheiro et al., 2009; Mozhgani et al., 2016; Enose‐Akahata & Jacobson, 2019). The high frequency of IFNγ producing T cells correlate with disease severity in HAM/TSP (Chen et al., 2018), and IFNγ is also well known to enhance secretions of exosomes and soluble ICPs in a variety of cancers (Chen et al., 2018; Yang et al., 2020).
ICP mediators can be stimulatory or inhibitory, co‐regulating T‐cell activities in cancer, chronic viral infections, and neuroinflammation (Cai et al., 2020, Abusamra et al., 2005, Anel et al., 2019, Chiba et al., 2018, Essandoh et al., 2015, Gupta & Pulliam, 2014, Lundholm et al., 2014, Theodoraki et al., 2018, Zhuang et al., 2011, Narayanan et al., 2014, Liu et al., 2019, Otaguiri et al., 2018). With respect to HTLV‐1 infection, PD‐1/PD‐L1 (programmed cell death ligand 1), BTLA (B‐ and T‐lymphocyte attenuator)/HVEM ((herpesvirus entry mediator), TIGIT, and TIM‐3 (T cell immunoglobulin and mucin‐domain containing‐3) have been shown as contributing factors for HAM/TSP (Manuel, Sehgal, Connolly et al., 2013; Manuel, Sehgal, Khan et al., 2013; Kozako et al., 2011, Chibueze et al., 2013, Abdelbary et al., 2011, Ndhlovu et al., 2011). We previously reported the co‐expression pattern of several key inhibitory ICPs (i.e., PD‐1, TIGIT, TIM‐3) and their cognate ligands on HTLV‐1‐specific CD8+ T cells (Chibueze et al., 2013) and dendritic cells (Mostoller et al., 2004; Manuel et al., 2009) from HAM/TSP patients. Furthermore, co‐blockade of these pathways partially restored effector functions of antigen‐specific cytotoxic T cells (CTLs) (Clements et al., 2021). Collectively, these studies confirmed the importance of ICP signalling in HTLV‐1‐induced neuroinflammation.
ICP molecules can be released in the soluble cell‐free form and presented on the surface of extracellular vesicles (EVs), more so in the context of smaller vesicles (50–300 nm) called exosomes (reviewed in (Joseph et al., 2021)). Soluble ICP molecules are functional proteins released into the extracellular milieu and can mimic responses similar to their membrane bound isoforms (Joseph et al., 2021). Exosomes are membrane enveloped EVs ranging in size and distribution, which carry a heterogenous cargo of proteins, genetic material, and other metabolites that impact intercellular communication. The endosomal trafficking pathway plays pivotal roles in cellular communication with profound effects on signal transduction in several cellular pathways, and as such, is highly conserved amongst eukaryotes. The endosomal sorting complex required for transport (ESCRT) machinery and many of its associated proteins are involved in multivesicular body (MVB) formation and exosome biogenesis. The ESCRT machinery are primarily four complexes (ESCRT ‐0, ‐I, ‐II, ‐III) comprised of several proteins, each with individual functions in cargo retention and vesicle formation (as reviewed in (Horner et al., 2018)). Many viral infections are known to hijack and manipulate the endosomal pathway to propagate infection. APH‐2, the counterpart for HBZ in HTLV‐2 infection, has been shown to interact with the ESCRT‐0 complex (Martini et al., 2019). It was also shown that HTLV‐1 infected cell‐derived exosomes contain viral proteins and mRNAs, which could promote viral spread to uninfected cells (Pinto et al., 2021, 2019). Interestingly, HBZ has been seen to induce the expression of brain‐derived neurotrophic factor (BDNF) and stimulates BDNF/tyrosine kinase receptor B (TrkB)‐ a tyrosine receptor kinase associated with BDNF engagement, signalling to promote survival of infected T cells via an autocrine/paracrine signalling loop (Polakowski et al., 2014). BDNF binding to TrkB triggers intracellular signalling output via Rab5‐Rab11 GTPases, which regulate receptor trafficking along early‐recycling endosomes. A dysfunction in this process impairs BDNF signalling and has seen to contribute to several neurodegenerative diseases (Moya‐Alvarado et al., 2022). Furthermore, TrkB‐containing exosomes were seen to play a key role in controlling the progression and aggression of neuroblastomas and breast cancer, as well as suppressive effects against CAR‐T cell efficacy (Ali et al., 2020; Choy et al., 2017; Pinet et al., 2016). This process could also be involved in the unique activities of HBZ in relation to HAM/TSP pathogenesis.
Immune cell‐derived exosomes, including those derived from infected cells, and soluble factors participate in modulating innate and adaptive responses (Narayanan et al., 2014; Vatter et al., 2021). Exosomes have long‐established associations with ICPs, with functional implications on the cellular microenvironment and immune system. In metastatic melanoma, there is a high release of exosomes carrying PD‐L1 on their surface, resulting in increased tumour growth and the suppression of tumour‐specific CD8+ T cells (Araya et al., 2014; Yamano et al., 2009). In the nervous system, exosomes have the potential to participate in intercellular communication, maintain the myelin sheath, and eliminate waste. Exosomes have been shown to also play roles in diseases of the central nervous system (CNS) (reviewed in (Liu et al., 2019)), such as stroke, Alzheimer's disease, Parkinson's disease, prion disease, traumatic encephalopathy, systemic lupus erythematous, and MS, with both positive and negative effects (Chiu et al., 2016; Morganti‐Kossmann et al., 2001; Sharif et al., 2020; Yang et al., 2017). Accumulating evidence suggests that during neuroinflammation, inhibitory ICP molecules such as PD‐1/PD‐L1 (Prasad et al., 2017; Schachtele et al., 2014) are increasingly expressed in glial cells and astrocytes and limit immune mediated tissue damage in models of MS as well as acute viral encephalitis (Duncan & Miller, 2011; Prasad et al., 2017). However, the role of exosomal ICPs in influencing neuroinflammation, and in particular HAM/TSP, remains to be investigated. The study presented herein demonstrates extensive release of certain key ICP receptors and ligands in soluble and exosomal forms from HTLV‐1‐infected and HAM/TSP‐derived cells. Interestingly, knockout of HBZ significantly affected the release of several ICPs and the expression ESCRT associated genes. The specific role of HBZ protein in initiating transcriptional changes to the expression of ESCRT associated complexes remains to be elucidated; however, our studies thus far establish a key link between HBZ and exosomal ICPs. Collectively, this study contributes to understanding how HBZ may contribute to T‐cell dysfunctions with the help of the endocytic pathway and opens potential therapeutic avenues of investigation for HAM/TSP.
2. METHODS
2.1. Patient cohort and cell lines
A subset of participants from the University of California San Francisco (UCSF) HTLV Outcomes Study (HOST) cohort were utilized for the ex vivo analysis. HTLV‐1+ participants from the HOST cohort all had detectable HTLV‐1 infection at the time of blood donation. Details of HOST cohort enrolment have been previously published (Murphy et al., 1997). Included here were HTLV‐1 seronegative (n = 24), asymptomatic carriers of HTLV‐1 (AC, n = 22), or those with HTLV‐1 that progressed to HAM/TSP (n = 6). Cohort demographics of age, gender, and race are found in Figure S1. All study participants gave written informed consent to participate in UCSF‐HOST and approval was obtained from the University's human program studies to conduct analyses on banked specimens.
HTLV‐1 negative Jurkat cells, and HTLV‐1 transformed leukaemia like cells ATL‐ED (often referred as ED‐405(‐)) and MT‐4 cultures were maintained as described previously (Madugula et al., 2022). The OSP2 (HAM/TSP‐derived) cell cultures were acquired through the NIH AIDS Reagent Program (Cat. No. ARP‐1393). All cell lines were cultured in complete media consisting of RPMI (Gibco) with 10% heat inactivated FBS (Biotechne) for Jurkat, ATL‐ED, and MT‐4 cell lines and 15% FBS for OSP2 cells, supplemented with 1% Penicillin Streptomycin (Gibco), and 10mM HEPES (Gibco). OPS2 cells were additionally supplemented with IL‐2 (Sigma) at 10 Units/mL. All cultures were routinely tested for mycoplasma (Applied Biological Materials, BC, Canada).
2.2. EV isolation and fractionation, exosome purification
Cells were seeded at densities of 3–5 × 10⁵/mL in complete media with 10% exosome free‐FBS (Thermofisher) and supernatants were collected at day 5. Differential centrifugation at 400×g and 2000×g for 10 min each was done to remove cells and debris. The resulting supernatant was either directly centrifuged or first mixed with the Total Exosome Isolation reagent (Invitrogen) at a ratio of 1:2 overnight at 4°C and centrifuged at 3000 RPM for 5 h to collect all EVs. For exosomes, EV pellets were resuspended and washed in 2 mL DPBS and ultracentrifuged at 27,000 RPM (100,000×g) for 2.5–3 h at 4°C. Isolated exosomes were resuspended in DPBS at a desired volume and subjected to protein quantification by the BCA protein assay (Pierce).
For EV fractionation studies, pellets collected after centrifugation at 2000×g are denoted 2k, 1000×g denoted 10k, and 100,000×g denoted 100k. EV validation and characterization was performed by Western blotting, Nanoparticle Tracking Analysis (NTA), and by a newer technology known as ExoView/NanoView, further described below.
2.3. Western blotting
Whole cell lysates were extracted via RIPA lysis (ChemCruz) and quantified for the protein yield. A total of 10 μg of whole cell lysate or 15–25 μg of exosomal protein was loaded onto SDS‐PAGE gels (Bio‐Rad) and transferred onto methanol activated PVDF membranes, blocked in 5% non‐fat milk in Tris‐buffered saline (TBS), washed in 1% TBS‐Tween, and incubated with primary antibody overnight in 4°C. After incubation, membranes were washed and incubated with secondary antibody conjugated to HRP for 1 h. Membranes were developed with chemiluminescent substrate (West Pico PLUS, SuperSignal Pierce) and imaged by ImageQuant LAS400. Similar analysis was performed on purified EVs and exosomes utilizing antibodies targeting canonical exosome markers as listed in Table S1. Where applicable, nuclear and cytoplasmic cellular fractions were also isolated using NucBuster Protein Extraction Kit (Novagen) per manufacturer's instructions.
2.4. Flow cytometry analysis
For phenotyping, cells were collected, washed with PBS, and blocked for 20 min with Fc block (1:50, Biolegend), and then stained with Fluorochrome‐conjugated anti‐human antibodies for various surface markers. Subsequently, for intracellular staining, cells were washed, fixed and permeabilized (Invitrogen) for 20 min, and then incubated with fluorochrome conjugated antibodies (Table S2) to specific targets of interest in 1X permeabilization buffer. Cells were acquired on a Fortessa LSR (BD) or FACS Calibur (BD) and analysis performed using FlowJo software.
2.5. RT‐qPCR
Total RNA was isolated from cells using a RNAeasy kit (Qiagen), and reverse transcribed into complementary DNA (cDNA) with high‐capacity cDNA reverse transcription kit (Applied Biosystems). The samples were then analysed in an Applied Biosystems QuantStudio 3 Real‐Time PCR machine. Primers used for different types of genes are listed in Table S3.
2.6. Immunoassays
Stored plasma and cell culture supernatants, isolated EVs, and exosomes were tested for the following soluble co‐stimulatory and inhibitory proteins using the Immuno‐Oncology Checkpoint 14‐Plex Human ProcartaPlex Panel‐1 (Invitrogen): CD27 (cluster of differentiation 27), CD28, CD40, CD80 (B7‐1), GITR (glucocorticoid‐induced TNFR‐related protein), HVEM, BTLA, IDO (indoleamine 2,3‐dioxgenase), CTLA‐4 (cytotoxin T‐lymphocyte‐associated protein 4), LAG‐3, PD‐1, PD‐L1, PD‐L2, and TIM‐3. For plasma, data were acquired on a Luminex 200 analyser (Luminex) and analysed using MILLIPLEX® Analyst software (Millipore). For cell culture supernatants, isolated EVs, and exosomes, data were acquired using a FLEXMAP Luminex Instrument with Xponent 4.3 software and analysed with Bellysa. Samples were evaluated in duplicate, and protocol was performed per manufacturer's instructions.
To quantify extracellular proinflammatory cytokine levels of cell line supernatants and exosomes, enzyme‐linked immunosorbent assays (ELISAs) were performed in triplicate measuring levels of IL‐1α, IL‐1β, IL‐2, IL‐6, IL‐8, IL‐10, GMCSF, IFNγ, TNFα, and MCF using a multiplex semi‐quantitative proinflammatory array (Anogen, Mississauga, Canada), Cell line supernatants and exosomes were also evaluated by ELISA for the following: HTLV p19 Antigen (Zeptometrix); IFNγ (ELISA Max Deluxe Set, BioLegend); PD‐1, PD‐L2, and BTLA (Human ELISA kit, Invitrogen); LAG‐3 (Human LAG‐3 ELISA kit, RayBio); and IL‐13 (Human IL‐13 ELISA kit, Biogem). Absorbance measurements and standard curve extrapolation was conducted on Tecan's Megellan software (Switzerland).
2.7. Nanoparticle tracking analysis (NTA) and ExoView/NanoView technology
EVs particle size and counts were determined by the ZetaViewX20 by Particle Matrix. For each measurement, the instrument pre‐acquisition parameters were set to a temperature of 25°C, 488 nm laser wavelength, a sensitivity of 85, 30 frames per second, and a shutter speed of 70. For each measurement, 1 mL of the sample diluted (1:200) in deionized (DI) water was loaded into the cell, and the instrument measured each sample at 11 different positions throughout the cell, with three readings at each position and two distribution cycles. After automated analysis and removal of any outliers from the 11 positions was completed, the concentration, mean, median, and mode sizes of the samples were calculated using the ZetaView 8.04.02 software and analysed using the same software and Microsoft Excel. Additional NTA analysis was done with Nanosight NS300, measurement parameters were set to a temperature of 24.2°C with Blue 488 nm wave length and shutter speed 1232. One millilitre of samples was loaded at a 1:100 dilution and 249 frames were collected. Isolated exosomes were also sent to be analysed by the Unchained Labs using the ExoView R200 imaging platform as per manufacturer's instructions (Woburn, MA).
2.8. Immunofluorescent Imaging
Cells were permeabilized with 0.1% TritonX‐100 in TBS for 10 min at room temperatures (RT), washed with PBS‐0.1%Tween‐20 thrice, and blocked with 5% normal sera (BioLegend) for 30 min at RT. Antibodies for BTLA, PD‐1, and TSG101 (Table S2) were added and incubated for 1 h RT, washed once then incubated with DAPI (Cell Signalling Technologies, 1:10000) diluted in wash buffer. Cells were fixed with 2% PFA, resuspended in 50% w/v glycerine and mounted onto imaging slides.
2.9. Ligand binding assay to show functionality of exosomal ICPs
For the detection of BTLA on exosomes, isolated exosomes from cell culture supernatants were quantified by BCA (Pierce) and 0–20 ug from each cell line were incubated overnight in pre‐coated BTLA (96‐well) plates (Invitrogen). Wells were incubated with biotinylated HVEM (BPS‐Bioscience, Cat#71143) at RT for 2 h. A total of 100 uL per well of HRP‐conjugated streptavidin (Invitrogen) diluted in PBS containing 0.1% SBA was then added and incubated for 1 h. Plates were developed with TMB (Biolegend), stopped with Stop Solution, and read at 450 nm (Tecan).. Recombinant BTLA (BPS‐Bioscience, Cat#71141) was used as positive control. Wells washed with wash buffer (PBS + 0.5% Tween‐20) thrice between all steps.
2.10. Multiplex cytokine analysis
Quantitative analysis of cytokines was performed using a multiplex immunoassay platform of 10 different proinflammatory cytokines, such as interleukin (IL)‐1β, IL‐8, IL‐2, IL‐4, IL‐6, IL‐10, IL‐12p70, IL‐13, IFNγ, and tumour necrosis factor alpha (TNF‐α). Culture supernatants from each condition were obtained, as described above, and analysed straight from supernatants or separated into EVs and EV‐depleted supernatants. The MSD plates were prepared and washed as per the manufacturers protocol. The samples were diluted at a 1:5 ratio with Diluent 2 to a final volume of 100 μL and added to the MSD plate at 50 μL/well. The plates were sealed and incubated at room temperature (RT) for 1 h. The plates were then washed three times with 150 μL/well of MSD Wash Buffer prior to adding detection antibodies to each corresponding well at RT and incubated for 2 h. The plates were then washed with wash buffer (as described above) and read buffer was added to each well. Finally, the plate was read using a QuickPlex SQ120 reader (MSD, Gaithersburg, MD, as previously described (Boelig et al., 2022).
2.11. Antiretroviral and IFNγ treatment
Cells seeded in 12 well plates at a density of 1 × 10⁶/mL and incubated with DMSO control, Lopinavir (LPN, NIH AIDS Reagent Program) at 11 nM working concentrations, or Azidothymidine (AZT, NIH AIDS Reagent Program) at 5 uM working concentration, for 36 h at 37°C.) Cells seeded 1 × 10⁶/mL were treated with 100 U/mL of IFNγ (Sigma) or untreated control and stimulated for 48 h at 37°C. Culture supernatant was collected and ProcartaPlex immuno‐oncology Luminex assay was used to quantify analyte presence.
2.12. Lentivirus‐based transfection
HBZ lentiviral vectors were gifted by Dr. Panfil and generated as described previously (Arnold et al., 2008; Panfil et al., 2016). The vector control with no insert was designated V1 (denoted as empty in figure). Vectors expressing Hbz transcript target sequences were: V2: 5′7176AGGACAAGGAGGAGGAGG71593′; and V4: 5′8674CGGCCTCAG8666^7265GGCTGTTT CG72573′. Sequence and numbering are based on the positive sense nucleotide sequence of the ACH proviral clone (Kimata et al., 1994). V5 (denoted as scramble in figure) contains a scrambled nucleotide sequence designed to form a nonspecific hairpin shRNA and not target Hbz, other HTLV‐1 genes, or cellular genes (Arnold et al., 2008). The overexpression vector (denoted O/E in figures) had FLAG‐tagged HBZ cDNA inserted downstream of the cytomegalovirus (CMV) promoter and the FLAG‐6×His epitope tag for mammalian cell expression of FLAG‐tagged HBZ. Lipofectamine LTX reagent (Invitrogen) was used per manufacturer's protocol. Briefly, 2 × 10⁶ cells were plated 24 h prior to transfection. Equal volume of PLUS reagent was added per microgram of lentiviral vector (3 μg/2 × 106 cells), generated previously (Arnold et al., 2008). Mixture of PLUS reagent with vector plasmids were combined 1:1 with Lipofectamine reagent diluted in OptiMEM (Invitrogen) media and added to pre‐plated cells. After 4 h, complete media (RPMI with 15% FBS) was added to the plate and incubated for 72 h. At the 24 h mark, a portion of cells were collected to verify knockdown of HBZ via RT‐qPCR and was also used to check the expression of ESCRT associated genes (alix, tsg101, hrs, vsp4, rab27b), and of BDNF and TrkB. In addition, ELISAs were performed on collected supernatant to quantify changes in secreted BTLA, LAG‐3, PD‐1, PD‐L2, and IFNy.
2.13. Cytotoxicity assays
MTT assay (Abcam, Cat.ab211091) was performed per manufacturers instructions. Briefly, 36 h post transfection in a 96 well plate, cells were spun down and supernatant was discarded. Equal volume of serum‐free media and MTT solution was added and incubated for 3 h at 37°C followed by MTT solvent. Plate was incubated for 15 min in an orbital shaker and absorbance was read at 590 nm. LDH assay (Promega, Cat.PR‐G1780) was performed per manufacturers instructions based on cell mediated cytotoxicity protocol. Briefly, after 24 h of ART treatment or 36 h post transfection, supernatant was collected, mixed with 1X lysis solution and incubated for 1 h at RT. Reconstituted substrate mix was then added and samples were incubated for another 30 min, followed by the addition of Stop solution. Samples were read at 490 nm and cytotoxicity was calculated against positive control provided by kit.
2.14. T‐cell function studies upon exposure to OSP2 cells‐derived exosomes
Purified exosomes from OSP2 cells (without or with inhibitor treatment, Manumycin A (BioViotica, 250 nM in DMSO) were mixed (1:1 (∼20 ug)) with positively selected (StemCell) CD3+ T cells activated with PMA/Ionomycin activation cocktail (1x, BioLegend) from healthy donors (HumanCellsBio) for 24 h. Where indicated, exosomes were pre‐incubated with ICP blockade at 1:100 dilution (BTLA (Cat. 7473, ProSci); PD‐L2 (Cat. 4063, ProSci); LAG‐3 (Cat. 13485, Raybiotech). Exosomes from Jurkat cells were also tested as a control. Thereafter, cells were stained with a T‐cell functional marker cocktail (Table S2) and underwent multi‐colour flow cytometric analyses, as previously published (Manuel, Sehgal, Connolly et al., 2013; Manuel, Sehgal, Khan et al., 2013). Data were analysed by the FlowJo as described above.
2.15. Chromatin immunoprecipitation (ChIP) and Co‐IP assays
ChIP assays were performed using Pierce Magnetic ChIP Kit (Thermo Scientific) per manufacturer's instructions with modifications for non‐adherent cells. Crosslinking and cell pellet isolation were performed using approximately 5 × 10⁶ cells overexpressing HBZ per ChIP. Steps for Lysis and MNase digestion, IP elution, and DNA recovery was performed per manufacturer's protocol. Immunoprecipitation was adjusted and combined such that magnetic beads, target antibodies and chromatin samples were incubated overnight at 4°C. Eluted DNA was then subjected to RT‐PCR using primers listed in Supplemental Table S3. Samples were adjusted based on 10% input and normalized to IgG for fold enrichment analysis.
For Co‐IP, cells were lysed by sonication and cells lysates were pre‐cleared with protein L/G magnetic beads. Samples were incubated overnight with 2 ug of indicated antibodies and were washed to remove beads. Immunoprecipitated samples were resolved by SDS‐PAGE and immunoblotted for either HBZ antibody or TrkB and probed for the indicated markers.
2.16. Statistical analysis
Demographic and clinical characteristics for human samples are presented using median (IQR) for continuous variables and frequency for categorical variables. Differences among HTLV‐1 status and HAM status groups were determined by Kruskal–Wallis test and Dunn's test for multiple comparisons. Rout analysis was used to identify outliers at a per analyte and per group basis with a stringent cut‐off of Q = 0.1%. All analyses were performed in Prism v9.4 (GraphPad Software, LLC). For other in vitro studies, statistical analyses (paired/unpaired T tests) were conducted with Microsoft excel and plotted with GraphPad Prism Version 8.0.1 (GraphPad Software), using p < 0.05*, p < 0.005**, and p < 0.001 as the threshold for statistical significance.
3. RESULTS
3.1. Elevated levels of soluble inhibitory ICPs in HTLV‐1 infected patients and cell lines
Ex vivo comparative analysis of clinical sera samples provided a differential profile for soluble ICPs as significant changes were observed in the level of several stimulatory and inhibitory ICPs (Figure 1a). In comparison to seronegative control (SC) and asymptomatic carrier (AC) groups, HAM/TSP patients sera showed elevated levels of various T‐cell activators such as CD27, CD28, and 4‐1BB, respectively, by 4‐, 10‐, and 13‐fold. Several inhibitory ICPs such as BTLA, LAG‐3, and PD‐L2 were also elevated, respectively, by 30‐fold, 8‐ and 3‐fold. A slight upregulation (2‐fold) in CTLA‐4 levels was also observed in HAM/TSP patients compared SC. This data were in line with previous studies reporting high frequency of T‐cell expressing 4‐1BB and PDL‐2 in HAM/TSP patients (Clements et al., 2021; Kim et al., 2019; Ndhlovu et al., 2011) in correlation with hyperactive Th1‐like response that leads to chronic inflammation (Yamano & Coler‐Reilly, 2017).
FIGURE 1.
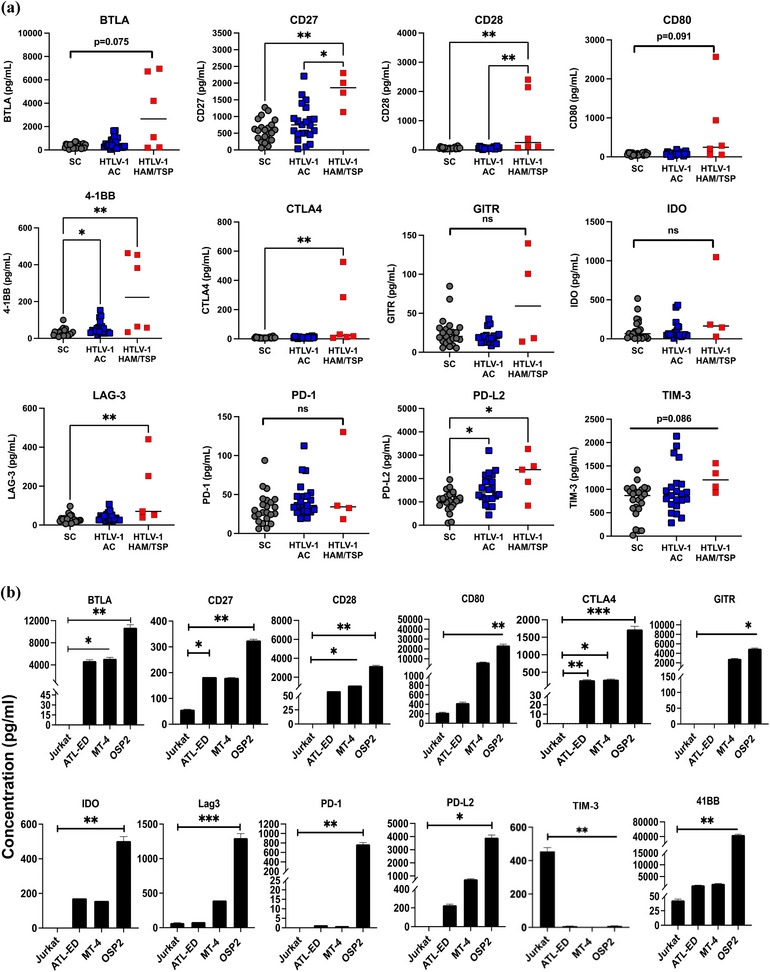
Immune checkpoint profile in HTLV‐1 infected and HAM/TSP patient sera. (a) Soluble immune checkpoint levels were measured in the plasma of HTLV‐1‐infected asymptomatic carriers (AC), HTLV‐1‐infected individuals diagnosed with HTLV‐1 associated myelopathy/tropical spastic paraparesis (HAM/TSP) and seronegative controls (SC). Statistical differences were determined by Kruskal–Wallis test and Dunn's test for multiple comparisons. (b) Soluble ICP levels were measured in supernatant of HTLV‐1 associated cells lines Jurkat, ATL‐ED, MT‐4, and OSP2. Concentrations was determined by two independent experiments run in duplicate and error bars represent standard deviation between experiments. Statistical differences were determined by heteroscedastic t‐tests for multiple comparisons, *p < 0.05, **p < 0.005, ***p < 0.001.
To follow up observations from the sera samples at the level of EVs and exosomes, we resorted to cell lines representing normal T cells (Jurkat), ATLL cancer like cells (ATL‐ED), leukemic high virus producing cells (MT‐4), and HAM/TSP‐like cells (OSP2). Complete characterization of these cell lines is given in Figure S2. In addition, cell surface expression of ICPs of these cell systems analysed by flowcytometry showed high expression of several inhibitory ICPs (BTLA, HVEM, PD‐1, PD‐L1/2, and LAG‐3) on OSP2 and MT‐4 cells but not Jurkat cells (Figure S3). Interestingly, many of these ICPs were also highly expressed on ATL‐ED cells that do not express Tax but do expresses high levels of HBZ suggesting surface ICP expression may not rely on Tax expression and may have association with HBZ.
Supernatants of all four cell lines were profiled for assessing the secretion of immune checkpoints (Figure 1b). As expected, OSP2 cells released significantly high levels of several stimulatory and inhibitory analytes compared to uninfected Jurkat cells. Notably, BTLA had the highest differential levels with 10,000‐fold change (p = 0.003) relative to Jurkat followed by CTLA‐4 (1700‐fold change) and LAG‐3 (19‐fold change) (p = <0.001). Similarly, CD27, CD28, CD80, GITR, IDO, PD‐1, PD‐L2, and 4‐1BB were also upregulated compared to Jurkat while TIM‐3 was significantly downregulated (p = <0.005). Although not as high as OSP2, MT‐4 cells exhibited significant levels of soluble CD28, CD80, CTLA4, and GITR with 30–300 fold‐change and ATL‐ED cells had significant levels of CD27 (2‐fold) and CTLA4 (200‐fold) compared to Jurkat. Interestingly, both MT‐4 and ATL‐ED also showed significant levels of BTLA with 30–45‐fold increased expression. Therefore, for subsequent studies, we focused on BTLA and a few other analytes that corresponded with significance in patients. This data also validates the use of OSP2 as a HAM/TSP‐derived system since it represents a similar hyper activated profile of T cells as seen in patients.
3.2. Infected cell‐derived exosomes carry functional ICP molecules with potential to diminish functions of CD8 T cells
Given EVs play important roles in cell signalling and HTLV‐1 spread, we isolated EVs from HTLV‐1 cell lines to evaluate their ICP expression and functionality. Exosomes isolated were verified for purity by the presence of EV‐associated proteins (ALIX CD63, CD9) and lack of the ER protein calnexin (Figure 2a) and ranged in concentration from 50 to 100 μg (Figure 2b). NTA verified the overall concentration and size of isolated EVs, and as expected highest peak of particles range within 30–200 nm (the expected size morphology for exosomes) (Figure 2b). Interestingly, exosomes isolated from Jurkat cells had heterogenous populations of smaller EV while exosomes from HTLV‐1 associated cells fell within a distinct range. The HTLV‐1 matrix protein (p19) often associated with virus production, was not detected in EV isolations, confirming virus was not being concentrated in the process (data not shown). Using the novel Exoview platform, we visualized and quantified our exosomes using capture probes for tetraspanins (CD63) and exosomal PD‐L1 (PD‐L1D), in representative cell lines of Jurkat and OSP2 (Figure 2c).
FIGURE 2.
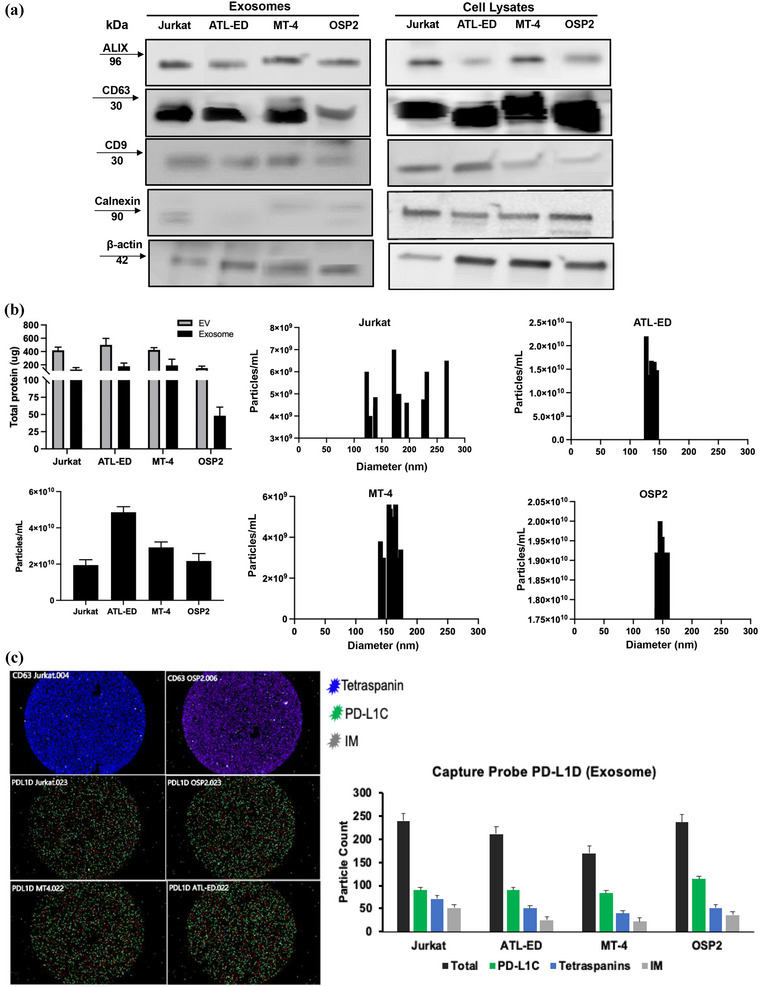
Exosome characterization. (a) Western blot from ultracentrifuged and precipitated exosomes and whole cell lysates (RIPA lysis ChemCruz) probing for exosomal markers ALIX, CD63, CD9, and ER marker Calnexin, and b‐actin control. (b) Top left, total protein yield of isolated EVs by precipitation (Invitrogen) and exosomes by ultracentrifugation were determined by BCA analysis (Pierce, Thermofisher) and averages (n = 13) plotted. Bottom left, concentration of exosomes in individual cell lines per isolation. Right, histogram of size and particle distribution determined by NTA (ZetaView) for four in vitro cell systems. (c) Left, Exoview chip image of capture probes (CD63 and PD‐L1D) with coloured pixels corresponding to detection antibodies for a pool of tetraspanins (blue), exo‐PD‐L1 (green), and Ig control (gray). Right, quantification of particles based on detection probe readouts on the PD‐L1D capture probe chip. All Exo‐view samples were run in duplicate.
We next examined cell‐line derived exosomes for ICP expression and found significant differential levels of BTLA (2‐fold), CD80 (61‐fold), IDO (5‐fold), LAG‐3 (30‐fold), PD‐L2 (4‐fold), 4‐1BB (3200‐fold), and TIM‐3 (16‐fold downregulated) in OSP2 exosomes compared to that of Jurkat (Figure 3a). Interestingly, PD‐L2, the higher affinity ligand for PD‐1, was significantly elevated in ATL‐ED (2‐fold) and MT‐4 (5‐fold), noting its presence associated with HTLV‐1 infection. Collectively, based upon the patient ICP and exosome profile, we decided to focus follow up studies on four inhibitory ICPs: BTLA, LAG‐3, PD‐L2, and PD‐1.
FIGURE 3.
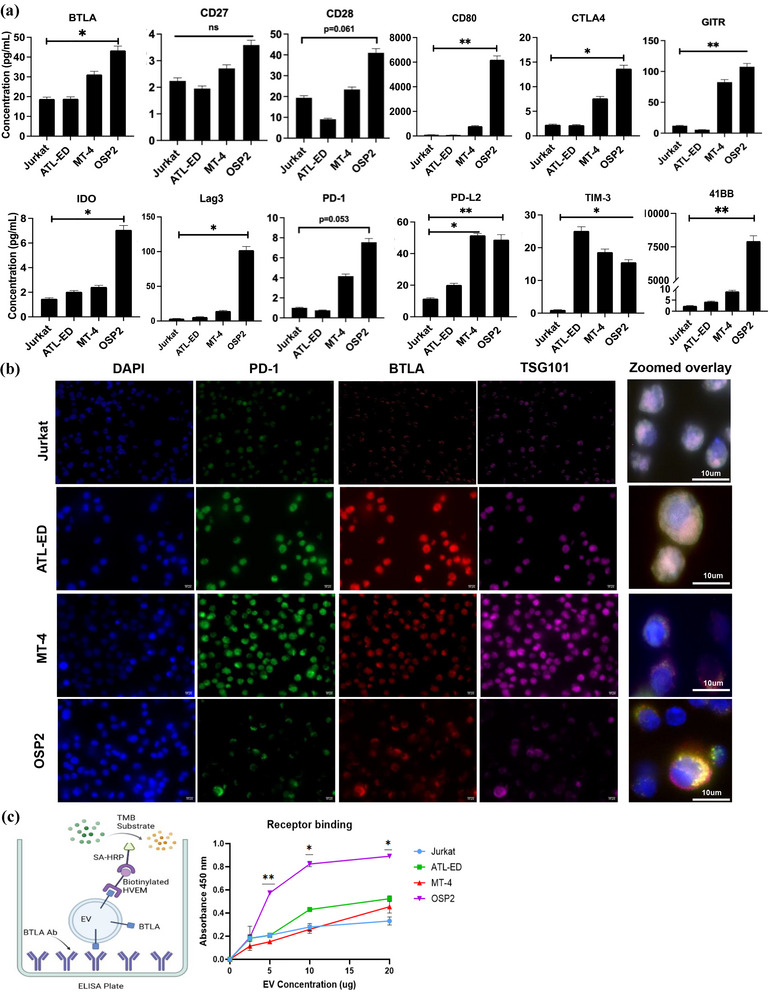
Immune checkpoint profile of HTLV‐1 associated cell derived exosomes. (a) Isolated exosomes derived from four cell lines were used to quantify presence of immune checkpoint analytes. Concentrations was determined by two independent experiments run in duplicate and error bars represent standard deviation between experiments. Statistical differences were determined by heteroscedastic t‐test for multiple comparisons, *p < 0.05, **p < 0.005, ***p < 0.001. (b) Immunofluorescent staining was done to determine colocalization of ICPs (BTLA‐PE Dazzle, red, and PD‐1‐FTIC, green) with exosome associated protein TSG101 (Dy680, purple) and visualized at 40X magnification. Merged image represents 63X magnification. Images representative of three independent experiments with five fields of view each. (c) Left, model of a modified ELISA technique; Right, ability of exosomal BTLA to bind to its biotinylated receptor HVEM and plotted binding based on wavelength absorbance. Absorbance values of two independent experiments run in duplicate and error bars represent standard deviation between experiments.
Viral infections are known to often hijack the endocytic pathway. Thus, we checked to see if selected ICPs co‐localized with the endocytic pathway proteins within infected cells in comparison to non‐infected cells. Immunofluorescent staining of markers PD‐1 and BTLA, with TSG101 (a protein within the ESCRT‐I complex associated with exosomes, (Willms et al., 2016)), we observed colocalization in ATL‐ED, MT‐4, and OSP2 but not in Jurkat cells (Figure 3b). Although ATL‐ED and MT‐4 cells did emit strong fluorescence for individual stains, we observed highest co‐localization pattern in OSP2 and ATL‐ED cells, confirming HTLV‐1‐driven association of ICPs with ESCRT pathway. This pattern also coincides with our surface expression data (Figure S3).
To verify the functionality of these exosome derived ICPs and their ability to bind to its cognate ligand, we adapted a receptor binding assay (Chen et al., 2018) using exosomal BTLA as a representative ICP, as this ICP had the highest presence in our cell systems (Figure 3c). We observed exosomes derived from OSP2 cells increasingly bound to HVEM in a concentration dependent manner, demonstrating exosomal ICPs binding capacity to their cognate ligands.
3.3. OSP2 cells exhibit proinflammatory cytokine profile and release exosomes with IFNγ
We next screened the cytokine profile of cell lines by a multiplex cytokine array. Unsurprisingly we observed OSP2 cells exhibited an increased proinflammatory profile compared to the other cell lines (Figure 4a). We then utilized the multiplex immunoassay platform MesoSacle Discovery (MSD) to quantify cytokine levels in total culture supernatants, free soluble cytokines in supernatants depleted from exosomes (exosome depleted), and in EVs (EV‐Associated Cytokines) (Figure 4b). The cytokine levels of IL‐6, IL‐8, GMCSF, IFNγ, MCAF, and TNFα were elevated in the culture supernatants of OSP2 cells compared to the other cell lines, quantified values listed in table (Figure 4b). We also observed comparatively lower levels of TNF‐α, IL‐8, and IL‐13 in MT‐4 cells, while IFNγ and IL‐13 were detected at further lower quantities in ATL‐ED cell supernatants. Similar results were observed in isolates of free‐soluble cytokines. However, a distinct but low level (15 pg/mL) presence of IL‐13 was seen in the exosome associated fraction of OSP2 cells. IL‐13 has been shown to be involved in positive feedback cycles initiated by Tax leading to activation of the NFAT and NFκB pathways (Silbermann et al., 2008). Of note, IFNγ was highly elevated in all three fractions of the OSP2 cells, and intracellular IFNγ was elevated in CD4+ OSP2 cells by flow cytometry (data not shown). IFNs are known to influence expression of inhibitory ICP molecules in chronic infections (Kouwaki et al., 2016) and are associated with increased HBZ expression (Mozhgani et al., 2018). Thus, we evaluated the effects of IFNγ on regulation of ICP molecules in vitro. Stimulation by IFNγ increased CD80 levels in all cell lines, CD27 was increased in Jurkat, ATL‐ED, and OSP2 cell lines, and LAG‐3, PD‐L1, PD‐L2, and GITR were all upregulated exclusively in OSP2 (Figure 4c). This data suggests that IFNγ can be a potential driver of ICP‐release in exosomes.
FIGURE 4.
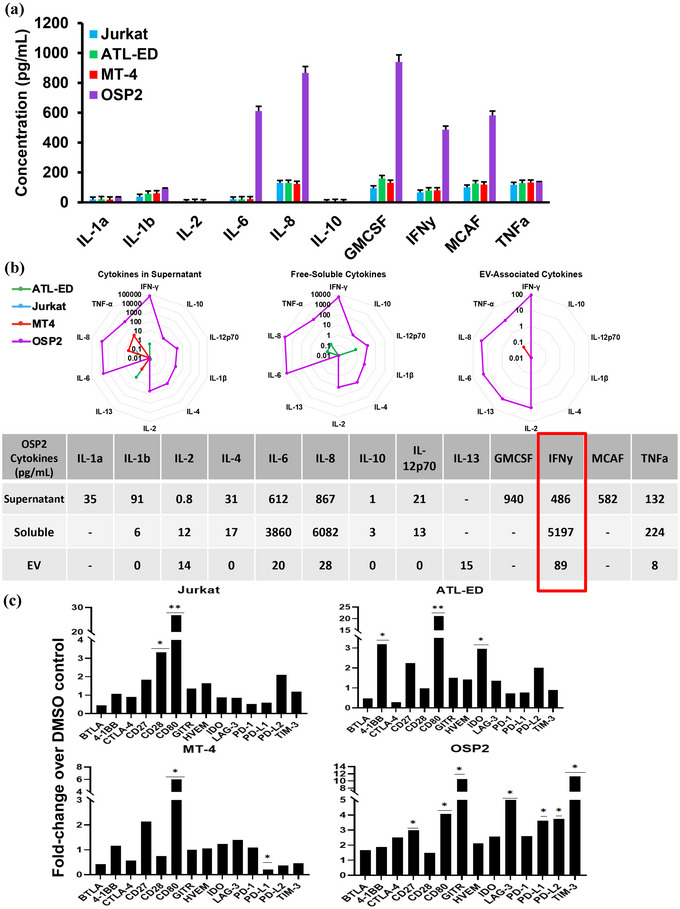
HAM/TSP‐derived HTLV‐1 infected cells exhibit a proinflammatory profile. (a) Cytokines IL‐1a, IL‐1b, IL‐2, IL‐6, IL‐8, IL‐10, GMSCF, IFNγ, MCAF, and TNFα were measured in HTLV‐1 associated cells. Data represents values for an experiment run in duplicate and error bar represents standard deviation. (b) Top, MSD based ELISA was used to determine the levels of cytokines present in Supernatant, Free soluble (EV depleted) and exosomes derived from our cell systems. Bottom, table quantifies concentrations (pg/mL) of detected cytokines. (c) supernatant of cells seeded at 1 × 10⁶/mL were stimulated with 100 U/mL of IFNγ (Sigma) or DMSO for 48 h at 37°C and ICP profile was quantified by Luminex. Concentration was determined by independent experiments run in duplicate and error bars represent standard deviation of duplicate samples. Statistical differences were determined by homoscedastic t‐tests for multiple comparisons, *p < 0.05, **p < 0.005, ***p < 0.001.
3.4. ICP molecules are predominately present on exosomal fractions
Previous HTLV‐1 studies demonstrate that larger EVs carry viral proteins that enhance cell to cell adhesion and impact viral spread (Pinto et al., 2019). Consequently, we determined whether ICPs are also present exclusively to an EV fraction. We differentiated EVs based on the isolation speed into three fractions, 2, 10, and 100k and validated their size differences by NTA (Figure S4). Herein, 2 and 10k fractions represent larger EVs while the 100k fraction represents exosomes. Immunoblotting these fractions revealed that BTLA and PD‐L2 was unique to the 100k fraction, which can be considered exosomes. Additionally, probes associated with larger EV (LC3IIB) and exosomes (TSG101, ALIX) were done to verify the purity of isolations (Figure 5a). We also quantified the presence of ICPs in different EV fraction via ELISA (Figure 5b). The 100K exosomal fraction carried the highest amounts of analytes for PD‐L2, BTLA, LAG‐3, and PD‐1. We also found that IFNγ was present in all EV fractions, but at higher levels in larger vesicle fractions (Figure 5c). Among viral proteins, Tax was present in all three fractions for MT‐4 and OSP2 cells, but HBZ was only present in 100k fractions (Figure 5d).
FIGURE 5.
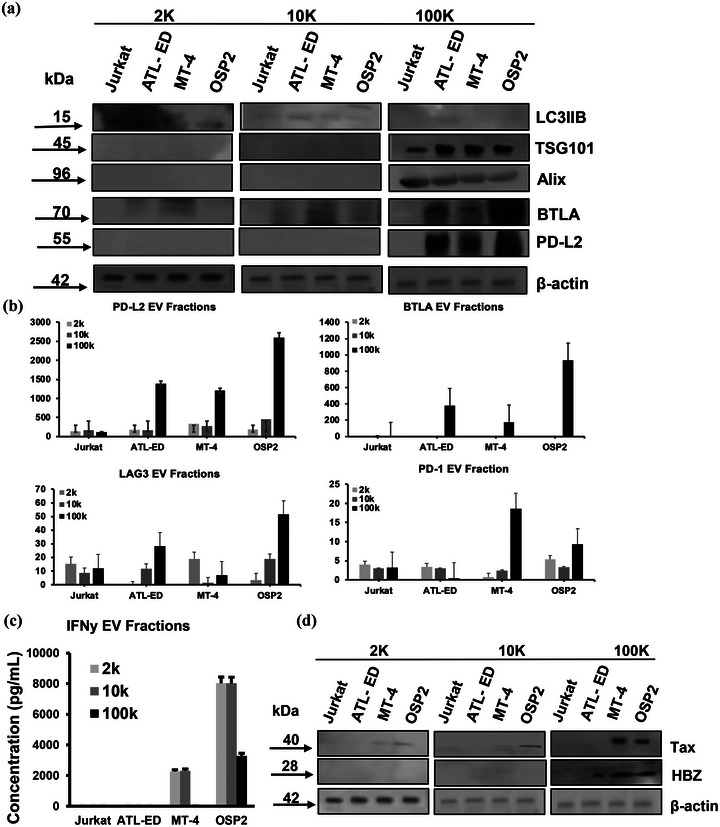
Different fractions of EVs carry different cargo. (a) Western blot of EV fractions 2, 10, and 100k, probing for makers LC3IIB‐ associated with larger vesicles, TSG101 and ALIX‐associated with exosomes, BTLA, PD‐L2, and beta actin control. (b) Levels of immune checkpoints, PD‐L2, BTLA, LAG‐3, and PD‐1 quantified by ELISA on different EV fractions. Concentration was determined by two independent experiments run in duplicate and error bars represent standard deviation between experiments. (c) Levels of IFNy associated with EV fractions measured by ELISA. Concentrations determined by two independent experiments run in duplicate and error bars represent standard deviation between experiments. (d) Western blot of viral proteins Tax and HBZ associated with EV fractions.
3.5. Loss of HBZ upon antiretroviral therapy corresponds to loss of inhibitory ICPs
To verify if elevated ICPs are attributed to HTLV‐1 infection, cells were treated with anti‐retroviral (ART) drugs Lopinavir or Azidothyomide, targeting the viral protease or reverse transcriptase, respectively. Both ARVs significantly reduced BTLA in both ATL‐ED and MT‐4 cells; however, several inhibitory ICPs, including BTLA, CTLA4, LAG‐3, HVEM, and PD‐L2, were significantly reduced in OSP2 cells (Figure 6a). Furthermore, HBZ expression was significantly reduced in all three cell lines with treatment (Figure 6b). To note, ART treatments did not affect IFNγ production, data not shown, and cellular viability (Figure S4C).
FIGURE 6.
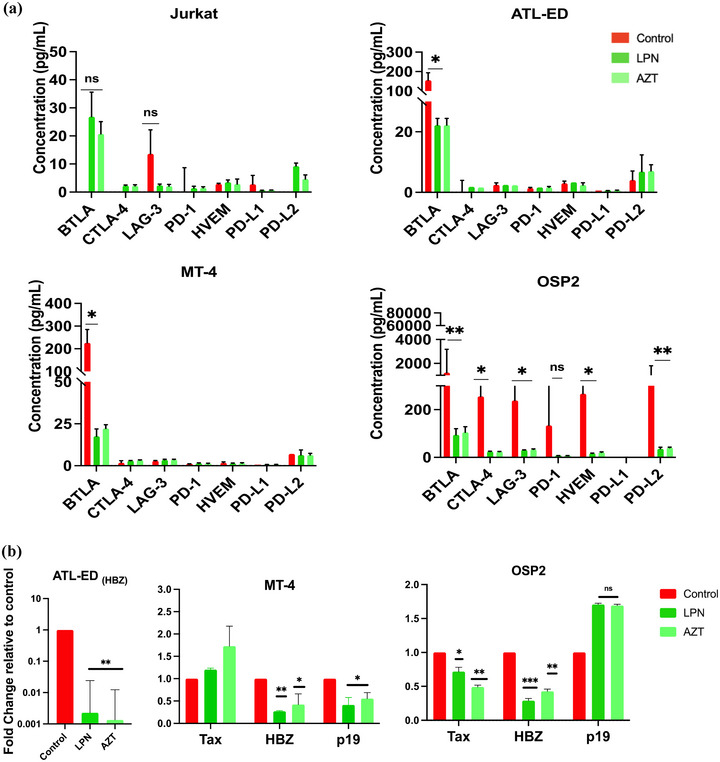
Antiretroviral drugs reduce immune checkpoint secretion. (a) Supernatant of cell treated with Lopinavir (LPN, 11 nM working concentrations), Azidothymidine (AZT, 5 uM working concentration), or DMSO control for 36 h at 37°C was collected and ICPs were assessed using Luminex xMAP technology. Concentrations determined by independent experiments run in duplicate and error bars represent standard deviation of duplicate samples. (b) RT‐qPCR was performed on cells treated with ART inhibitors and normalized to beta‐actin and control to evaluate expression changed of viral proteins Tax, HBZ, and p19. Fold‐change determined by two independent experiments run in duplicate and error bars represent standard deviation of between experiments. Homoscedastic paired t‐tests were performed, *p < 0.05, **p < 0.005, ***p < 0.001.
3.6. HBZ knockdown resulted in reduced expression of ICPs and modulates the expression of ESCRT complex associated proteins
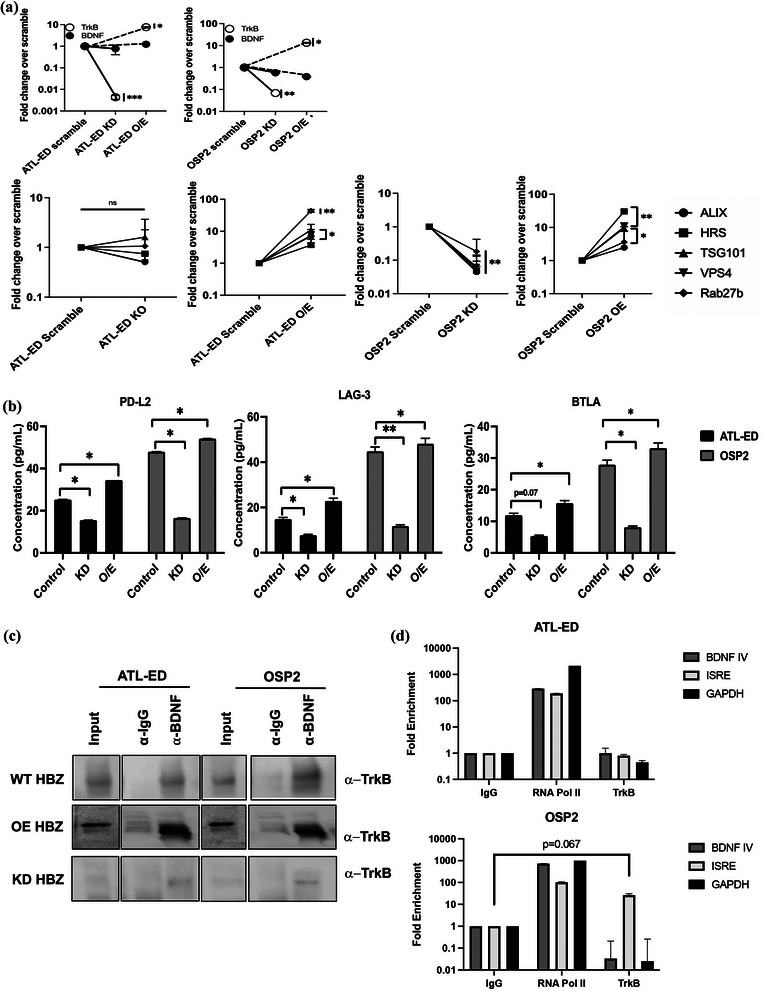
As our data alluded to the potential involvement of HBZ, we evaluated whether HBZ influences the production of soluble ICPs. We knocked down HBZ using established lipofectin‐transfected lentiviral plasmids targeting the b‐ZIP regions of the HBZ transcript (Arnold et al., 2008). Looking at transfection viability, we saw no significant cell death verifying our observed effects are due to reduced HBZ expression (Figure S5A–C). We know HTLV proteins hijack the ESCRT pathway to facilitate viral release (Votteler, 2013). APH‐2, the anti‐sense viral protein in HTLV‐2 infection, has been seen to interact with ESCRT‐0 protein HRS or HGS and suppress viral replication, perhaps as a strategy to limit virus produce to evade immune surveillance and promote persistence (Martini et al., 2019). Interesting HBZ is known to stimulate both BDNF and TrkB to promote survival in HTLV‐1 infected T cells (Polakowski et al., 2014). Compared to our uninfected Jurkat cells, we also see significant increases of expression in ATL‐ED and OSP2 of TrkB, BDNF, and several ESCRT associated genes (Figure S5D). Furthermore, in accordance to this, we observed significant reduction in the expression of trkb upon HBZ knockdown in ATL‐ED and OSP2 cells (Figure 7a). Several ESCRT associated genes (alix, tsg101, hrs, vsp4, rab27b), were also significantly down regulated in OSP2 cells with ESCRT‐0 component HRS and ESCRT‐1 components ALIX/TSG101 showing >1000‐fold reduction (Figure 7a). We, however, did not see significant changes in ATL‐ED with loss or overexpression of HBZ, perhaps suggesting this phenomenon is unique to HAM/TSP‐like cells, OSP2, and may have Tax involvement. Isolated exosomes from HBZ knockdown and overexpression cells were quantified for select ICPs (PD‐L2, BTLA, LAG‐3) and demonstrated significant reductions in PD‐L2, BTLA and LAG‐3 in OSP2 and selectively in ATL‐ED (Figure 7b). In teasing out a potential mechanism that may contribute to our observations, we focused on the role TrkB may have in modulating the expression of these exosomal ICPs. Previous studies have shown that BDNF/TrkB signalling activates an autocrine/paracrine signalling loop that enhances the survival of HTLV‐1 infected cells and impacts therapeutic resistance (Polakowski et al., 2014). Herein, we see heightened expression and precipitation of TrkB with BDNF in cells overexpressing HBZ in both ATL‐ED and OSP2 compared to baseline expression and further reduced in HBZ KD cells (Figure 7c). Uniquely in OSP2 cells, there was noticeable enrichment of TrkB at the ISRE (interferon stimulated response element) promotor (Figure 7d). ISRE activity is the hallmark of all type I and type III IFN‐response genes and the down‐stream effectors of ISRE activity include the regulation of ICPs through several overlapping pathways like JAK/STAT and NF‐kB activation (Platanitis & Decker, 2018).
FIGURE 7.
HBZ knockdown leads to loss of ICPs and downregulates ESCRT associated proteins in OSP2 cells. (a) Comparative expression of BDNF/TrkB and ESCRT associated mRNA in HBZ knockdown and overexpression cells relative to scramble control after 36 h. (b) Supernatant of untreated or lipofected cells were measured for the presence of ICPs, PD‐L2, BTLA, LAG‐3, and PD‐1by ELISA. Concentrations determined by two independent experiments run in duplicate and error bars represent standard deviation between experiments. (c) Co‐immunoprecipitation of BDNF and TrkB in cells that overexpress HBZ compared to baseline expression in cells, and HBZ knocked‐down cells. (d) Chromatin immunoprecipitation of TrkB enrichment at ISRE and BDNF IV promotor regions. (e) Model illustrating potential interaction mechanism of HBZ with ESCRT and immune activation associated transcription; graphic generated using BioRender software. Statistical differences were determined by Homoscedastic paired t‐tests, *p < 0.05, **p < 0.005, ***p < 0.001.
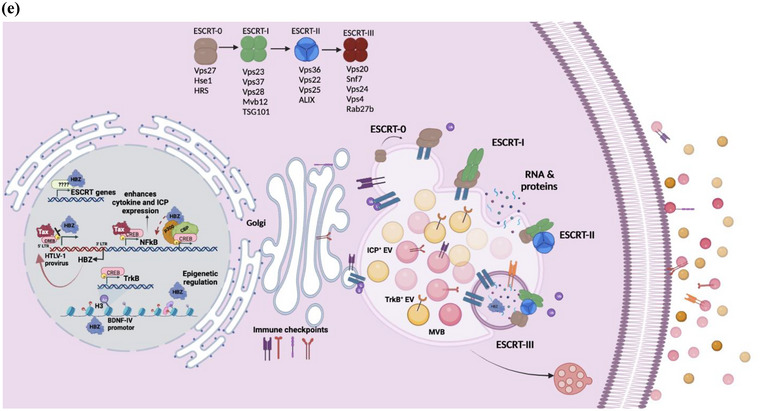
A recent study showed differences in the cytoplasmic presence of HBZ protein in infected T cells from asymptomatic (AC) and HAM/TSP patients contrary to what's known for ATLL cells, where it is retained primarily in the nucleus (Yasuma et al., 2016). Interestingly, HBZ was found to be accumulated in the nucleus of OSP2 cells while also maintaining its presence in the cytoplasm as opposed to exclusive nuclear localization in ATL‐ED (supplemental Fig 6A). We did not observe a direct interaction between HBZ and BDNF or TrkB (supplemental Fig 6B) implicating regulation at the transcriptional level. The cellular localization of HBZ in these two cell systems may be impacting the different observations we see between ATL‐like and HAM/TSP‐like systems. Furthermore, we cannot disregard the part Tax may be playing in OPS2 cells, given it is role modulating IFN and NFkB responses (Hajj & Bazarbachi, 2022). We postulate a model describing the activities of HBZ that could enlighten the mechanism of observed HBZ‐mediated effects (Figure 7e). Briefly, HBZ has been known to interact with many promotor elements (Polakowski et al., 2014), transcription complexes like CREB (also known to regulate BDNF expression), CBP/p300, (Jain et al., 2015; Wurm et al., 2012), and immune inflammatory cascades (Enose‐Akahata et al., 2017), while counteracting and mimicking Tax associated activity (Belrose et al., 2011). HBZ is also known to interact with several transcription factors such as SIN3A, SP1, IRF3/7, ATF3, SMAD4/5, all of which have been shown to also promote the expression of ESCRT‐associated proteins like HRS, TSG101, and EAP30 (Ma et al., 2016). We suspect that HBZ may be modulating transcriptional activity both epigenetically and by various interaction partners with transcription complexes within the nucleus. HBZ plays a distinct role in enhancing infectivity and persistence and but how it modifies the endocytic pathway remains to be elucidated.
3.7. Exosomes harbouring inhibitory ICPs have immunosuppressive characteristics
Indeed, when incubating activated CD8+ T cells from healthy donors with exosomes derived from OSP2 cells, there was a decrease in activation based on the absolute number of MIP‐1α+ and TNF‐α+ CD8+ T cells, 2‐fold and 3.3‐fold, respectively. Comparatively, Jurkat‐derived exosomes that showed no effect on activated T‐cells (Figure 8a). Furthermore, pre‐treatment of OSP2 cells with Manumycin A (an exosome inhibitor) prior to exosome purification, did not result in the similar suppressive effect as seen with exosomes from untreated cells, indicating a distinct dampening of activated T‐cell with exosome exposure. Interestingly, this dampening effect was restored when T cells were incubated with exosome that were pretreated with a cocktail of ICP blocking antibodies (Figure 8b). IFNy levels were also reduced in the presence of OSP2 exosome albeit not significantly, perhaps due to the lack of an antigenic stimulation. This data indicated a distinct role for exosomal ICPs in contributing to adverse T‐cell functions.
FIGURE 8.
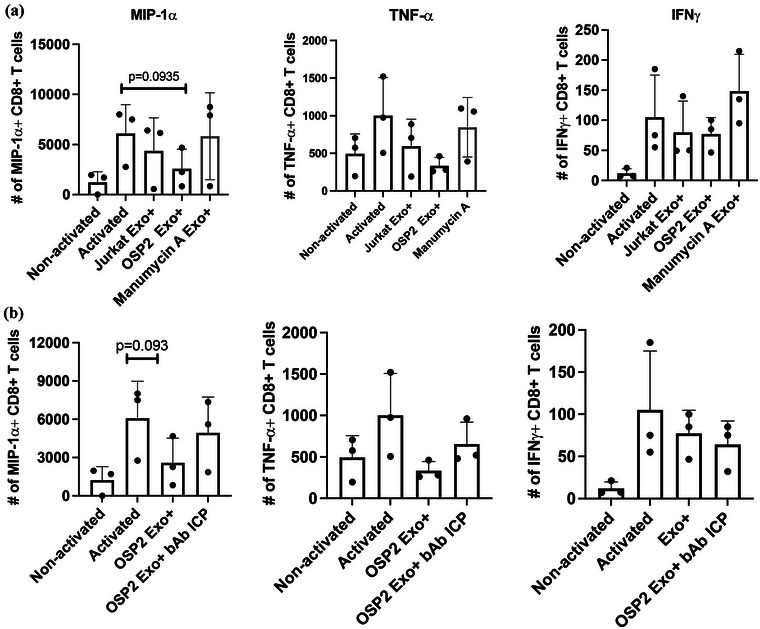
OSP2 exosome suppress T‐cell function. (a) Absolute counts of CD8+ T cells expressing MIP‐1a, TNF‐a, or IFNy after PMA/Ionomycin activation and stimulation with either exosomes isolated from Jurkat, OSP2, or manumycin A treated OSP2 cells. (b) Absolute counts of CD8+ T cells expressing MIP‐1a, TNF‐a, or IFNy after PMA/Ionomycin activation and stimulation with OSP2 exosomes alone, or those coincubated with a cocktail of anti‐PD‐L2, anti‐BTLA, anti‐LAG‐3, and anti‐PD‐1 blocking antibodies. Counts determined by experiments with n = 3 healthy donors and error bars represent SEM of donor variation, Statistical differences were determined by paired t‐tests *p < 0.05, **p < 0.005, ***p < 0.001.
4. DISCUSSION
Chronic activation of HTLV‐1 specific CD8+ T cells play a pivotal role in the development of HAM/TSP with Tax and HBZ having a critical role in associated inflammation and pathogenesis (Enose‐Akahata et al., 2017). Our previous ex vivo studies with HAM/TSP patients demonstrated elevated expression of inhibitory ICPs (a signature phenotype of exhausted T cells) on antigen (Tax)‐specific CTLs (Clements et al., 2021) as seen with other chronic viral infections (Joseph et al., 2021; Kong et al., 2020; Lee et al., 2022; Wiegand et al., 2019). In this study, we profiled and investigated whether exosomes derived from HTLV infected cells carry ICPs and highlight a role HBZ may play with HAM/TSP pathology.
In sera collected from our patient cohort, we observed a significant increase in levels of stimulatory analytes (i.e., CD27, CD28, and 4‐1BB) and inhibitory analytes (i.e., CTLA4, LAG‐3, and PD‐L2) in HAM/TSP patients, suggesting possible aberrant release of ICP molecules in infected individuals. Although it remains unclear which cell types are predominantly responsible for the release of each analyte, due to the scarce nature of readily available HAM/TSP patient samples, further studies on sera from patients that interrogate each immune cell‐type are limited. However, alternative research routes via HTLV‐1 infected cell systems previously described (Madugula et al., 2022) and using a unique HAM/TSP like cell system, OSP2 cells, have been crucial to establish our basic understanding of the ICP molecules in HTLV‐1 infection and disease. OSP2 cells demonstrated the presence of analytes with similar expression patterns as HAM/TSP patients. Indeed, we noticed several stimulatory (i.e., CD27, CD28, CD80, GITR, IDO, 4‐1BB), and inhibitory (i.e., BTLA, CTLA‐4, LAG‐3, PD‐L2) analytes significantly elevated. Interestingly, TIM‐3 was not detected in our soluble analyte screen and present at low levels in exosomes. Patients with HAM/TSP have been shown to have downregulated TIM‐3 expression compared to AC and seronegative individuals, and this down regulation has been seen to sustain highly active pathogenic T cells that may contribute to HAM/TSP pathology.
Coincidently, whilst evaluating the cell surface expression of these markers on the corresponding cell systems, both ATL‐ED and OSP2 showed the highest expression of several of these inhibitory ICPs. ATL‐ED is a unique HTLV‐1 associated cell system because although it has an intact provirus, it only expresses the antisense viral protein HBZ. Typically, during the course of infection, there is a pivot in expression between Tax and HBZ, as both promote each other's expression but cannot occur efficiently together. They also sit on opposite ends of the viral genome, with sense 5′LTR driving Tax and antisense 3′LTR driving HBZ expression (Mahgoub et al., 2018). Unlike the viral protein Tax, HBZ is not as immunogenic and is constitutively expressed throughout the course of infection. HBZ is a key regulator in viral maintenance and T‐cell proliferation, and is dominantly expressed in ATLL patients (Panfil et al., 2018). HBZ has pleiotropic effects that promote immune evasion, transforms cells with genetic and epigenetic loss of function, and, is known to alter the immune phenotype of infected cells while also enhancing factors associated with small extracellular vesicle secretion (sEV/exosomes) (Polakowski et al., 2014).
Exosomes have been shown to elicit responses in multiple pathological conditions with both protective and harmful effects (Schwarzenbach & Gahan, 2021). For the characterization of exosomes, along with tetraspanins detection via immunoblotting and nanotracking particle analysis, we utilized a novel exosome platform, ExoView ® R200 (SP‐IRIS), which provides a multiplexed and comprehensive analysis of exosome size, concentration, phenotype, and biomarker colocalization using florescent microscopy, with high sensitivity and resolution. Herein, SP‐IRIS allowed the detection of the immune checkpoint analyte, PD‐L1. This technology added to the overall characterization studies and corroborated the detection of ICPs. Among other ICPs, we noted a significant presence of BTLA, LAG‐3, PD‐1, and PD‐L2 in exosomes derived from OSP2 cells. TIM‐3 was again downregulated in exosomes. Although many studies have highlighted the role of exosomal PD‐1 (Qiu et al., 2021), among other ICP molecules, in regulating immune cell function, the mechanism in which these ICPs are incorporated into the endosomal pathway remain unclear. There have been several studies that showed exosomal PD‐1/PD‐L1 can functionally bind to their cognate receptor/ligand on recipient cells and induce downstream activation of pAKT/ERK (Qiu et al., 2021). Using BTLA (the most elevated marker in our systems) as a representative ICP, we confirmed that these analytes were not simply present but can bind to their cognate ligand such as HVEM for BTLA, indicating their potential in suppressing T‐cell activity.
Several studies have profiled proinflammatory cytokines that drive much of HAM/TSP pathology and in our representative cell systems looking at culture supernatant, free soluble (EV depleted), and EV‐associated samples we saw a unique set of cytokines often associated with hyperactivated states (Domingos et al., 2017). Although ATL‐ED and MT‐4 did not have a proinflammatory profile, expected due to their leukemic nature, OSP2 cells expressed several inflammatory cytokines that closely resemble what has been seen in patients, suggesting that OSP2 cells have potential to be used as a “bridge” to understand HAM/TSP pathology, allowing for the characterization of immune responses related to HTLV‐1 infection. Our data showed the existence of a constitutive expression of proinflammatory cytokines, IFNγ, IL‐6, and IL‐8, indiscriminately in all sample components (SUP, free soluble, and EV‐associated). These high‐baseline levels are to be expected from a chronically infected cell (OSP2); however, it was interesting to find that a regulatory cytokine, IL‐13, was exclusively EV‐associated and could indicate that vesicles from infected cells have potential to potentiate expression of Tax and activation of NFκB (Silbermann et al., 2008). A study performed with a HAM/TSP cohort in Iran reported elevated levels of HBZ and proviral expression together with IFNλ3 contributes to pathology (Mozhgani et al., 2018). IFNλ3 is a type III interferon associated with several autoimmune diseases as it mimics IFNγ activity; except that while IFNγ is an acute response, IFNλ3 has a prolonged and sustained response (Hemann et al., 2017). Unsurprisingly in OSP2 cells, there was elevated expression of IFNγ and while several studies have indicated roles of IFNγ in altering immune profiles (Teijaro, 2016), it has also been associated with enhanced EV secretion (de Pedro et al., 2021). Interestingly, our IFNγ stimulation studies revealed that while it played a protective role by increasing the expression of stimulatory ICPs, like CD28 and CD80, in Jurkat, ATL‐ED and MT‐4 cells, it had an opposite effect in OSP2 cells wherein several inhibitory ICPs were also elevated. This links IFNγ in contributing to T‐cell dysfunction and promoting hyperactive immunity seen in HAM/TSP patients.
HTLV‐1 EV studies have highlighted different fraction of EVs, that is, larger versus smaller vesicles, contain different cargo, which can promote cell adhesion and propagate viral spread (Pinto et al., 2021, 2019). The fractionation studies revealed PD‐L2 to be uniquely seen in the 100K, which is considered the exosomal fraction, and while BTLA, though present at very low quantities in 2k and 10k fraction, it was predominately in the 100k fraction. This, however, was not the case for IFNγ, which was higher in the larger fractions than the exosomal (data not shown). Interestingly, Tax was present in all three EV fractions while HBZ was unique to exosomes, hinting a pattern of active sorting of viral proteins to enhance HTLV‐1 persistence. These findings are consistent with previous studies which showed Tax differentially present in three different complexes of iodixanol gradient fractions and HBZ only in a low‐density fraction in non‐activated infected cells (Pinto et al., 2019), but takes the field further by confirming the presence of HBZ in the 100K EV fraction. The 100K fraction has potential use in future functional assays which are not possible in iodixanol fractions. This information is important to strategize future experiments that evaluate functional immune characteristics of EVs from patient sera.
Although there is no consensus on the standard of care for HAM/TSP, antiretroviral therapy has been one of the treatment strategies for controlling viral load (Araujo et al., 2019). In treating our cell systems with two antiretroviral drugs, Lopinavir and Azidothymidine, BTLA, which is naively expressed on T cells, was significantly reduced ATL‐ED and MT‐4, while in the OSP2 cell system, several inhibitory ICPs were significantly down regulated. Interestingly, HBZ was downregulated in all three HTLV‐1‐infected cells with treatment. While several studies have linked HBZ to inducing the expression of inhibitory ICPs (Yasuma et al., 2016) our data ties HBZ directly to changes in analyte secretion. The data thus far alludes to HBZ as a potential regulator of these soluble analytes and knockdown studies revealed that a significant loss of BTLA, LAG‐3, and PD‐L2 is seen with a lower expression of HBZ. This directly links HBZ to soluble/exosomal ICP expression. Although the cytoplasmic interactome of HBZ remains to be determined, it is well known that regulatory viral proteins can hijack the secretory pathway. Upon HBZ knockdown and overexpression in ATL‐ED and OSP2 cells, there was a significant reduction and gain in TrkB expression. Noticeable enrichment of TrkB was seen in HBZ overexpressing cells when immunoprecipitated with BDNF and at the ISRE promotor in OSP2 cells, revealing a potential link between HBZ, IFN activity and ICPs as the downstream activity of interferon stimulated genes have overlapping effects in sEV secretion and immune modulation (Anel et al., 2019). Furthermore, given the hyperactive proinflammatory profile of OSP2 cells, many of these elements are likely interconnected through several pathways. Interestingly, no significant change was observed in the genes of ESCRT pathway despite HBZ's substantial presence in the nucleus of ATL‐ED cells. In OSP2 cells, significant changes were observed in the expression of multiple ESCRT‐related genes at 48hrs suggesting secondary effects via HBZ interactions with the regulators of endocytic pathway. The HBZ interactome has several known partners including, MAPK/ERK, CREB, C/EBPa, CBP/p300, 26s proteosome, SMAD‐2/3/4, NFkB, NFAT, ATF3, FoxP3, and IRF (interferon regulatory factors) as well as engagement with several major cellular pathways associated with proliferation, latency/persistence, immune evasion, and other anti‐viral properties (Mukai & Ohshima, 2011). Several of these interaction partners, of note, SP1, ATF3, Sin3A, IRF4, SMAD4/5, are also involved in regulating the expression of ESCRT‐associated genes (Horner et al., 2018; Schmidt, 2012). As such, discerning the specific interaction partners that maybe directly or indirectly affecting ESCRT complexes is challenging. Additionally, whether HBZ cellular localization may be effecting the differences in expression patterns remains unclear. Furthermore, the role Tax may be playing in modulating members of the ESCRT complex, particularly in OSP2 cells, cannot be ignored. These interactions need to be studied further in order to elucidate which specific pathway HBZ modulates to enhance EV secretions and how this contributes to HAM/TSP pathology.
Although the mechanism remains elusive, understanding the potential these exosomes have in the context of T‐cell function can provide some insights to therapeutic strategies. Interestingly, in stimulating healthy T cells with exosomes from OSP2 cells, we noticed a distinct decrease in TNF‐α and MIP‐1α expression while IFNγ and IL‐2 ‐data not shown, remained unchanged. TNF‐α is one of several cytokines known to be elevated in the cerebrospinal fluid of HAM/TSP patients and released by infiltrating infected perivascular lymphocytes, which are also higher in HAM/TSP patients (Yamano & Sato, 2012). MIP‐1α, a crucial chemokine in initiating inflammation, is inversely corelated with proviral load (Manuel, Sehgal, Connolly et al., 2013) in HAM/TSP patients. Our data suggests that with exosome exposure overall T‐cell activation is dampened whilst targeting ICP can recover T‐cell activity. This suggests a role infected cell derived exosomes have in perpetuating dysfunctional T cells, a hallmark of HAM/TSP.
Currently, there remains no single effective treatment strategy for HAM/TSP. However, utilizing novel therapeutic strategies that can target intercellular mechanisms hijacked by HTLV‐1 has significant potential. Considering the role the secretory pathway has in HTLV‐1 and other viral infections, understanding, and targeting these routes along with anti‐retroviral therapy and ICI immunotherapy may provide alternative treatments to alleviate HAM/TSP pathology. With no vaccine or treatments available for HAM/TSP, targeting ICPs, soluble or cellular/exosome bound, may prove to be an effective means of reinvigorating immune cells to better combat and clear infection and/or reduce disease progression.
AUTHOR CONTRIBUTIONS
Julie Joseph performed most of the experimentation (with contributions from Thomas A. Premeaux, Daniel O. Pinto, Abhishek Rao, and Shrobona Guha) and drafted manuscript under direct guidance and mentorship of Pooja Jain. Thomas A. Premeaux conducted and analysed clinical data with guidance from Pooja Jain and Lishomwa C. Ndhlovu. Daniel O. Pinto conducted and analysed MSD cytokine analyses with guidance from Elke S. Bergmann‐Leitner and Pooja Jain. Abhishek Rao ran multi‐colour flow samples with guidance from Alison J. Carey. Shrobona Guha imaged confocal samples and assisted Julie Joseph in data analysis. Amanda R. Panfil generated vectors for the knockdown experiments and assisted in the final reading of the manuscript. Pooja Jain conceptualized the study, designed experiments, ensured proper execution, provided intellectual insights to data analysis, finalized data flow/presentation, and edited multiple drafts of the manuscript prior to approving for the submission.
Supporting information
Supplementary Table 1: Antibodies used for Western blotting.
Supplementary Table 2: Antibodies for Flowcytometry and Immunofluorescent imaging.
Supplementary Table 3: Primers used for qPCR.
Supporting Inforamtion
ACKNOWLEDGEMENTS
These studies are supported in part by the funding from NIH/NINDS via R01 NS097147 to Pooja Jain. Julie Joseph was also supported by the Interdisciplinary and Translational Research Training Grant in NeuroAIDS, NIH/NIMH T32‐MH079785. The following reagent was obtained through the NIH HIV Reagent Program, Division of AIDS, NIAID, NIH: Human T‐Lymphotropic Virus (HTLV‐1) OSP2‐infected Cells (Cat. No. ARP‐1393) contributed by Dr. Michael D. Lairmore. TAX (LT‐4) antibody was gifted by Dr. Yuetsu Tanaka (Japan). We acknowledge Leif Anderson from NanoView labs for facilitating ExoView analysis.
Joseph, J. , Premeaux, T. A. , Pinto, D. O. , Rao, A. , Guha, S. , Panfil, A. R. , Carey, A. J. , Ndhlovu, L. C. , Bergmann‐Leitner, E. S. , & Jain, P. (2023). Retroviral b‐Zip protein (HBZ) contributes to the release of soluble and exosomal immune checkpoint molecules in the context of neuroinflammation. Journal of Extracellular Biology, 2, e102. 10.1002/jex2.102
REFERENCES
- Abdelbary, N. H. , Abdullah, H. M. , Matsuzaki, T. , Hayashi, D. , Tanaka, Y. , Takashima, H. , Izumo, S. , & Kubota, R. (2011). Reduced Tim‐3 expression on human T‐lymphotropic Virus Type I (HTLV‐I) tax‐specific cytotoxic T lymphocytes in HTLV‐I infection. The Journal of Infectious Diseases, 203(7), 948–959. 10.1093/infdis/jiq153 [DOI] [PubMed] [Google Scholar]
- Abusamra, A. J. , Zhong, Z. , Zheng, X. , Li, M. , Ichim, T. E. , Chin, J. L. , & Min, W.‐P. (2005). Tumor exosomes expressing Fas ligand mediate CD8+ T‐cell apoptosis. Blood Cells, Molecules, and Diseases, 35(2), 169–173. 10.1016/j.bcmd.2005.07.001 [DOI] [PubMed] [Google Scholar]
- Ahuja, J. , Kampani, K. , Datta, S. , Wigdahl, B. , Flaig, K. E. , & Jain, P. (2006). Use of human antigen presenting cell gene array profiling to examine the effect of human T‐cell leukemia virus type 1 Tax on primary human dendritic cells. Journal of Neurovirology, 12(1), 47–59. [DOI] [PubMed] [Google Scholar]
- Ahuja, J. , Lepoutre, V. , Wigdahl, B. , Khan, Z. K. , & Jain, P. (2007). Induction of pro‐inflammatory cytokines by human T‐cell leukemia virus type‐1 Tax protein as determined by multiplexed cytokine protein array analyses of human dendritic cells. Biomedicine & Pharmacotherapy, 61(4), 201–208. [DOI] [PMC free article] [PubMed] [Google Scholar]
- Alefantis, T. , Flaig, K. E. , Wigdahl, B. , & Jain, P. (2007). Interaction of HTLV‐1 Tax protein with calreticulin: Implications for Tax nuclear export and secretion. Biomedicine & Pharmacotherapy, 61(4), 194–200. [DOI] [PMC free article] [PubMed] [Google Scholar]
- Alefantis, T. , Jain, P. , Ahuja, J. , Mostoller, K. , & Wigdahl, B. (2005). HTLV‐1 Tax nucleocytoplasmic shuttling, interaction with the secretory pathway, extracellular signaling, and implications for neurologic disease. Journal of Biomedical Science, 12(6), 961–974. [DOI] [PubMed] [Google Scholar]
- Ali, S. , Toews, K. , Schwiebert, S. , Klaus, A. , Winkler, A. , Grunewald, L. , Oevermann, L. , Deubzer, H. E. , Tüns, A. , Jensen, M. C. , Henssen, A. G. , Eggert, A. , Schulte, J. H. , Schwich, E. , Rebmann, V. , Schramm, A. , & Künkele, A. (2020). Tumor‐derived extracellular vesicles impair CD171‐specific CD4+ CAR T cell efficacy. Frontiers in Immunology, 11, 531. 10.3389/fimmu.2020.00531 [DOI] [PMC free article] [PubMed] [Google Scholar]
- Aliya, N. , Rahman, S. , Khan, Z. K. , & Jain, P. (2012). Cotranscriptional chromatin remodeling by small RNA species: An HTLV‐1 perspective. Leukaemia Research and Treatment, 2012, 984754–68. [DOI] [PMC free article] [PubMed] [Google Scholar]
- Andrade, R. G. , Gonçalves, P. , de, C. , Ribeiro, M. A. , Romanelli, L. C. F. , Ribas, J. G. , Torres, E. B. , Carneiro‐Proietti, A. B. , de, F. , Barbosa‐Stancioli, E. F. , & Martins, M. L. (2013). Strong correlation between tax and HBZ mRNA expression in HAM/TSP patients: Distinct markers for the neurologic disease. Journal of Clinical Virology, 56(2), 135–140. 10.1016/j.jcv.2012.10.003 [DOI] [PubMed] [Google Scholar]
- Anel, A. , Gallego‐Lleyda, A. , de, M. D. , Naval, J. , & Martínez‐Lostao, L. (2019). Role of exosomes in the regulation of T‐cell mediated immune responses and in autoimmune disease. Cells, 8(2), 154. [DOI] [PMC free article] [PubMed] [Google Scholar]
- Araujo, A. , Bangham, C. R. M. , Casseb, J. , Gotuzzo, E. , Jacobson, S. , Martin, F. , de Oliveira, A. P. , Puccioni‐Sohler, M. , Taylor, G. P. , & Yamano, Y. (2019). Management of HAM/TSP. Systematic Review and Consensus‐based Recommendations, 11(1), 49–56. [DOI] [PMC free article] [PubMed] [Google Scholar]
- Araya, N. , Sato, T. , Ando, H. , Tomaru, U. , Yoshida, M. , Coler‐Reilly, A. , Yagishita, N. , Yamauchi, J. , Hasegawa, A. , Kannagi, M. , Hasegawa, Y. , Takahashi, K. , Kunitomo, Y. , Tanaka, Y. , Nakajima, T. , Nishioka, K. , Utsunomiya, A. , Jacobson, S. , & Yamano, Y. (2014). HTLV‐1 induces a Th1‐like state in CD4+CCR4+ T cells. Journal of Clinical Investigation, 124(8), 3431–3442. 10.1172/jci75250 [DOI] [PMC free article] [PubMed] [Google Scholar]
- Arnold, J. , Zimmerman, B. , Li, M. , Lairmore, M. D. , & Green, P. L. (2008). Human T‐cell leukemia virus type‐1 antisense‐encoded gene, Hbz, promotes T‐lymphocyte proliferation. Blood, 112(9), 3788–3797. [DOI] [PMC free article] [PubMed] [Google Scholar]
- Belrose, G. , Gross, A. , Olindo, S. , Lézin, A. , Dueymes, M. , Komla‐Soukha, I. , Smadja, D. , Tanaka, Y. , Willems, L. , Mesnard, J.‐M. , Peloponese, J.‐M. , & Césaire, R. (2011). Effects of valproate on Tax and HBZ expression in HTLV‐1 and HAM/TSP T lymphocytes. Blood, 118(9), 2483–2491. 10.1182/blood-2010-11-321364 [DOI] [PubMed] [Google Scholar]
- Boelig, R. C. , Aghai, Z. H. , Chaudhury, S. , Kazan, A. S. , Chan, J. S. Y. , & Bergmann‐Leitner, E. (2022). Impact of COVID‐19 disease and COVID‐19 vaccination on maternal or fetal inflammatory response, placental pathology, and perinatal outcomes. American Journal of Obstetrics & Gynecology, 227(4), 652–656. [DOI] [PMC free article] [PubMed] [Google Scholar]
- Boukli, N. M. , Shetty, V. , Cubano, L. , Ricaurte, M. , Coelho‐dos‐Reis, J. , Nickens, Z. , Shah, P. , Talal, A. H. , Philip, R. , & Jain, P. (2012). Unique and differential protein signatures within the mononuclear cells of HIV‐1 and HCV mono‐infected and co‐infected patients. Clinical Proteomics, 9(1), 11–25. 10.1186/1559-0275-9-11 [DOI] [PMC free article] [PubMed] [Google Scholar]
- Cai, H. , Liu, G. , Zhong, J. , Zheng, K. , Xiao, H. , Li, C. , Song, X. , Li, Y. , Xu, C. , Wu, H. , He, Z. , & Zhu, Q. (2020). Immune checkpoints in viral infections. Viruses, 12(9), 1051. 10.3390/v12091051 [DOI] [PMC free article] [PubMed] [Google Scholar]
- Chen, G. , Huang, A. C. , Zhang, W. , Zhang, G. , Wu, M. , Xu, W. , Yu, Z. , Yang, J. , Wang, B. , Sun, H. , Xia, H. , Man, Q. , Zhong, W. , Antelo, L. F. , Wu, B. , Xiong, X. , Liu, X. , Guan, L. , Li, T. , … Guo, W. (2018). Exosomal PD‐L1 contributes to immunosuppression and is associated with anti‐PD‐1 response. Nature, 560(7718), 382–386. 10.1038/s41586-018-0392-8 [DOI] [PMC free article] [PubMed] [Google Scholar]
- Chiba, M. , Kubota, S. , Sato, K. , & Monzen, S. (2018). Exosomes released from pancreatic cancer cells enhance angiogenic activities via dynamin‐dependent endocytosis in endothelial cells in vitro. Scientific Reports, 8(1), 11972. [DOI] [PMC free article] [PubMed] [Google Scholar]
- Chibueze, E. C. , Yoshimitsu, M. , & Arima, N. (2013). B and T lymphocyte attenuator (BTLA)/herpes virus entry mediator (HVEM) interaction: Attenuating virus specific CD8+T cell function in HTLV‐1 infection. Blood, 122(21), 4727. [Google Scholar]
- Chiu, C.‐C. , Liao, Y.‐E. , Yang, L.‐Y. , Wang, J.‐Y. , Tweedie, D. , Karnati, H. K. , Greig, N. H. , & Wang, J.‐Y. (2016). Neuroinflammation in animal models of traumatic brain injury. Journal of Neuroscience Methods, 272, 38–49. 10.1016/j.jneumeth.2016.06.018 [DOI] [PMC free article] [PubMed] [Google Scholar]
- Choy, C. , Ansari, K. I. , Neman, J. , Hsu, S. , Duenas, M. J. , Li, H. , Vaidehi, N. , & Jandial, R. (2017). Cooperation of neurotrophin receptor TrkB and Her2 in breast cancer cells facilitates brain metastases. Breast Cancer Research, 19(1), 51. 10.1186/s13058-017-0844-3 [DOI] [PMC free article] [PubMed] [Google Scholar]
- Clements, D. M. , Crumley, B. , Chew, G. M. , Davis, E. , Bruhn, R. , Murphy, E. L. , Ndhlovu, L. C. , & Jain, P. (2021). Phenotypic and functional analyses guiding combination immune checkpoint immunotherapeutic strategies in HTLV‐1 infection. Frontiers in Immunology, 12(510), 608890. 10.3389/fimmu.2021.608890 [DOI] [PMC free article] [PubMed] [Google Scholar]
- Clements, D. M. , Crumley, B. , Chew, G. M. , Davis, E. , Bruhn, R. , Murphy, E. L. , Ndhlovu, L. C. , & Jain, P. (2021). Phenotypic and functional analyses guiding combination immune checkpoint immunotherapeutic strategies in HTLV‐1 infection. Frontiers in Immunology, 12, 608890. 10.3389/fimmu.2021.608890 [DOI] [PMC free article] [PubMed] [Google Scholar]
- de Pedro, M. Á. , Gómez‐Serrano, M. , Marinaro, F. , López, E. , Pulido, M. , Preußer, C. , Pogge von Strandmann, E. , Sánchez‐Margallo, F. M. , Álvarez, V. , & Casado, J. G. (2021). IFN‐gamma and TNF‐alpha as a priming strategy to enhance the immunomodulatory capacity of secretomes from menstrual blood‐derived stromal cells. International Journal of Molecular Sciences, 22(22), 12177. 10.3390/ijms222212177 [DOI] [PMC free article] [PubMed] [Google Scholar]
- Domingos, J. A. , Soares, L. S. , Bandeira, L. M. , Bonin, C. M. , Vicente, A. C. P. , Zanella, L. , Puga, M. A. M. , Tozetti, I. A. , Motta‐Castro, A. R. C. , & da Cunha, R. V. (2017). Cytokine profile and proviral load among Japanese immigrants and non‐Japanese infected with HTLV‐1 in a non‐endemic area of Brazil. PLoS ONE, 12(4), e0174869. 10.1371/journal.pone.0174869 [DOI] [PMC free article] [PubMed] [Google Scholar]
- Duncan, D. S. , & Miller, S. D. (2011). CNS expression of B7‐H1 regulates pro‐inflammatory cytokine production and alters severity of Theiler's virus‐induced demyelinating disease. PLoS ONE, 6(4), e18548. [DOI] [PMC free article] [PubMed] [Google Scholar]
- 102. El Hajj, H. , & Bazarbachi, A. (2022). Interplay between innate immunity and the viral oncoproteins Tax and HBZ in the pathogenesis and therapeutic response of HTLV‐1 associated adult T cell leukemia. Frontiers in Immunology, 13, 957535. [DOI] [PMC free article] [PubMed] [Google Scholar]
- Enose‐Akahata, Y. , & Jacobson, S. (2019). Immunovirological markers in HTLV‐1‐associated myelopathy/tropical spastic paraparesis (HAM/TSP). Retrovirology, 16(1), 35. [DOI] [PMC free article] [PubMed] [Google Scholar]
- Enose‐Akahata, Y. , Vellucci, A. , & Jacobson, S. (2017). Role of HTLV‐1 Tax and HBZ in the Pathogenesis of HAM/TSP. Frontiers in Microbiology, 8, 2563. [DOI] [PMC free article] [PubMed] [Google Scholar]
- Essandoh, K. , Yang, L. , Wang, X. , Huang, W. , Qin, D. , Hao, J. , Wang, Y. , Zingarelli, B. , Peng, T. , & Fan, G.‐C. (2015). Blockade of exosome generation with GW4869 dampens the sepsis‐induced inflammation and cardiac dysfunction. Biochimica et Biophysica Acta (BBA): Molecular Basis of Disease, 1852(11), 2362–2371. 10.1016/j.bbadis.2015.08.010 [DOI] [PMC free article] [PubMed] [Google Scholar]
- Grant, C. , Jain, P. , Nonnemacher, M. , Flaig, K. E. , Irish, B. , Ahuja, J. , Alexaki, A. , Alefantis, T. , & Wigdahl, B. (2006). AP‐1‐directed human T cell leukemia virus type 1 viral gene expression during monocytic differentiation. Journal of Leukocyte Biology, 80(3), 640–650. 10.1189/jlb.1205723 [DOI] [PubMed] [Google Scholar]
- Gupta, A. , & Pulliam, L. (2014). Exosomes as mediators of neuroinflammation. Journal of Neuroinflammation, 11, 68. [DOI] [PMC free article] [PubMed] [Google Scholar]
- Hemann, E. A. , Gale, M. , & Savan, R. (2017). Interferon lambda genetics and biology in regulation of viral control. Frontiers in Immunology, 8, 1707. [DOI] [PMC free article] [PubMed] [Google Scholar]
- Horner, D. S. , Pasini, M. E. , Beltrame, M. , Mastrodonato, V. , Morelli, E. , & Vaccari, T. (2018). ESCRT genes and regulation of developmental signaling. Seminars in Cell & Developmental Biology, 74, 29–39. [DOI] [PubMed] [Google Scholar]
- Irish, B. P. , Khan, Z. K. , Jain, P. , Nonnemacher, M. R. , Pirrone, V. , & Rahman, S. , Rajagopalan, N. , Suchitra, J. B. , Mostoller, K. , & Wigdahl, B. (2009). Molecular mechanisms of neurodegenerative diseases induced by human retroviruses: A review. American Journal of Infectious Disease, 5(3), 231–258. [DOI] [PMC free article] [PubMed] [Google Scholar]
- Jain, P. , Ahuja, J. , Khan, Z. K. , Shimizu, S. , Meucci, O. , Jennings, S. R. , & Wigdahl, B. (2007). Modulation of dendritic cell maturation and function by the Tax protein of human T cell leukemia virus type 1. Journal of Leukocyte Biology, 82(1), 44–56. 10.1189/jlb.1006641 [DOI] [PMC free article] [PubMed] [Google Scholar]
- Jain, P. , Lavorgna, A. , Sehgal, M. , Gao, L. , Ginwala, R. , Sagar, D. , Harhaj, E. W. , & Khan, Z. K. (2015). Myocyte enhancer factor (MEF)‐2 plays essential roles in T‐cell transformation associated with HTLV‐1 infection by stabilizing complex between Tax and CREB. Retrovirology, 12(1), 23. 10.1186/s12977-015-0140-1 [DOI] [PMC free article] [PubMed] [Google Scholar]
- Jain, P. , Manuel, S. L. , Khan, Z. K. , Ahuja, J. , Quann, K. , & Wigdahl, B. (2009). DC‐SIGN mediates cell‐free infection and transmission of human T‐cell lymphotropic virus type 1 by dendritic cells. Journal of Virology, 83(21), 10908–10921. [DOI] [PMC free article] [PubMed] [Google Scholar]
- Joseph, J. , Rahmani, B. , Cole, Y. , Puttagunta, N. , Lin, E. , Khan, Z. K. , & Jain, P. (2021). Can soluble immune checkpoint molecules on exosomes mediate inflammation? Journal of Neuroimmune Pharmacology, 17(3–4), 381–397. 10.1007/s11481-021-10018-3 [DOI] [PMC free article] [PubMed] [Google Scholar]
- Joseph, J. , Rahmani, B. , Cole, Y. , Puttagunta, N. , Lin, E. , Khan, Z. K. , & Jain, P. (2021). Can soluble immune checkpoint molecules on exosomes mediate inflammation? Journal of Neuroimmune Pharmacology, 17(3–4), 381–397. 10.1007/s11481-021-10018-3 [DOI] [PMC free article] [PubMed] [Google Scholar]
- Kampani, K. , Quann, K. , Ahuja, J. , Wigdahl, B. , Khan, Z. K. , & Jain, P. (2007). A novel high throughput quantum dot‐based fluorescence assay for quantitation of virus binding and attachment. Journal of Virological Methods, 141(2), 125–132. [DOI] [PMC free article] [PubMed] [Google Scholar]
- Kim, H. , Park, S. , Jeong, S. , Lee, Y. J. , Lee, H. , Kim, C. G. , Kim, K. H. , Hong, S. , Lee, J. , Kim, S. , Kim, H. K. , Min, B. S. , Chang, J. H. , Ju, Y. S. , Shin, E. , Song, G. , Hwang, S. , & Park, S. (2019). 4‐1BB delineates distinct activation status of exhausted tumor‐infiltrating CD8+ T cells in hepatocellular carcinoma. Hepatology, 71(3), 955–971. 10.1002/hep.30881 [DOI] [PMC free article] [PubMed] [Google Scholar]
- Kimata, J. T. , Wong, F. H. , Wang, J. J. , & Ratner, L. (1994). Construction and characterization of infectious human T‐cell leukemia virus type 1 molecular clones. Virology, 204(2), 656–664. [DOI] [PubMed] [Google Scholar]
- Kinosada, H. , Yasunaga, J. , Shimura, K. , Miyazato, P. , Onishi, C. , Iyoda, T. , Inaba, K. , & Matsuoka, M. (2017). Correction: HTLV‐1 bZIP factor enhances T‐cell proliferation by impeding the suppressive signaling of co‐inhibitory receptors. PLOS Pathogens, 13(2), e1006228. 10.1371/journal.ppat.1006228 [DOI] [PMC free article] [PubMed] [Google Scholar]
- Kong, Y. , Wang, Y. , Wu, X. , Han, J. , Li, G. , Hua, M. , Han, K. , Zhang, H. , Li, A. , & Zeng, H. (2020). Storm of soluble immune checkpoints associated with disease severity of COVID‐19. Signal Transduction and Targeted Therapy, 5(1), 192. 10.1038/s41392-020-00308-2 [DOI] [PMC free article] [PubMed] [Google Scholar]
- Kouwaki, T. , Fukushima, Y. , Daito, T. , Sanada, T. , Yamamoto, N. , Mifsud, E. J. , Leong, C. R. , Tsukiyama‐Kohara, K. , Kohara, M. , Matsumoto, M. , Seya, T. , & Oshiumi, H. (2016). Extracellular vesicles including exosomes regulate innate immune responses to hepatitis B virus infection. Frontiers in Immunology, 7, 335. 10.3389/fimmu.2016.00335 [DOI] [PMC free article] [PubMed] [Google Scholar]
- Kozako, T. , Yoshimitsu, M. , Akimoto, M. , White, Y. , Matsushita, K. , Soeda, S. , Shimeno, H. , Kubota, R. , Izumo, S. , & Arima, N. (2011). Programmed death‐1 (PD‐1)/PD‐1 ligand pathway–mediated immune responses against human T‐lymphotropic virus type 1 (HTLV‐1) in HTLV‐1‐associated myelopathy/tropical spastic paraparesis and carriers with autoimmune disorders. Human Immunology, 72(11), 1001–1006. 10.1016/j.humimm.2011.07.308 [DOI] [PubMed] [Google Scholar]
- Lee, N. , Jeong, S. , Jeon, K. , Park, M.‐J. , & Song, W. (2022). Prognostic impacts of soluble immune checkpoint regulators and cytokines in patients with SARS‐CoV‐2 infection. Frontiers in Immunology, 13, 903419. [DOI] [PMC free article] [PubMed] [Google Scholar]
- Lepoutre, V. , Jain, P. , Quann, K. , Wigdahl, B. , & Khan, Z. K. (2009). Role of resident CNS cell populations in HTLV‐1‐associated neuroinflammatory disease. Frontiers in Bioscience, 14, 1152–1168. [DOI] [PMC free article] [PubMed] [Google Scholar]
- Liu, W. , Bai, X. , Zhang, A. , Huang, J. , Xu, S. , & Zhang, J. (2019). Role of exosomes in central nervous system diseases. Frontiers in Molecular Neuroscience, 12, 240. [DOI] [PMC free article] [PubMed] [Google Scholar]
- Lundholm, M. , Schröder, M. , Nagaeva, O. , Baranov, V. , Widmark, A. , Mincheva‐Nilsson, L. , & Wikström, P. (2014). Prostate tumor‐derived exosomes down‐regulate NKG2D expression on natural killer cells and CD8+ T cells: mechanism of immune evasion. PLoS ONE, 9(9), e108925. 10.1371/journal.pone.0108925 [DOI] [PMC free article] [PubMed] [Google Scholar]
- Ma, G. , Yasunaga, J.‐I. , & Matsuoka, M. (2016). Multifaceted functions and roles of HBZ in HTLV‐1 pathogenesis. Retrovirology, 13(1), 16. [DOI] [PMC free article] [PubMed] [Google Scholar]
- Madugula, K. K. , Joseph, J. , DeMarino, C. , Ginwala, R. , Teixeira, V. , Khan, Z. K. , Sales, D. , Wilson, S. , Kashanchi, F. , Rushing, A. W. , Lemasson, I. , Harhaj, E. W. , Janakiram, M. , Ye, B. H. , & Jain, P. (2022). Regulation of human T‐cell leukemia virus type 1 antisense promoter by myocyte enhancer factor‐2C in the context of adult T‐cell leukemia and lymphoma. Haematologica, 107(12), 2928–2943. 10.3324/haematol.2021.279542 [DOI] [PMC free article] [PubMed] [Google Scholar]
- Mahgoub, M. , Yasunaga, J. , Iwami, S. , Nakaoka, S. , Koizumi, Y. , Shimura, K. , & Matsuoka, M. (2018). Sporadic on/off switching of HTLV‐1 Tax expression is crucial to maintain the whole population of virus‐induced leukemic cells. Proceedings of the National Academy of Sciences, 115(6), E1269–e78. 10.1073/pnas.1715724115 [DOI] [PMC free article] [PubMed] [Google Scholar]
- Maloney, E. M. , Cleghorn, F. R. , Morgan, O. St. C. , Rodgers‐Johnson, P. , Cranston, B. , Jack, N. , Blattner, W. A. , Bartholomew, C. , & Manns, A. (1998). Incidence of HTLV‐I‐associated myelopathy/tropical spastic paraparesis (HAM/TSP) in Jamaica and Trinidad. Journal of Acquired Immune Deficiency Syndromes and Human Retrovirology, 17(2), 167–170. 10.1097/00042560-199802010-00011 [DOI] [PubMed] [Google Scholar]
- Malpica, L. , Pimentel, A. , Reis, I. M. , Gotuzzo, E. , Lekakis, L. , Komanduri, K. , Harrington, T. , Barber, G. N. , & Ramos, J. C. (2018). Epidemiology, clinical features, and outcome of HTLV‐1–related ATLL in an area of prevalence in the United States. Blood Advances, 2(6), 607–620. 10.1182/bloodadvances.2017011106 [DOI] [PMC free article] [PubMed] [Google Scholar]
- Manuel, S. , Rahman, S. , Wigdahl, B. , Khan, Z. K. , & Jain, P. (2007). Dendritic cells in autoimmune diseases and neuroinflammatory disorders. Frontiers in Bioscience, 12, 4315–4335. [DOI] [PubMed] [Google Scholar]
- Manuel, S. L. , Schell, T. D. , Acheampong, E. , Rahman, S. , Khan, Z. K. , & Jain, P. (2009). Presentation of human T cell leukemia virus type 1 (HTLV‐1) Tax protein by dendritic cells: The underlying mechanism of HTLV‐1‐associated neuroinflammatory disease. Journal of Leukocyte Biology, 86(5), 1205–1216. [DOI] [PMC free article] [PubMed] [Google Scholar]
- Manuel, S. L. , Sehgal, M. , Connolly, J. , Makedonas, G. , Khan, Z. K. , Gardner, J. , Betts, M. R. , & Jain, P. (2013). Lack of recall response to tax in ATL and HAM/TSP patients but not in asymptomatic carriers of human T‐cell leukemia virus type 1. Journal of Clinical Immunology, 33(7), 1223–1239. 10.1007/s10875-013-9918-x [DOI] [PMC free article] [PubMed] [Google Scholar]
- Manuel, S. L. , Sehgal, M. , Khan, Z. K. , Goedert, J. J. , Betts, M. R. , & Jain, P. (2013). An altered maturation and adhesion phenotype of dendritic cells in diseased individuals compared to asymptomatic carriers of human T cell leukemia virus type 1. AIDS Research and Human Retroviruses, 29(9), 1273–1285. [DOI] [PMC free article] [PubMed] [Google Scholar]
- Martini, F. , Arone, C. , Hasset, A. , Hall, W. W. , & Sheehy, N. (2019). The ESCRT‐0 protein HRS interacts with the human T cell leukemia virus type 2 antisense protein APH‐2 and suppresses viral replication. Journal of Virology, 94(1), e01311–19. [DOI] [PMC free article] [PubMed] [Google Scholar]
- Montanheiro, P. A. , Penalva de Oliveira, A. C. , Smid, J. , Fukumori, L. M. I. , Olah, I. , Duarte, A. J. , da, S. , & Casseb, J. (2009). The elevated interferon gamma production is an important immunological marker in HAM/TSP pathogenesis. Scandinavian Journal of Immunology, 70(4), 403–407. 10.1111/j.1365-3083.2009.02291.x [DOI] [PubMed] [Google Scholar]
- Morganti‐Kossmann, M. C. , Rancan, M. , Otto, V. I. , Stahel, P. F. , & Kossmann, T. (2001). Role of cerebral inflammation after traumatic brain injury: A revisited concept. Shock, 16(3), 165–177. [DOI] [PubMed] [Google Scholar]
- Mostoller, K. , Norbury, C. C. , Jain, P. , & Wigdahl, B. (2004). Human T‐cell leukemia virus type I Tax induces the expression of dendritic cell markers associated with maturation and activation. Journal of Neurovirology, 10(6), 358–371. [DOI] [PubMed] [Google Scholar]
- Moya‐Alvarado, G. , Guerra, M. V. , Tiburcio, R. , Bravo, E. , & Bronfman, F. C. (2022). The Rab11‐regulated endocytic pathway and BDNF/TrkB signaling: Roles in plasticity changes and neurodegenerative diseases. Neurobiology of Disease, 171, 105796. [DOI] [PubMed] [Google Scholar]
- Mozhgani, S.‐H. , Jaberi, N. , Rezaee, S. A. , Bustani, R. , Jazayeri, S. M. , Akbarin, M. M. , Milani, S. , Tarokhian, H. , & Norouzi, M. (2016). Evaluation of HTLV‐1 HBZ and proviral load, together with hostIFN λ3, in pathogenesis of HAM/TSP. Journal of Medical Virology, 89(6), 1102–1107. 10.1002/jmv.24721 [DOI] [PubMed] [Google Scholar]
- Mozhgani, S.‐H. , Jahantigh, H. R. , Rafatpanah, H. , Valizadeh, N. , Mohammadi, A. , Basharkhah, S. , & Rezaee, S. A. (2018). Interferon lambda family along with HTLV‐1 proviral load, tax, and HBZ implicated in the pathogenesis of myelopathy/tropical spastic paraparesis. neurodegenerative diseases, 18(2–3), 150–155. 10.1159/000490058 [DOI] [PubMed] [Google Scholar]
- Mukai, R. , & Ohshima, T. (2011). Dual effects of HTLV‐1 bZIP factor in suppression of interferon regulatory factor 1. Biochemical and Biophysical Research Communications, 409(2), 328–332. [DOI] [PubMed] [Google Scholar]
- Murphy, E. L. , Glynn, S. A. , Fridey, J. , Sacher, R. A. , Smith, J. W. , Wright, D. J. , Newman, B. , Gibble, J. W. , Ameti, D. I. , Nass, C. C. , Schreiber, G. B. , & Nemo, G. J. (1997). Increased prevalence of infectious diseases and other adverse outcomes in human T lymphotropic virus types I‐ and II‐infected blood donors. Retrovirus Epidemiology Donor Study (REDS) Study Group. The Journal of Infectious Diseases, 176(6), 1468–1475. 10.1086/514143 [DOI] [PubMed] [Google Scholar]
- Narayanan, A. , Jaworski, E. , Van Duyne, R. , Iordanskiy, S. , Guendel, I. , Das, R. , Currer, R. , Sampey, G. , Chung, M. , Kehn‐Hall, K. , Bailey, C. , Popratiloff, A. , & Kashanchi, F. (2014). Exosomes derived from HTLV‐1 infected cells contain the viral protein Tax. Retrovirology, 11(S1), O46. 10.1186/1742-4690-11-s1-o46 [DOI] [Google Scholar]
- Ndhlovu, L. C. , Leal, F. E. , Hasenkrug, A. M. , Jha, A. R. , Carvalho, K. I. , Eccles‐James, I. G. , Bruno, F. R. , Vieira, R. G. S. , York, V. A. , Chew, G. M. , Jones, R. B. , Tanaka, Y. , Neto, W. K. , Sanabani, S. S. , Ostrowski, M. A. , Segurado, A. C. , Nixon, D. F. , & Kallas, E. G. (2011). HTLV‐1 tax specific CD8+ T cells express low levels of Tim‐3 in HTLV‐1 infection: Implications for progression to neurological complications. PLoS Neglected Tropical Diseases, 5(4), e1030. 10.1371/journal.pntd.0001030 [DOI] [PMC free article] [PubMed] [Google Scholar]
- Ndhlovu, L. C. , Leal, F. E. , Hasenkrug, A. M. , Jha, A. R. , Carvalho, K. I. , Eccles‐James, I. G. , Bruno, F. R. , Vieira, R. G. S. , York, V. A. , Chew, G. M. , Jones, R. B. , Tanaka, Y. , Neto, W. K. , Sanabani, S. S. , Ostrowski, M. A. , Segurado, A. C. , Nixon, D. F. , & Kallas, E. G. (2011). HTLV‐1 tax specific CD8+ T cells express low levels of Tim‐3 in HTLV‐1 infection: Implications for progression to neurological complications. PLoS Neglected Tropical Diseases, 5(4), e1030. 10.1371/journal.pntd.0001030 [DOI] [PMC free article] [PubMed] [Google Scholar]
- Otaguiri, K. K. , Santos dos, D. F. , Slavov, S. N. , Depieri, L. V. , Palma, P. V. B. , Meirelles, F. V. , Covas, D. T. , da Silveira, J. C. , & Kashima, S. (2018). TAX‐mRNA‐carrying exosomes from human T cell lymphotropic virus type 1‐infected cells can induce interferon‐gamma production in vitro. AIDS Research and Human Retroviruses, 34(12), 1075–1082. 10.1089/aid.2018.0115 [DOI] [PubMed] [Google Scholar]
- Panfil, A. R. , Al‐Saleem, J. , Howard, C. M. , Shkriabai, N. , Kvaratskhelia, M. , & Green, P. L. (2018). Stability of the HTLV‐1 antisense‐derived protein, HBZ, is regulated by the E3 ubiquitin‐protein ligase, UBR5. Frontiers in Microbiology, 9, 80. [DOI] [PMC free article] [PubMed] [Google Scholar]
- Panfil, A. R. , Dissinger, N. J. , Howard, C. M. , Murphy, B. M. , Landes, K. , Fernandez, S. A. , & Green, P. L. (2016). Functional comparison of HBZ and the related APH‐2 protein provides insight into human T‐cell leukemia virus type 1 pathogenesis. Journal of Virology, 90(7), 3760–3772. 10.1128/jvi.03113-15 [DOI] [PMC free article] [PubMed] [Google Scholar]
- Pinet, S. , Bessette, B. , Vedrenne, N. , Lacroix, A. , Richard, L. , Jauberteau, M.‐O. , Battu, S. , & Lalloué, F. (2016). TrkB‐containing exosomes promote the transfer of glioblastoma aggressiveness to YKL‐40‐inactivated glioblastoma cells. Oncotarget, 7(31), 50349–50364. 10.18632/oncotarget.10387 [DOI] [PMC free article] [PubMed] [Google Scholar]
- Pinto, D. O. , Al Sharif, S. , Mensah, G. , Cowen, M. , Khatkar, P. , Erickson, J. , Branscome, H. , Lattanze, T. , DeMarino, C. , Alem, F. , Magni, R. , Zhou, W. , Alais, S. , Dutartre, H. , El‐Hage, N. , Mahieux, R. , Liotta, L. A. , & Kashanchi, F. (2021). Extracellular vesicles from HTLV‐1 infected cells modulate target cells and viral spread. Retrovirology, 18(1), 6. 10.1186/s12977-021-00550-8 [DOI] [PMC free article] [PubMed] [Google Scholar]
- Pinto, D. O. , DeMarino, C. , Pleet, M. L. , Cowen, M. , Branscome, H. , Sharif, A. , Al Sharif, S. , Jones, J. , Dutartre, H. , Lepene, B. , Liotta, L. A. , Mahieux, R. , & Kashanchi, F. (2019). HTLV‐1 extracellular vesicles promote cell‐to‐cell contact. Frontiers in Microbiology, 10, 2147. 10.3389/fmicb.2019.02147 [DOI] [PMC free article] [PubMed] [Google Scholar]
- 101. Platanitis, E. , & Decker, T. (2018). Regulatory networks involving STATs, IRFs, and NFκB in inflammation. Frontiers in Immunology, 9, 2542. [DOI] [PMC free article] [PubMed] [Google Scholar]
- Polakowski, N. , Terol, M. , Hoang, K. , Nash, I. , Laverdure, S. , Gazon, H. , Belrose, G. , Mesnard, J.‐M. , Césaire, R. , Péloponèse, J.‐M. , & Lemasson, I. (2014). HBZ stimulates brain‐derived neurotrophic factor/TrkB autocrine/paracrine signaling to promote survival of human T‐cell leukemia virus type 1‐infected T cells. Journal of Virology, 88(22), 13482–13494. 10.1128/jvi.02285-14 [DOI] [PMC free article] [PubMed] [Google Scholar]
- Polakowski, N. , Terol, M. , Nash, I. , Hoang, K. , Gazon, H. , Wurm, T. , Césaire, R. , Péloponèse, J.‐M. , Mesnard, J.‐M. , & Lemasson, I. (2014). A BDNF/TrKB autocrine loop stimulated by HBZ is involved in HTLV‐1‐infected cell‐survival. Retrovirology, 11(S1), O57. 10.1186/1742-4690-11-s1-o57 [DOI] [Google Scholar]
- Prasad, S. , Hu, S. , Sheng, W. S. , Chauhan, P. , Singh, A. , & Lokensgard, J. R. (2017). The PD‐1: PD‐L1 pathway promotes development of brain‐resident memory T cells following acute viral encephalitis. Journal of Neuroinflammation, 14(1), 82. [DOI] [PMC free article] [PubMed] [Google Scholar]
- Pustylnikov, S. , Sagar, D. , Jain, P. , & Khan, Z. K. (2014). Targeting the C‐type lectins‐mediated host‐pathogen interactions with dextran. Journal of Pharmacy & Pharmaceutical Sciences, 17(3), 371–392. [DOI] [PMC free article] [PubMed] [Google Scholar]
- Qiu, Y. , Yang, Y. , Yang, R. , Liu, C. , Hsu, J.‐M. , Jiang, Z. , Sun, L. , Wei, Y. , Li, C.‐W. , Yu, D. , Zhang, J. , & Hung, M.‐C. (2021). Activated T cell‐derived exosomal PD‐1 attenuates PD‐L1‐induced immune dysfunction in triple‐negative breast cancer. Oncogene, 40(31), 4992–5001. 10.1038/s41388-021-01896-1 [DOI] [PMC free article] [PubMed] [Google Scholar]
- Qiu, Y. , Yang, Y. , Yang, R. , Liu, C. , Hsu, J.‐M. , Jiang, Z. , Sun, L. , Wei, Y. , Li, C.‐W. , Yu, D. , Zhang, J. , & Hung, M.‐C. (2021). Activated T cell‐derived exosomal PD‐1 attenuates PD‐L1‐induced immune dysfunction in triple‐negative breast cancer. Oncogene, 40(31), 4992–5001. 10.1038/s41388-021-01896-1 [DOI] [PMC free article] [PubMed] [Google Scholar]
- Rahman, S. , Connolly, J. E. , Manuel, S. L. , Chehimi, J. , Montaner, L. J. , & Jain, P. (2011). Unique cytokine/chemokine signatures for HIV‐1 and HCV mono‐infection versus co‐infection as determined by the luminex(R) analyses. Journal of Clinical Cell Immunology, 2(1), 1–11. [DOI] [PMC free article] [PubMed] [Google Scholar]
- Rahman, S. , Khan, Z. K. , & Jain, P. (2011). The tug‐of‐war between dendritic cells and human chronic viruses. International Reviews of Immunology, 30(5‐6), 341–365. [DOI] [PMC free article] [PubMed] [Google Scholar]
- Rahman, S. , Khan, Z. K. , Wigdahl, B. , Jennings, S. R. , Tangy, F. , & Jain, P. (2011). Murine FLT3 ligand‐derived dendritic cell‐mediated early immune responses are critical to controlling cell‐free human T cell leukemia virus type 1 infection. Journal of Immunology, 186(1), 390–402. [DOI] [PMC free article] [PubMed] [Google Scholar]
- Rahman, S. , Manuel, S. L. , Khan, Z. K. , Wigdahl, B. , Acheampong, E. , Tangy, F. , & Jain, P. (2010). Depletion of dendritic cells enhances susceptibility to cell‐free infection of human T cell leukemia virus type 1 in CD11c‐diphtheria toxin receptor transgenic mice. The Journal of Immunology, 184(10), 5553–5561. 10.4049/jimmunol.0903226 [DOI] [PMC free article] [PubMed] [Google Scholar]
- Rahman, S. , Quann, K. , Pandya, D. , Singh, S. , Khan, Z. K. , & Jain, P. (2012). HTLV‐1 Tax mediated downregulation of miRNAs associated with chromatin remodeling factors in T cells with stably integrated viral promoter. PLoS ONE, 7(4), e34490. [DOI] [PMC free article] [PubMed] [Google Scholar]
- Ross, T. M. , Narayan, M. , Fang, Z.‐Y. , Minella, A. C. , & Green, P. L. (2000). Human T‐cell leukemia virus type 2 tax mutants that selectively abrogate NFκB or CREB/ATF activation fail to transform primary human T cells. Journal of Virology, 74(6), 2655–2662. [DOI] [PMC free article] [PubMed] [Google Scholar]
- Sagar, D. , Masih, S. , Schell, T. , Jacobson, S. , Comber, J. D. , Philip, R. , Wigdahl, B. , Jain, P. , & Khan, Z. K. (2014). In vivo immunogenicity of Tax(11–19) epitope in HLA‐A2/DTR transgenic mice: Implication for dendritic cell‐based anti‐HTLV‐1 vaccine. Vaccine, 32(26), 3274–3284. 10.1016/j.vaccine.2014.03.087 [DOI] [PMC free article] [PubMed] [Google Scholar]
- Saito, M. , Matsuzaki, T. , Satou, Y. , Yasunaga, J. , Saito, K. , Arimura, K. , Matsuoka, M. , & Ohara, Y. (2009). In vivo expression of the HBZ gene of HTLV‐1 correlates with proviral load, inflammatory markers and disease severity in HTLV‐1 associated myelopathy/tropical spastic paraparesis (HAM/TSP). Retrovirology, 6(1), 19. 10.1186/1742-4690-6-19 [DOI] [PMC free article] [PubMed] [Google Scholar]
- Satou, Y. , Yasunaga, J. , Yoshida, M. , & Matsuoka, M. (2006). HTLV‐I basic leucine zipper factor gene mRNA supports proliferation of adult T cell leukemia cells. Proceedings of the National Academy of Sciences USA, 103(3), 720–725. [DOI] [PMC free article] [PubMed] [Google Scholar]
- Schachtele, S. J. , Hu, S. , Sheng, W. S. , Mutnal, M. B. , & Lokensgard, J. R. (2014). Glial cells suppress postencephalitic CD8+ T lymphocytes through PD‐L1. Glia, 62(10), 1582–1594. [DOI] [PMC free article] [PubMed] [Google Scholar]
- Schmidt, O. (2012). Teis D. The ESCRT machinery. Current Biology, 22(4), R116–20. [DOI] [PMC free article] [PubMed] [Google Scholar]
- Schwarzenbach, H. , & Gahan, P. B. (2021). Exosomes in immune regulation. Noncoding RNA, 7(1), 4. [DOI] [PMC free article] [PubMed] [Google Scholar]
- Sehgal, M. , Khan, Z. K. , Talal, A. H. , & Jain, P. (2013). Dendritic cells in HIV‐1 and HCV infection: Can they help win the battle? Virology: Research and Treatment, 4, 1–25.. [DOI] [PMC free article] [PubMed] [Google Scholar]
- Sehgal, M. , Zeremski, M. , Talal, A. H. , Khan, Z. K. , Capocasale, R. , & Philip, R. (2014). Host genetic factors and dendritic cell responses associated with the outcome of interferon/ribavirin treatment in HIV‐1/HCV Co‐infected individuals. Journal of Clinical and Cellular Immunology, 5, 1000271. [DOI] [PMC free article] [PubMed] [Google Scholar]
- Sharif, A. , Pinto, D. O. , Mensah, G. A. , Dehbandi, F. , Khatkar, P. , Kim, Y. , Branscome, H. , & Kashanchi, F. (2020). Extracellular vesicles in HTLV‐1 communication: The story of an invisible messenger. Viruses, 12(12), 1422. 10.3390/v12121422 [DOI] [PMC free article] [PubMed] [Google Scholar]
- Shetty, V. , Jain, P. , Nickens, Z. , Sinnathamby, G. , Mehta, A. , & Philip, R. (2011). Investigation of plasma biomarkers in HIV‐1/HCV mono‐ and coinfected individuals by multiplex iTRAQ quantitative proteomics. OMICS, 15(10), 705–717. [DOI] [PMC free article] [PubMed] [Google Scholar]
- Shirazi, J. , Shah, S. , Sagar, D. , Nonnemacher, M. R. , Wigdahl, B. , Khan, Z. K. , & Jain, P. (2013). Epigenetics, drugs of abuse, and the retroviral promoter. Journal of Neuroimmune Pharmacology, 8(5), 1181–1196. 10.1007/s11481-013-9508-y [DOI] [PMC free article] [PubMed] [Google Scholar]
- Silbermann, K. , Schneider, G. , & Grassmann, R. (2008). Stimulation of interleukin‐13 expression by human T‐cell leukemia virus type 1 oncoprotein Tax via a dually active promoter element responsive to NF‐kappaB and NFAT. The Journal of General Virology, 89(Pt 11), 2788–2798. [DOI] [PubMed] [Google Scholar]
- Teijaro, J. R. (2016). Type I interferons in viral control and immune regulation. Current Opinion in Virology, 16, 31–40. [DOI] [PMC free article] [PubMed] [Google Scholar]
- Theodoraki, M. N. , Yerneni, S. S. , Hoffmann, T. K. , Gooding, W. E. , & Whiteside, T. L. (2018). Clinical significance of PD‐L1(+) exosomes in plasma of head and neck cancer patients. Clinical Cancer Research, 24(4), 896–905. [DOI] [PMC free article] [PubMed] [Google Scholar]
- Tran, T. H. , El Baz, R. , Cuconati, A. , Arthos, J. , Jain, P. , & Khan, Z. K. (2011). A novel high‐throughput screening assay to identify inhibitors of HIV‐1 gp120 protein interaction with DC‐SIGN, Journal of Antivirals & Antiretrovirals, 3, 49–54. [DOI] [PMC free article] [PubMed] [Google Scholar]
- Tropical Spastic Paraparesis Information Page [Internet]. NIH . (2019). Available from: https://www.ninds.nih.gov/Disorders/All‐Disorders/Tropical‐Spastic‐Paraparesis‐Information‐Page
- Tsutsumi, S. , Sato, T. , Yagishita, N. , Yamauchi, J. , Araya, N. , Hasegawa, D. , Nagasaka, M. , Coler‐Reilly, A. L. G. , Inoue, E. , Takata, A. , & Yamano, Y. (2019). Real‐world clinical course of HTLV‐1‐associated myelopathy/tropical spastic paraparesis (HAM/TSP) in Japan. Orphanet Journal of Rare Diseases, 14(1), 227. 10.1186/s13023-019-1212-4 [DOI] [PMC free article] [PubMed] [Google Scholar]
- Vatter, P. , A, F. , Cioffi, M. , Hanna, S. J. , Castarede, I. , Caielli, S. , Pascual, V. , Matei, I. , & Lyden, D. (2021). Extracellular vesicle– and particle‐mediated communication shapes innate and adaptive immune responses. Journal of Experimental Medicine, 218(8), 20202579. 10.1084/jem.20202579 [DOI] [PMC free article] [PubMed] [Google Scholar]
- Votteler, J. , & Sundquist, W. I. (2013). Virus budding and the ESCRT pathway. Cell Host Microbe, 14(3), 232–241. [DOI] [PMC free article] [PubMed] [Google Scholar]
- Wiegand, S. B. , Beggel, B. , Wranke, A. , Aliabadi, E. , Jaroszewicz, J. , Xu, C.‐J. , Li, Y. , Manns, M. P. , Lengauer, T. , Wedemeyer, H. , Kraft, A. R. M. , Falk, C. S. , & Cornberg, M. (2019). Soluble immune markers in the different phases of chronic hepatitis B virus infection. Scientific Reports, 9(1), 14118. 10.1038/s41598-019-50729-5 [DOI] [PMC free article] [PubMed] [Google Scholar]
- Willms, E. , Johansson, H. J. , Mäger, I. , Lee, Y. , Blomberg, K. E. M. , Sadik, M. , Alaarg, A. , Smith, C. I. E. , Lehtiö, J. , EL Andaloussi, S. , Wood, M. J. A. , & Vader, P. (2016). Cells release subpopulations of exosomes with distinct molecular and biological properties. Scientific Reports, 6(1), 22519. 10.1038/srep22519 [DOI] [PMC free article] [PubMed] [Google Scholar]
- 103. Wurm, T. , Wright, D. G. , Polakowski, N. , Mesnard, J. M. , & Lemasson, I. (2012). The HTLV‐1‐encoded protein HBZ directly inhibits the acetyl transferase activity of p300/CBP. Nucleic Acids Research, 40(13), 5910–5925. [DOI] [PMC free article] [PubMed] [Google Scholar]
- Yamano, Y. , Araya, N. , Sato, T. , Utsunomiya, A. , Azakami, K. , Hasegawa, D. , Izumi, T. , Fujita, H. , Aratani, S. , Yagishita, N. , Fujii, R. , Nishioka, K. , Jacobson, S. , & Nakajima, T. (2009). Abnormally high levels of virus‐infected IFN‐γ+CCR4+CD4+CD25+ T cells in a retrovirus‐associated neuroinflammatory disorder. PLoS ONE, 4(8), e6517. 10.1371/journal.pone.0006517 [DOI] [PMC free article] [PubMed] [Google Scholar]
- Yamano, Y. , & Coler‐Reilly, A. (2017). HTLV‐1 induces a Th1‐like state in CD4(+)CCR4(+) T cells that produces an inflammatory positive feedback loop via astrocytes in HAM/TSP. Journal of Neuroimmunology, 304, 51–55. [DOI] [PubMed] [Google Scholar]
- Yamano, Y. , & Sato, T. (2012). Clinical pathophysiology of human T‐lymphotropic virus‐type 1‐associated myelopathy/tropical spastic paraparesis. Frontiers in Microbiology, 3, 389. [DOI] [PMC free article] [PubMed] [Google Scholar]
- Yang, R. , Huang, H. , Cui, S. , Zhou, Y. , Zhang, T. , & Zhou, Y. (2020). IFN‐γ promoted exosomes from mesenchymal stem cells to attenuate colitis via miR‐125a and miR‐125b. Cell Death & Disease, 11(7), 603. [DOI] [PMC free article] [PubMed] [Google Scholar]
- Yang, Y. , Ye, Y. , Su, X. , He, J. , Bai, W. , & He, X. (2017). MSCs‐derived exosomes and neuroinflammation, neurogenesis and therapy of traumatic brain injury. Frontiers in Cellular Neuroscience, 11, 55. [DOI] [PMC free article] [PubMed] [Google Scholar]
- Yao, J. , Grant, C. , Harhaj, E. , Nonnemacher, M. , Alefantis, T. , Martin, J. , Jain, P. , & Wigdahl, B. (2006). Regulation of human T‐cell leukemia virus type 1 gene expression by Sp1 and Sp3 interaction with TRE‐1 repeat III. DNA and Cell Biology, 25(5), 262–276. 10.1089/dna.2006.25.262 [DOI] [PubMed] [Google Scholar]
- Yasuma, K. , Yasunaga, J. , Takemoto, K. , Sugata, K. , Mitobe, Y. , Takenouchi, N. , Nakagawa, M. , Suzuki, Y. , & Matsuoka, M. (2016). HTLV‐1 bZIP factor impairs anti‐viral immunity by inducing co‐inhibitory molecule, T Cell Immunoglobulin and ITIM Domain (TIGIT). PLOS Pathogens, 12(1), e1005372. 10.1371/journal.ppat.1005372 [DOI] [PMC free article] [PubMed] [Google Scholar]
- Zhuang, X. , Xiang, X. , Grizzle, W. , Sun, D. , Zhang, S. , Axtell, R. C. , Ju, S. , Mu, J. , Zhang, L. , Steinman, L. , Miller, D. , & Zhang, H.‐G. (2011). Treatment of brain inflammatory diseases by delivering exosome encapsulated anti‐inflammatory drugs from the nasal region to the brain. Molecular Therapy, 19(10), 1769–1779. 10.1038/mt.2011.164 [DOI] [PMC free article] [PubMed] [Google Scholar]
Associated Data
This section collects any data citations, data availability statements, or supplementary materials included in this article.
Supplementary Materials
Supplementary Table 1: Antibodies used for Western blotting.
Supplementary Table 2: Antibodies for Flowcytometry and Immunofluorescent imaging.
Supplementary Table 3: Primers used for qPCR.
Supporting Inforamtion