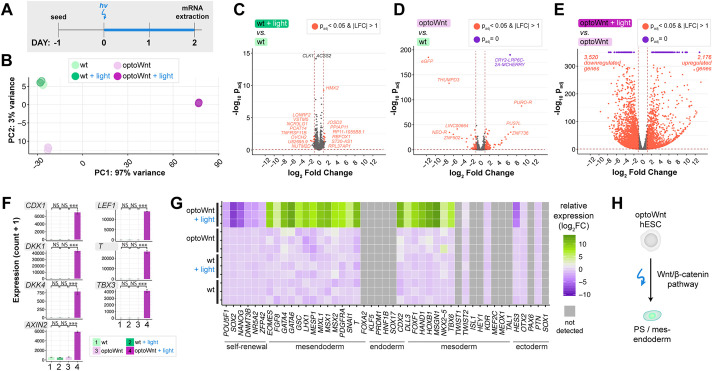
Fig. 2.
RNA-seq of optoWnt hESCs shows light-induced mesendoderm differentiation, low phototoxicity and low optoWnt dark-state activity. (A) Schematic of experimental timeline. Wild-type and optoWnt cells were kept in the dark or illuminated at 0.8 µWmm−2 for 48 h. (B) Principal component analysis (PCA) of RNA-seq results. Colors indicate the four experimental conditions. Each point is a biological replicate. (C-E) Volcano plots of RNA-seq differential expression analysis, with DEGs (adjusted P-value <0.05 and log2 fold change >1) in red and DEGs saturated at P=0 in purple. (C) Illuminated WT versus unilluminated WT hESCs (phototoxicity control); (D) unilluminated optoWnt versus unilluminated WT hESCs (dark-state activity control); (E) illuminated optoWnt versus unilluminated optoWnt hESCs. (F) β-Catenin target gene expression. ANOVA followed by Tukey's test. Graphs show mean expression (read counts+1)±s.d., n=3 biological replicates. (G) Heat map of log2 fold change in lineage markers normalized to unilluminated WT hESC expression level. Biological replicates displayed for each condition, with undetected genes (read count<150) shown in gray. (H) Schematic of light-induced mesendoderm differentiation.

