Fig. 3.
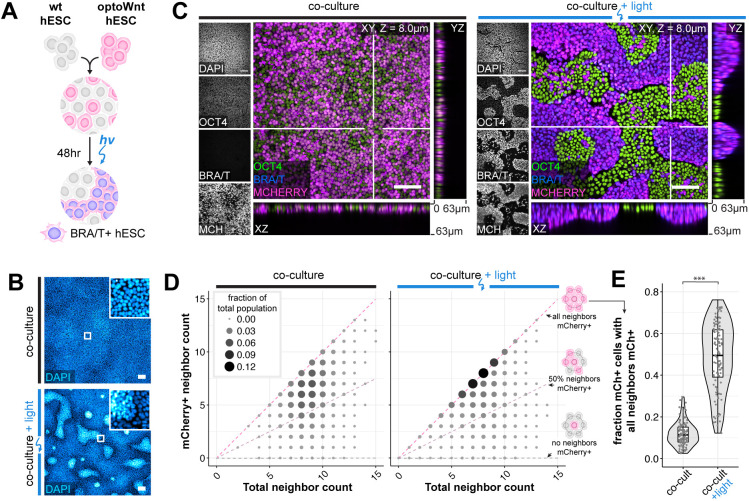
Cell self-organization upon optoWnt stimulation of cell subpopulations. (A) Schematic of experimental setup of optoWnt/WT hESC co-cultures. (B) Representative images of fixed optoWnt/WT co-cultures in the dark (top) and after 48 h of illumination (bottom) stained with DAPI. Scale bars: 100 µm. (C) Confocal images of optoWnt/WT co-cultures in the dark (left) and after 48 h illumination (right), stained for OCT4 and brachyury. OptoWnt cells are labelled with mCherry (mCh) expression. Scale bars: 100 µm. yz and xz axial cross-sections shown through indicated slices (white lines), 63 µm in height. (D) Cell neighbor analysis of optoWnt (mCh+) cells in co-cultures kept in the dark (left) or illuminated for 48 h (right). Graph shows the count of total cell neighbors versus the count of mCh+ cell neighbors across the total population of analyzed mCh+ cells (95,685 cells analyzed, pooled analysis from n=3 biological replicates). Area and color of points is proportional to the fraction of total population. Constant ratios of mCh+ to total neighbors are highlighted with pink and gray lines. (E) Quantification of the fraction of optoWnt (mCh+) cells whose neighbors are all mCh+. Each point represents an analyzed field of view (108 fields of view analyzed, n=3 biological replicates). Unpaired two-sample Wilcoxon test (***P<2.2×10⁻¹⁶). Box plots extend from 25th to 75th percentile; horizontal lines represent median; whiskers represent 1.5× interquartile range. The width of the shaded area (violin plot) represents the data density.

