

A novel 3D reaction–diffusion model of gas transport during C4photosynthesis revealed that the movement of mesophyll chloroplasts increased rate of photosynthesis at the cost of increased leakiness.
Keywords: Biophysical model, chloroplast movement, CO2 concentrating mechanism, gas exchange, leakiness, ray tracing, 3D leaf anatomy
Abstract
Chloroplasts movement within mesophyll cells in C4 plants is hypothesized to enhance the CO2 concentrating mechanism, but this is difficult to verify experimentally. A three-dimensional (3D) leaf model can help analyse how chloroplast movement influences the operation of the CO2 concentrating mechanism. The first volumetric reaction–diffusion model of C4 photosynthesis that incorporates detailed 3D leaf anatomy, light propagation, ATP and NADPH production, and CO2, O2 and bicarbonate concentration driven by diffusional and assimilation/emission processes was developed. It was implemented for maize leaves to simulate various chloroplast movement scenarios within mesophyll cells: the movement of all mesophyll chloroplasts towards bundle sheath cells (aggregative movement) and movement of only those of interveinal mesophyll cells towards bundle sheath cells (avoidance movement). Light absorbed by bundle sheath chloroplasts relative to mesophyll chloroplasts increased in both cases. Avoidance movement decreased light absorption by mesophyll chloroplasts considerably. Consequently, total ATP and NADPH production and net photosynthetic rate increased for aggregative movement and decreased for avoidance movement compared with the default case of no chloroplast movement at high light intensities. Leakiness increased in both chloroplast movement scenarios due to the imbalance in energy production and demand in mesophyll and bundle sheath cells. These results suggest the need to design strategies for coordinated increases in electron transport and Rubisco activities for an efficient CO2 concentrating mechanism at very high light intensities.
Introduction
Photosynthesis in C4 plants is empowered by the CO2 concentrating mechanism (CCM) that enables a higher CO2 concentration in bundle sheath chloroplasts, allowing ribulose-1,5-bisphosphate carboxylase/oxygenase (Rubisco) to operate near a CO2 saturation level. During C4 photosynthesis, the CO2 that diffuses from the intercellular air spaces (IAS) to the mesophyll cytosol is hydrated to bicarbonate, which reacts with phosphoenolpyruvate (PEP) in the presence of phosphoenolpyruvate carboxylase (PEPC) to form C4 acids. The C4 acids diffuse to bundle sheath cells and are decarboxylated to release CO2 for fixation by Rubisco in bundle sheath chloroplasts (Furbank and Hatch, 1987; Furbank, 2011). The affinity of PEPC for bicarbonate is much higher than that of Rubisco for CO2, and the PEP carboxylation is much faster than RuBP carboxylation by Rubisco. This increases the CO2 concentration in bundle sheath chloroplasts, which supercharges the catalytic sites of Rubisco, reduces photorespiration, and thus enhances the photosynthetic rate (Kanai and Edwards, 1999). An efficient operation of the CCM requires the coordinated functioning of mesophyll and bundle sheath cells (Pengelly et al., 2010; Kromdijk et al., 2010, 2014; Sun et al., 2012, 2014; Bellasio and Lundgren, 2016) as the CCM is more costly in ATP to regenerate PEP in mesophyll cells. The concentric arrangement of mesophyll, bundle sheath, and vasculature, the relative size of mesophyll and bundle sheath cells, and chloroplast abundance and distribution impact the light harvesting potential of bundle sheath cells (Evans et al., 2007; Stata et al., 2014; Bellasio and Lundgren, 2016) influencing the operation of the CCM.
Mesophyll chloroplasts of C4 plants are randomly distributed along the cell walls while those of bundle sheath cells are typically close to mesophyll cells (centrifugal location), which is an arrangement common in the classical NADP-ME subtype of C4 plants that includes major C4 crops (Dengler and Nelson, 1999). Upon exposure to high light for several hours or at extremely high light intensity at midday, mesophyll chloroplasts of finger millet (Eleusine coracana, a NAD-ME species) exhibited movement towards bundle sheath cells (referred to as aggregative movement) (Maai et al., 2020a). Under similar conditions, mesophyll chloroplast of NADP-ME species, like sorghum and maize, aligned between veins, along the sides of anticlinal walls, and parallel to the direction of light to allow light to pass through (referred to as avoidance movement) (Yamada et al., 2009; Maai et al., 2020b). When exposed to blue light after dark adaptation for several hours, mesophyll chloroplasts of maize and sorghum showed aggregative movement (Ryu et al., 2014). In addition, the aggregative movement has recently been shown to occur in a number of other C4 plants (Kato et al., 2022). Unlike mesophyll chloroplasts, the intracellular arrangement of bundle sheath chloroplasts was unaffected in finger millet, maize, or sorghum (Taniguchi et al., 2003; Yamada et al., 2009; Maai et al., 2020a).
C4 crops experience high light for a prolonged time in their natural environment, especially at the top of the canopy, which may compromise yield (Anderson et al., 2021; Wang et al., 2022). Given the variety of arrangements of mesophyll chloroplasts in response to high light intensity, it is important to understand what the consequences of each chloroplast configuration are for the leaf energetics and net photosynthetic rate (An). The analysis requires knowing the amount of light absorbed by mesophyll and bundle sheath chloroplasts to analyse the cell-specific ATP and NADPH demand and production, which are hard to measure but important parameters of C4 energetics (Bellasio and Lundgren, 2016; Yin and Struik, 2018). The CCM efficiency is quantified by leakiness (Φ), defined as the ratio of CO2 leakage flux from bundle sheath cells to the rate of PEP carboxylation (Kanai and Edwards, 1999; Yin and Struik, 2018).
Chloroplast movement in C3 plants in response to light and its effect on CO2 assimilation and productivity have been extensively investigated (Tholen et al., 2008; Wada, 2013; Gotoh et al., 2018). In C4 plants, chloroplast movement following short term changes in light quality in maize was proposed to result in better coordination between CO2 fixation in mesophyll and bundle sheath cells, and thus reduced Φ (Sun et al., 2014). The aggregative movement is assumed to boost photosynthesis through improved light penetration or by shortening the diffusion path of metabolites and re-fixation of leakage CO2 (Taniguchi et al., 2003; Yamada et al., 2009; Maai et al., 2011, 2020a; Taniguchi and Cousins, 2018). However, it was found that the extent of aggregative movement did not differ for different bundle sheath chloroplast positions and for the presence or absence of a suberin lamella in bundle sheath cells, factors that may affect CO2 leakage, its refixation and metabolite transport (Kato et al., 2022). By contrast, the avoidance movement, which is associated with photoprotection of mesophyll chloroplasts in sorghum, may decrease An (Maai et al., 2020b).
The effect of chloroplast movement on the energetics of C4 plants and photosynthetic rate can be analysed in a controlled manner using modeling due to otherwise simultaneous changes in leaf biochemistry, stomatal conductance, and anatomy of C4 plants upon exposure to high light stress (Maai et al., 2020b; Anderson et al., 2021). C4 leaf energetics were recently examined using biochemical models and flux balance analysis (Bellasio and Lundgren, 2016; Bellasio, 2017; Yin and Struik, 2018, 2021; Bellasio and Farquhar, 2019). Some of these studies (Bellasio and Lundgren, 2016; Yin and Struik, 2018) accounted for the effect of leaf anatomy on light propagation indirectly using the Beer–Lambert law (Bellasio and Lundgren, 2016; Yin and Struik, 2018). The light propagation was modeled using the meshed Monte Carlo method, which, unlike the classical Monte Carlo method for photon transport, uses tetrahedral meshes for better representation of the structural intricacies of biological tissues (Watté et al., 2015; Ho et al., 2016). Reaction–diffusion (R-D) models of CO2 transport account for the effect of leaf anatomy on light and CO2 distribution directly (Berghuijs et al., 2016). R-D models were applied to analyse gas exchange during photosynthesis using two-dimensional (2D) (Ho et al., 2012; Retta et al., 2016a; Berghuijs et al., 2019) or three-dimensional (3D) (Tholen and Zhu, 2011; Ho et al., 2016; Wang et al., 2017; Xiao et al., 2023) leaf anatomy. However, 3D R-D models provide the capacity for more accurate and mechanistic analysis of CO2 and light propagation as emphasized recently (Earles et al., 2019). Exploring the influence of a 3D arrangement of mesophyll and bundle sheath chloroplasts on photosynthesis requires a realistic 3D geometry at tissue level for accurate modeling of light propagation and diffusion of gases for the irregular geometry of the IASs (Ho et al., 2016; Xiao et al., 2016; Théroux-Rancourt et al., 2017; Earles et al., 2019). Yet the application of such models to C4 photosynthesis has received less attention than for C3 plants.
To quantify the effect of chloroplast movement on C4 energetics, photosynthesis, and CCM efficiency, we develop a 3D model of C4 photosynthesis consisting of a R-D model of gas exchange coupled with an ATP and NADPH production model (Yin and Struik, 2018) and a light propagation model (Watté et al., 2015) using a 3D representation of a real maize (Zea mays L.) leaf as a model system. We hypothesized that the aggregative movement of mesophyll chloroplasts improves photosynthesis through improved light propagation, increased energy production, and reduced leakiness. The avoidance movement of mesophyll chloroplasts is hypothesized to decrease photosynthetic rate at high light intensity.
Materials and methods
Plant sample, experiments, and reconstruction of the 3D leaf anatomy
The plant growth conditions, gas exchange, and chlorophyll fluorescence measurements were described in detail previously (Retta et al., 2016a). In brief, maize plants (hybrid 2-02R10074) were grown receiving contrasting nitrogen treatments. The growth conditions were ambient [CO2] of 380 µmol mol−1, relative humidity of 60–80%, temperature of 23 °C during the day and 16 °C during the night, and a photoperiod of 16 h. The response of net photosynthetic rate to CO2 and light were measured in four replicates. The light response curve was measured at an ambient CO2 level of 250 μmol mol−1 to promote photorespiratory conditions. We used these data for comparisons with the predicted responses of photosynthesis from the 3D C4 photosynthesis model developed here.
To reconstruct the 3D geometry (referred to as the ‘default’ geometry), plant tissues from the same set of maize plants measured for gas exchange and chlorophyll fluorescence as cited above were imaged using light microscopy (Olympus BX-51, at ×40 magnification). Sample preparation, fixation, and imaging were reported previously (Retta et al., 2016b). A total of 120 leaf sections at 1-µm intervals were cut using one leaf from a sample that was least affected by the sample processing (Supplementary Fig. S1A, B). The images were first aligned using the 3D image-processing software Avizo Fire (VSG, France). The images included three veins each surrounded by a layer of bundle sheath cells, each of which was surrounded by a single layer of mesophyll cells forming a repetitive concentric arrangement of bundle sheath and mesophyll cells (Supplementary Fig. S1A). Therefore, using the symmetry of the geometry, only one concentric arrangement of mesophyll and bundle sheath cells along with the epidermis and IAS was considered by cropping the images to a representative region of interest, resulting in 3D images having a pixel resolution of 0.67 µm.
The regions of mesophyll and bundle sheath cells, chloroplasts, epidermis, IAS, and vascular bundle (Supplementary Fig. S1A) were labelled semi-automatically. Deformations of the epidermis on some of the images (Supplementary Fig. S1A) and missing sections were corrected for by interpolating through the consecutive images in Avizo. The chloroplasts of mesophyll cells were identified clearly thanks to their random arrangement, while numerous clustered chloroplasts of bundle sheath cells were segmented as a layer of centrifugally (towards mesophyll cells) arranged chloroplasts. Other microstructural features such as mitochondria, cytosol, and vacuole could not be identified due to insufficient resolution and contrast. Thus, mitochondria were assumed to be uniformly distributed in the cytosol, and vacuoles were created in MATLAB (version 7, The MathWorks, Inc., Natick, MA, USA) assuming the vacuole occupies 60% of the cell volume and accounting for sufficient cytosol volume required for CO2 hydration (Taiz, 1992). Two stomata identified on the light microscopy images were digitized as cylindrical pores. Two additional stomatal pores were created assuming a stomatal ratio of 1.0 so that the stomatal index matches that reported for maize (Driscoll et al., 2006; Zheng et al., 2013). The anatomical properties measured from the 3D geometry were compared with those reported specifically for maize or broadly for NADP-ME C4 subtype plants.
Light propagation modeling and measurement of leaf optical properties
The propagation of light within the 3D geometry of maize leaf was modeled using a meshed Monte Carlo method (Watté et al., 2015). Optical properties of mesophyll and bundle sheath cells were computed based on the Mie scattering theory from the distribution of organelles in these cells (Supplementary Tables S2, S3) (Aernouts et al., 2014). The mean radius of organelles such as mitochondria, peroxisomes, nucleus, Golgi stack, and ribosome-like structures was calculated from the reported values of radius from the literature (Supplementary Tables S2). Using the mean radius and assuming spherical objects, a particle size distribution was calculated to estimate the number of organelles per unit volume. The latter was used to calculate the bulk scattering coefficients and anisotropy factor of cell media that were contributed by the optical properties of cell components such as mitochondria, peroxisomes, nucleus, Golgi stack, and ribosome-like structures (Supplementary Table S3). The scattering coefficient of chloroplasts was calculated from that of the grana. The thickness of the cell wall in our model was 160–190 nm, which is much less than the wavelength of light at which the Mie scattering theory is valid. Thus, the cell wall was not explicitly modeled but its scattering effect was accounted for by lumping the scattering coefficient of cell wall with that of the chloroplasts.
Absorption coefficents of the mesophyll and bundle sheath chloroplasts were calculated from the chlorophyll content of the leaf (Supplementary Table S3). The leaf chlorophyll content was assumed to be 539 µmol m−2, which is an average values of 501 µmol m−2 for maize having high nitrogen content and 579 µmol m−2, the maximum value reported for the NADP-ME subtype, for sorghum (Ghannoum et al., 2005). The content of chlorophyll in bundle sheath cells can varry from 33% to 75% of the leaf chlorophyll content (Ghannoum et al., 2005; Bellasio and Lundgren, 2016). It was assumed that the chlorophyll distribution was 50% in mesophyll and 50% in bundle sheath chloroplasts. The absorption coefficient of the epidermis, vacuole, and cytosol was set at 100 m−1 (Ho et al., 2016).
The propagation of blue light (470 nm) and red light (665 nm) was modeled separately by assuming the illumination to be distributed uniformly over the top surface of the leaf. The resulting absorption profiles for red and blue light were combined with weighting fractions of 10% blue and 90% red (corresponding to the light source used during the gas exchange measurements) to derive an overall light absorption profile (Supplementary Table S3). The resulting light profile was then used to compute the potential rate of local electron transport and ATP and NADPH production in the mesophyll and bundle sheath chloroplasts (see ‘ATP and NADPH production model’ below).
To validate the light propagation model, light reflectance and transmittance were measured with the integrating spheres set-up elaborated by Aernouts et al. (2014), which was used previously by Ho et al. (2016). For light reflectance and transmission measurements, a different set of maize plants from another cultivar (cultivar P8057) were used as the measurement was not carried out at the same time as the gas exchange measurement. The plants were grown in a greenhouse at the facilities of Wageningen University & Research, The Netherlands. The set point for relative humidity during growth was 70% and that for temperature was 27 °C during the day and 22 °C during the night. The photoperiod was 12 h. These conditions were like the ones used to grow the maize plants for which the earlier-mentioned gas exchange data were acquired. In addition, cultivar P8057 received a total of N, P, K, and Mg of 1020, 710, 1630, and more than 160 mg per pot, respectively. Hybrid 2-02R10074A received 500 mg—1250 mg N per pot while total P, K, and Mg were 330, 1250, and 500 mg per pot, respectively (Retta et al., 2016a). Therefore, the nitrogen applications, which influence chlorophyll content, were similar. The leaf thickness of a few randomly selected leaves was 200 ± 50 μm. Similarly, leaf thickness of hybrid 2-02R10074A ranged from 208 to 237 μm for the range of nitrogen treatments the cultivar received (Retta et al., 2016b).
Reflectance and transmittance were measured from four plants using 2-mm samples from the mid-position of the maize leaves. The samples were placed between two integrating spheres and illuminated with a super continuum laser-based tunable light source to measure the total reflectance and transmittance in the wavelength range from 550 nm to 850 nm at 5 nm intervals. The measured total reflectance and transmittance were then compared with those computed with the light propagation model.
Microscale gas exchange model
The microscale model for gas exchange of a C4 plant leaf was developed in analogy to the 3D R-D model for C3 leaves presented by Ho et al. (2016), and by extending a 2D R-D model of gas exchange of a C4 leaf (Retta et al., 2016a). From the biochemical model of C4 photosynthesis (von Caemmerer and Furbank, 1999; Yin et al., 2009; Yin and Struik, 2009), we developed the equations to account for 3D fluxes of CO2, bicarbonate, and O2 within the maize leaf and the rates of the associated processes. CO2 diffusion through the stomata was modeled by adjusting the effective diffusivity of CO2 through the stomatal pores to match the measured stomatal conductance without artificially changing stomatal geometry (Supplementary Fig. S2). Due to uncertainties of combining detailed metabolite pool concentrations with inhibition of enzyme activity by end-products, the inter-cell-type transport was assumed to be in a steady state and non-limiting in our model, as were the gas exchange measurements. Parameters of the 3D model are given in Table 1. Symbols, definitions, and units of the physical properties and photosynthetic parameters are given in Supplementary Table S1.
Table 1.
Values of parameters used in the 3D model
| Name | Symbol | Component | Value | Unit | References and notes |
|---|---|---|---|---|---|
| Diffusion coefficient of CO2 | Cell media | 1.89 × 10⁻⁹/η | m2 s−1 | Effective diffusivity (Frank et al., 1996; Lide, 1999; Juurola et al., 2005) | |
| IAS | 1.57 × 10⁻⁵ | m2 s−1 | |||
| Cell wall | 1.89 × 10⁻⁹ζ/η | m2 s−1 | |||
| Diffusion coefficient of O2 | Cell media | 1.97 × 10⁻⁹/η | m2 s−1 | At 25 °C (Denny, 1993) | |
| IAS | 2.10 × 10⁻⁵ | m2 s−1 | |||
| Cell wall | 1.97 × 10⁻⁹ζ/η | m2 s−1 | |||
| Diffusion coefficient of HCO3– | Cell media | 1.17 × 10⁻⁹/η | m2 s−1 | Diffusion coefficient of bicarbonate in pure water at 25 °C (Geers and Gros, 2000) | |
| Average thickness | d | Leaf tissue | 165 | µm | Measured from the 3D geometry |
| Fraction of e− flux that follows the Q cycle | Chloroplast | 1 | Unitless | Yin and Struik (2012) | |
| Number of H+ per mol ATP | h | Chloroplast | 4 | Unitless | Yin and Struik (2012) |
| Proton concentration | Cell media | 10–pH | mol m−3 | pH: 7.5 cytosol, 7.8 for chloroplast, 7.0 for vascular bundles, 4.0 for the vacuole (Evans et al., 2009) | |
| Henry’s constant for CO2 | Cell media | 0.83 | Unitless | At 25 °C (Lide, 1999) | |
| Henry’s constant for O2 | Cell media | 3.2× | Unitless | At 25 °C (Lide, 1999) | |
| Light-saturated rate of e− transport | Mesophyll chloroplast | 138.43 ± 5.8 | µmol m−2 s−1 | Estimated | |
| Bundle sheath chloroplast | 64.01 ± 5.8 | µmol m−2 s−1 | Estimated | ||
| Acid dissociation constant for H2CO3 | K | Cell media | 0.2 | mol l−1 | Jolly (1985), Ho et al. (2016) |
| Michaelis Menten constants of CA hydration | Mesophyll cytosol | 2.8 | mol m−3 | Hatch and Burnell (1990) | |
| Equilibrium constant for CA dehydration | Mesophyll cytosol | 5.6× | mol m−3 | Jolly (1985), Ho et al. (2016) | |
| Michaelis–Menten constant of PEPC for bicarbonate | Mesophyll cytosol | 2× | mol m−3 | Bauwe (1986), Ho et al. (2016) | |
| Michaelis–Menten constants of CA dehydration | Mesophyll cytosol | 34 | mol m−3 | Pocker and Miksch (1978) | |
| Michaelis–Menten constants of Rubisco for CO2 | Bundle sheath chloroplast | 485 | µbar | Cousins et al. (2010) | |
| Michaelis–Menten constants of Rubisco for O2 | Bundle sheath chloroplast | 146 | mbar | Cousins et al. (2010) | |
| CO2 hydration rate constant | k 1 | Cell media | 3.9× | s−1 | Jolly (1985), Ho et al. (2016) |
| CO2 dehydration rate constant | k 2 | Cell media | 23 | s−1 | Jolly (1985), Ho et al. (2016) |
| Permeability to CO2 of membranes | Bundle sheath | 3.5 × 10⁻³ | m s−1 | Gutknecht et al. (1977) | |
| Chloroplast | 1.75 × 10⁻³ | m s−1 | Half the membrane permeability | ||
| Mesophyll | 1.6 × 10⁻² | m s−1 | Missner et al. (2008), assuming mesophyll plasma membrane is enriched with co-porins | ||
| Permeability to O2 of membranes | Chloroplast | 1.25 × 10⁻² | m s−1 | Ho et al. (2011), value halved for chloroplast envelope | |
| Mesophyll and bundle sheath | 2.5 × 10⁻² | m s−1 | |||
| Rate of day respiration | Cell media | 1.70 ± 0.27 | µmol m−2 s−1 | Retta et al. (2016b) | |
| Rubisco specificity | Bundle sheath chloroplast | 2862 | Unitless | Cousins et al. (2010) | |
| Lumped calibration factor | sʹ | Bundle sheath chloroplast | 0.325 ± 0.004 | Unitless | Retta et al. (2016b) |
| Thickness of a component | t | Mesophyll cell wall Bundle sheath cell wall Plasmodesma |
0.188 0.161 0.354 |
µm |
Retta et al. (2016b), measured from electron microscopy images. Sum of cell wall thickness of mesophyll and bundle sheath |
| Maximum catalytic activity of CA | Mesophyll cytosol | 2.1 × 10⁵ | µmol m−3 s−1 | Pocker and Miksch (1978), Wang et al. (2014) | |
| Maximum rate of Rubisco carboxylation | Bundle sheath chloroplast | 78.5 | µmol m−2 s−1 | Retta et al. (2016b) | |
| Maximum rate of PEP carboxylase | Mesophyll cytosol | 183 | µmol m−2 s−1 | Retta et al. (2016b) | |
| Fraction of ATP allocated to the C4 cycle | x | Mesophyll chloroplast | 0.40 | unitless | von Caemmerer and Furbank (1999) |
| Electron transport efficiency under limiting light for PSI | Chloroplast | 0.94 | mol mol−1 | Yin and Struik (2012), on the basis of light absorbed by PSI | |
| Electron transport efficiency under limiting light for PSII | Chloroplast | 0.83 | mol mol−1 | Yin and Struik (2012), on the basis of light absorbed by PSI | |
| Convexity index | Chloroplast | 0.97 | Unitless | Assumed at the chloroplast level | |
| Effective porosity | Mesophyll cell wall Bundle sheath cell wall Mesophyll–bundle sheath interface |
0.5 0.1 3 × 10⁻² |
Unitless | Evans (2021), the fraction of bundle sheath surface area occupied by plasmodesmata (Sowiński et al., 2008) | |
| Relative viscosity | η | Cell media | 2 | Unitless | Assumed |
Biochemical model of C4 photosynthesis and hydration rates
The gross volumetric rate of CO2 fixation in bundle sheath chloroplasts, , is given by the minimum of Rubisco-limited carboxylation rate (first term in brackets in Eq. 1), and electron-transport-limited carboxylation rate (second term in brackets in Eq. 1) based on ATP supply according to the biochemical model of C4 photosynthesis (von Caemmerer and Furbank, 1999; Yin and Struik, 2012):
| (1) |
where Km,C and Km,O are Michaelis–Menten constants of Rubisco for CO2 and O2, respectively; γ* = 0.5/SC/O, where SC/O is the relative CO2/O2 specificity factor of Rubisco; is the volumetric rate of maximum capacity of Rubisco carboxylation (calculated using Eq. 13); and is the volumetric potential rate of ATP used for C3 cycle calculated by assuming 60% of the total ATP production ( Eq. 24) is allocated to the C3 cycle (von Caemmerer and Furbank, 1999). [CO2] and [O2] are the concentrations of CO2 and O2 in the bundle sheath chloroplasts, respectively.
The volumetric rate of PEP carboxylation () is given as a minimum of the enzyme-limited rate (first term in brackets in Eq. 2) and the electron-transport-limited rate of PEP carboxylation (second term in brackets in Eq. 2) (von Caemmerer and Furbank, 1999; Yin and Struik, 2012; Boyd et al., 2015):
| (2) |
where Kh is the Michaelis–Menten constant of PEPC for bicarbonate and is the maximum catalytic rate of PEPC (calculated using Eq. 13).The volumetric rate of ATP used for the C4 cycle in mesophyll cells, , was calculated by assuming 40% of the total ATP production (Eq. 24) is allocated to the C4 cycle (von Caemmerer and Furbank, 1999).
The net hydration of CO2 in the presence of CA, , is given by (Spalding and Portis, 1985; Tholen and Zhu, 2011):
| (3) |
where is the maximum catalytic activity of CA per unit leaf volume; is the concentration of bicarbonate ions; and are the Michaelis–Menten constants of CA hydration and dehydration, respectively; is the equilibrium constant for CA; and [H+] is the concentration of ions.
Since bundle sheath cells of maize contain little CA, it is assumed that hydration of CO2 proceeds non-enzymatically in these cells (Burnell & Hatch, 1988). The net non-enzymatic hydration rate of CO2 per unit leaf volume, BNCA, is given by (Ho et al., 2016):
| (4) |
where k1 is the CO2 hydration rate constant; k2 is the CO2 dehydration rate constant; K is the acid dissociation constant for H2CO3; and [H+] is calculated from the pH of the cell compartments such as chloroplast stroma and cytosol. Equation 4 is assumed valid everywhere in the liquid phase.
CO2 transport inside a C4 leaf
The R-D equation for CO2 transport at steady-state is:
| (5) |
where is the gradient operator; is the diffusivity of CO2 in either liquid (cells) or IAS; G stands for source or sink terms in each cell component; is the volumetric rate of CO2 release through respiration in the cytosol of mesophyll and bundle sheath cells, epidermis and vascular bundles (Eqs 8, 9); is the volumetric rate of net photosynthesis which includes CO2 fixation in bundle sheath chloroplasts (Eq. 1) and CO2 release by respiration (Eq. 9) and photorespiration in bundle sheath cytosol (Eq. 10); and is the average (indicated by the over score) rate of CO2 production through decarboxylation of C4 acids in the bundle sheath chloroplasts per unit leaf volume (Eq. 11). As in the standard C4 photosynthesis model (von Caemmerer and Furbank, 1999), we assume, the rate of decarboxylation is equal to the rate of PEP carboxylation, so the same symbol, , is used.
The diffusion of bicarbonate ions in epidermis, mesophyll cells, vasculature, or bundle sheath cells is collectively given by (Retta et al., 2016a):
| (6) |
where is the diffusivity of bicarbonate in the respective cell compartments. BCA and is applied only to the mesophyll cytosol (Eqs 2, 3).
O2 transport inside a C4 leaf
The steady state R-D equation for O2 transport is given by:
| (7) |
where is the diffusivity of O2; is the volumetric rate of oxygen production by chloroplasts of mesophyll or bundle sheath cells and zero elsewhere; and is the total O2 consumption due to RuBP oxygenation during photorespiration in the bundle sheath chloroplast, and additional consumption of O2 (0.5 mol of O2 per RuBP oxygenation) by glycolate oxidase in peroxisomes in the photorespiratory cycle (Eq. 12) (Somerville, 2001). The rate of oxygen evolution, , associated with the linear electron transport in chloroplasts was set to be equal to a quarter of the rate of linear electron flux (Eq. 19), because the production of 1 mol of O2 is accompanied by the flow of four electrons.
Calculation of microscale model variables
Respiratory CO2 release is assumed to occur in the epidermis, cytosol of mesophyll and bundle sheath cells, and the phloem tissue in the vascular bundles. Rate of respiratory CO2 release in each of these components is calculated by assuming that the epidermis is as metabolically active as mesophyll, bundle sheath, or vascular bundles. Volumetric rate of respiratory CO2 release in the epidermis (EPI), , is given by:
| (8) |
where Rd is the rate of day respiration; fresp is the sum of volume fractions of vascular bundles, EPI, and cytosol of mesophyll and bundle sheath cells; and d is the average thickness of leaf tissue.
Volumetric rate of respiratory CO2 release in component i (mesophyll, bundle sheath, or vascular bundles), , is given by:
| (9) |
where fi is the volume fraction of a component i in the leaf tissue where the rate is applicable.
The volumetric rate of photorespiratory CO2 release in bundle sheath cytosol, , is given by:
| (10) |
where is given by Eq. 1; VBS,ch is the volume of bundle sheath chloroplast; and VBS,cy is the volume of the cytosol of bundle sheath. Volume of bundle sheath cytosol is calculated by
The average rate of CO2 production from decarboxylation of C4 acids, assumed to proceed at the same rate as PEP carboxylation (Eq. 2) in mesophyll cytosol (subscript M,cy) (von Caemmerer and Furbank, 1999), was calculated as:
| (11) |
where VBS,ch is the volume of bundle sheath chloroplast (subscript BS,ch) and VM,cy is the volume of mesophyll cytosol.
Consumption of 1 mol of O2 by photorespiration results in the release of 0.5 mol of CO2. In addition, 0.5 mol O2 is consumed per RuBP oxygenation by glycolate oxidase in peroxisomes in the photorespiratory cycle. Thus, the volumetric rate of oxygen consumption by photorespiration, , in a bundle sheath chloroplast is given by:
| (12) |
where the volume of bundle sheath chloroplast is calculated by .
Volumetric rates (marked with asterisk) of leaf area-based quantity Q such as Vc,max or Vp,max was calculated as:
| (13) |
where fi is the volume fraction of a component i (mesophyll cytosol or bundle sheath chloroplast) in the leaf tissue where the rate is applicable.
The rate of net photosynthesis was calculated by integrating the flux of CO2 over the outer epidermis surfaces. The computed photosynthesis, , is given as:
| (14) |
where Flux is a normal diffusive flux defined as ; n is the normal vector of unit length; SEPI is the epidermis surface; and Sleaf is a projected area of the leaf.
The rate of CO2 leakage, L is given by:
| (15) |
where is the mean rate of PEP carboxylation calculated from Eq. 2 and is the rate of CO2 release in mesophyll cytosol through respiration (Eq. 9).
The leakiness Φ is calculated as:
| (16) |
Calculation of fluxes and resistances to transport in boundaries
The flux of CO2, , and O2 at the boundary of cuticle, mesophyll, or bundle sheath cells is given by:
| (17) |
where y stands for CO2, O2, and ; Py is the permeability of cuticle, plasma membrane, chloroplast envelope, cell wall (CO2 and O2) or the mesophyll–bundle sheath interface to y; and is the difference in concentration of y across each boundary.
P y is given by:
| (18) |
where Dy is the diffusion coefficient of y in a cell component; is the effective porosity; and t is the thickness of diffusion path. For the plasmodesmata, Dy is assumed equal to that in the cytosol; is the ratio of the bundle sheath surface area covered by plasmodesmata to the total surface area of bundle sheath; and t is the length of the plasmodesmata. At the outer tangential cell wall of bundle sheath cells of maize, a suberin lamella is deposited (Hattersley and Browning, 1981). We assume that gas exchange occurs only through plasmodesmata at the mesophyll–bundle sheath interface. Thus, an insulated boundary condition was assumed at the surface of the bundle sheath cells exposed to the IAS.
ATP and NADPH production model
The ATP production was modeled to be driven by local light intensity at the level of the chloroplast using the light profile of the 3D geometry. The model of ATP production is explained in detail by Yin and Struik (2018). The model for electron transport and ATP production aimed to ensure that the ATP and NADPH requirements of C4 and C3 cycles were met at the whole-leaf level. A brief description of the model with selected equations relevant for this study is given below.
The volumetric rate of linear electron transport (LET) in mesophyll or bundle sheath chloroplasts, is given by a commonly used non-rectangular hyperbolic model (Farquhar and Wong, 1984; Yin et al., 2006):
| (19) |
where i refers to either mesophyll or bundle sheath chloroplasts; is the photochemical efficiency of linear electron transport of photosystem II (PSII) under limiting light (LL) (based on light absorbed by both photosystems) when cyclic electron transport (CET) occurs simultaneously; is the rate of photon absorption by mesophyll or bundle sheath chloroplasts per unit leaf volume, calculated by the product of actinic irradiance (Iinc) and the fraction of that irradiance absorbed by the chloroplasts in these cells expressed per volume; is the maximum volumetric electron transport rate under saturating illumination (calculated using Eq. 13); and θ is the convexity index.
is calculated as (Yin et al., 2006):
| (20) |
where and are the electron transport efficiencies under limiting light for photosystem I (PSI) and PSII, respectively (unitless, on the basis of light absorbed by each photosystem). is the fraction of CET in mesophyll or bundle sheath chloroplasts given by:
| (21) |
where is the light-limited rate of CET, and is the light-limited rate of LET in either mesophyll or bundle sheath.
and are calculated as (Yin and Struik, 2012):
| (22) |
| (23) |
where ui is the fraction of light for LET in mesophyll or bundle sheath chloroplasts, which were calculated according to (Yin and Struik, 2018).
The total ATP production is the sum of ATP production in mesophyll and in bundle sheath chloroplasts. The ATP production rate per leaf area basis in mesophyll or bundle sheath chloroplasts, , can be formulated as a function of PSII LET flux as (Yin and Struik, 2012):
| (24) |
where h is the number of H+ ions required to synthesize 1 ATP; is the fraction of the electron flux that follows the Q cycle (Yin and Struik, 2012); and is the area of a cross section of the computational domain. So, the term represents the volumetrically integrated rate of LET per leaf area basis.
The rate of whole-leaf total ATP production calculated from chlorophyll fluorescence (CF) data, jATP,CF, was given by (Yin et al., 2011):
| (25) |
where sʹ is the lumped calibration factor; Fs is the steady-state relative fluorescence yield; Fʹm is the maximum relative fluorescence yield in the leaf; and x is the fraction of ATP allocated to the C4 cycle. For this calculation, a constant x of 0.40, which is shown to be an optimal distribution for high photosynthesis, for all irradiances was assumed (von Caemmerer and Furbank, 1999; Yin et al., 2011; Yin and Struik, 2012). This value changes at low light intensity (Kromdijk et al., 2010). However, accounting for such change requires a detailed description of the kinetics of photosynthesis and exchange of metabolites, which is beyond the scope of our study (Bellasio, 2017).
The potential ATP production rate () computed for the whole leaf level is given by:
| (26) |
where Sleaf is the area of a cross section of the computational domain; j*ATP is the local volumetric rate of ATP production determined from Eq. 24; and Vleaf is the total leaf volume.
The light saturated electron transport rates in mesophyll and bundle sheath cells, and (Eq. 19), were fitted by minimizing the difference between the respective ATP production rate determined from chlorophyll fluorescence measurement (Eq. 25) and that modeled from the potential electron transport rate at the whole leaf level (Eq. 26). To avoid overfitting, it was assumed that:
| (27) |
where or is given by Eq. 20; is the absorbed irradiance by bundle sheath chloroplasts; and is the absorbed irradiance by mesophyll chloroplasts.
The rate of NADPH production per leaf area in mesophyll or bundle sheath chloroplasts, , is given by:
| (28) |
where 0.5 refers to 0.5 mol NADPH produced per mol electrons transferred by LET.
The fraction ATP in bundle sheath cells () is calculated as:
| (29) |
where and are given by Eq. 24.
The fraction of NADPH in bundle sheath cells () is calculated as:
| (30) |
where and are given by Eq. 28.
Modeling chloroplast arrangement
The chloroplast arrangements were modeled based on microscopic images of chloroplast movement for maize reported previously (Yamada et al., 2009; Maai et al., 2020b) assuming the vacuole allows free movement of chloroplasts. From the default geometry (Supplementary Fig. S1C), two leaf geometries were developed to simulate the aggregative movement and the avoidance movement of mesophyll chloroplasts (Supplementary Fig. S2D, E). The key morphological operations in MATLAB software (R2017b) used to model chloroplast arrangements were ‘dilation’, which adds pixels to the boundary of a domain, and ‘erosion’, which removes pixels from the boundary of a domain. The domain of bundle sheath cells of the default anatomy (Supplementary Fig. S2C) was dilated to intersect the domain of mesophyll cells in contact with the bundle sheath cells to model the aggregative movement of mesophyll chloroplasts (Supplementary Fig. S2D). The domain created as the result of the intersection was considered as the chloroplast domain (Supplementary Fig. S2D) after it was eroded in MATLAB and the volume fraction of chloroplasts per cell matched reasonably well with that of the default geometry (Supplementary Fig. S3). To model the avoidance movement of mesophyll chloroplasts (Supplementary Fig. S2E), a chloroplast layer was similarly made but only for those mesophyll cells lying between veins.
3D leaf anatomy, chloroplast arrangement, and ATP and NADPH production
The 3D model of light propagation was coupled to the model of ATP and NADPH production (Eqs 19–24, 28) to determine the total ATP and NADPH production. The total ATP was partitioned between C3 and C4 cells at cell level. Forty percent of the total produced ATP (Eq. 24) was assumed to be used for the C4 cycle (von Caemmerer and Furbank, 1999). Then, the gas transport models (Eqs 5–7) were solved using the 3D structure for various chloroplast arrangement scenarios. The responses of An (Eq. 14) to Iinc and to intercellular CO2 (Ci) were computed and compared with those obtained from the gas exchange measurement. The fractions of CET in bundle sheath cells (Eq. 21) and the fraction of ATP and NADPH production in bundle sheath chloroplasts (Eqs 29–30) calculated from the default geometry were compared with cases of chloroplast arrangement.
Comparison of a 2D and a 3D model of gas transport
Three 2D slices from the 3D geometry were taken from the positions 30, 60, and 90 of 120 slices to directly compare the differences in modeled photosynthesis on the same leaf using the same R-D approach between the simpler 2D geometry and the corresponding 3D geometry (Supplementary Fig. S4). The light absorption profile and the mean ATP production rate were set equivalent to those of the 3D geometry at the positions where the slices were made. Following Retta et al. (2016a), we assumed that the concentration of CO2 in the IAS was uniform for the 2D model. Therefore, the gas concentrations at the exposed surface of mesophyll were set equal to the mean concentrations in IAS of the 3D model. Retta et al. (2016a) also assumed that the diffusion coefficients of CO2 and bicarbonate were equal to those of pure water in order to improve the match between the measured and simulated gas exchange data. Thus, we also solved the 2D model from slice 60 with these assumptions so that the relative viscosity of the cell cytosol (η) was assumed to be 1.0 or 2.0, where the latter value is assumed closest to the biological medium. All other parameter values were kept the same as the ones reported in Table 1. The response of An to Ci was computed for the 2D model (for various assumption of η) and compared with the results obtained from the 3D model.
Numerical solution
A 3D leaf tissue of 124 × 124 × 200 µm was represented by 9.428106 cube elements with a length of 0.67 µm. The lateral sides of this geometry were assumed to have no net flux, while external concentrations of CO2 and O2 were assumed at the adaxial and abaxial sides. The R-D equations were discretized over the finite volume grid and the resulting linear systems of algebraic equations of the unknown concentrations at the volume nodes were solved by the preconditioned conjugate gradient procedure in MATLAB using the finite volume method (Versteeg and Malalasekera, 1995; Ho et al., 2016). We used a 16-GB RAM node of the high-performance computer in the VSC-Flemish Supercomputer Center (Belgium) to run the model. The computation time was 72 h.
Results
The 3D leaf structure impacts gas transport and light absorbance
The 3D geometry (Fig. 1A) consisted of the epidermis, stomata, IAS, mesophyll cells, bundle sheath cells and vasculature, as main components of the maize leaf anatomy. Leaf anatomical characteristics measured from this geometry were compared with literature values (Table 2). The anatomical features such as exposed surface area of mesophyll per leaf area, surface area of bundle sheath cells per leaf area, surface to volume ratio of mesophyll and bundle sheath cells and volume fraction of chloroplasts in mesophyll and bundle sheath compared well with literature. Table 2 shows that the volume per leaf area of mesophyll and bundle sheath cells of the 3D geometry were lower than those reported in the literature.
Fig. 1.
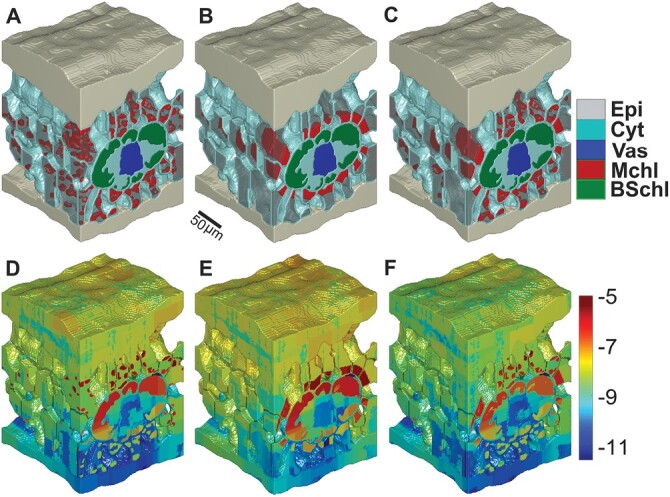
Three-dimensional leaf anatomy of a maize leaf and the various chloroplast arrangements. The geometries were obtained for the epidermis (Epi), chloroplasts of mesophyll (Mchl) and bundle sheath (BSchl) cells, vacuole (Vac), vascular bundle (Vas), and cytosol (Cyt). (A–C) Default geometry (A), aggregative movement of mesophyll chloroplasts (B), and geometry for avoidance movement (C). (D–F) Light absorbance for the default geometry (D), aggregative movement of mesophyll chloroplasts (E), and avoidance movement of mesophyll chloroplasts (F). The log10 of absorbance is shown in the color bar. Leaf tissue dimensions are 124 × 124 × 200 µm. Scale bar: 50 µm.
Table 2.
Anatomical properties of the 3D geometrical model in comparison with literature values
| Anatomical trait | 3D model | Literature values | References and notes |
|---|---|---|---|
| Mesophyll | |||
| Cell volume fraction (m3 m−2) | 30.2% 52.2 |
47% 80–120 |
Measured from 2D images, NADP-ME (Dengler et al., 1994) Volume per leaf area, NADP-ME (Pignon et al., 2019) |
| Chloroplast volume fraction (m3 m−2) | 13 × 10−6 | 10 × 10−6–14 × 10−6 | Volume per leaf area, NADP-ME (Pignon et al., 2019) |
| Surface to volume ratio (m2 m−3) | 0.14 × 10⁶ | 0.12 × 10⁶ | Measured from 2D images, NADP-ME (Dengler et al., 1994) |
| Exposed surface per leaf area, SM (m2 m−2) | 12 | 6–15 | Values for C4 plants including NADP-ME (Dengler et al., 1994; von Caemmerer et al., 2007; El-Sharkawy, 2009; Retta et al., 2016b; Sonawane et al., 2021) |
| Bundle-sheath | |||
| Cell volume fraction (m3 m−2) | 16.7% 27.6 |
12% 35–45 |
NADP-ME (Dengler et al., 1994) Volume per leaf area, NADP-ME (Pignon et al., 2019) |
| Chloroplast volume fraction (m3 m−2) | 15 × 10−6 | 6 × 10⁻⁶–10 × 10−6 | Volume per leaf area, NADP-ME (Pignon et al., 2019) |
| Surface to volume ratio (m2 m−3) | 0.045 × 10⁶ | 0.01 × 10⁻⁶–0.050 × 10⁶ | 2D, NADP-ME (Dengler et al., 1994) |
| Surface area per unit leaf area, SBS (m2 m−2) | 1.9 | 0.6–3.1 | NADP-ME (von Caemmerer et al., 2007; Retta et al., 2016b; Sonawane et al., 2021) |
| Intercellular airspace | |||
| Volume fraction (%) | 22.3 | 20–40 | NADP-ME (Dengler et al., 1994; Retta et al., 2016b; Sonawane et al., 2021) |
Figure 2A shows the comparison of optical properties measured experimentally with those predicted from the light propagation model using the default mesophyll chloroplasts configuration. The root mean square errors for the prediction of spectra of optical properties were 4% and 10% for total reflectance and transmittance (Fig. 2A), respectively. The simulation model for light propagation thus gave reasonable predictions for the reflectance and transmittance of red light (which was 90% of the total applied light in the gas exchange measurement, Fig. 2A). The fraction of photon energy absorbed by the leaf (Fig. 2B, C), as illustrated by a 3D representation in Fig. 1D, shows that halfway through the leaf depth, the photon absorption was enhanced by the chloroplasts within the bundle sheath cells. There was little effect of changing the scattering coefficient of chloroplasts by 25% on the absorption profile suggesting the effectiveness of our approach of accounting the scattering property of cell wall with that of chloroplasts. The response of jATP to Iinc (Fig. 2D) was computed using the estimated maximum rate of electron transport (Table 1). The light model predicts that 87% was absorbed by the leaf, while the mesophyll chloroplasts absorbed 55% and the bundle sheath chloroplasts absorbed 28% (Table 3). The predicted responses of An to changes in Iinc and Ci are shown in Fig. 3A, B. The mean square percentage error for the An–Iinc curve was 6.5% and that of the An–Ci curve was 1.8%. The deviations at low light intensity contributed to the higher mean square percentage error of the An–Iinc curve. At high light intensity where the chloroplast movement scenarios were considered, the error in the prediction was much lower (Fig. 3). Thus, the model could reasonably predict the response curves. The mean [CO2] in the bundle sheath chloroplast (Cc) was about five times higher than ambient [CO2] (380 µmol mol−1) when computed at 210 mmol mol−1 O2 and Iinc of 1500 µmol m−2 s−1 due to the CCM (Fig. 3C). The predicted CO2 concentration profile in the IAS was largely homogeneous (Fig. 3D).
Fig. 2.
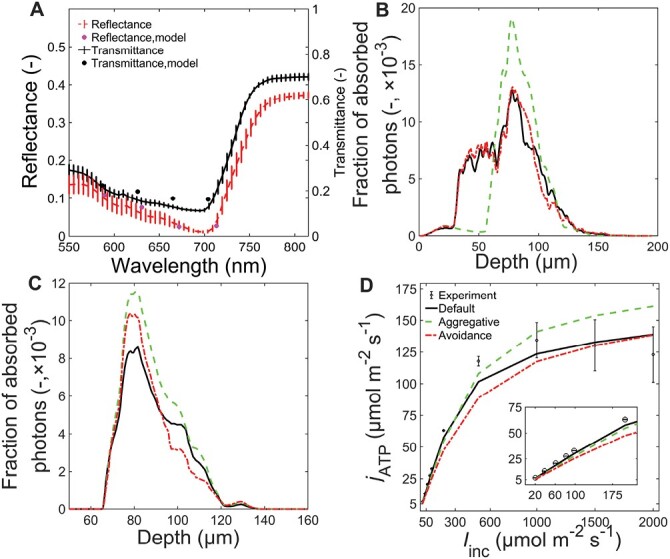
Validation of light propagation model and the roles of chloroplast arrangement on light propagation and ATP production. (A) Comparison of measured (symbol) and simulated (lines) reflectance (dashed line and pink circle) and transmittance (solid line and black circles) spectra for four maize leaves (Zea mays L.) in the default mesophyll chloroplasts case. (B–D) Simulated fraction of absorbed photons across the leaf depth (B) and just across the depth zone of bundle sheath cells (C) and the response of ATP production to irradiance (Iinc) (D) for the cases of default geometry (solid line), aggregative movement of mesophyll chloroplasts (dashed green line) and the avoidance movement of mesophyll chloroplasts (dashed-dotted red line). The symbols in (D) show the ATP production calculated from experimental data. Inset in (D) shows the total ATP production at low light intensities.
Table 3.
Effect of chloroplast arrangement on light absorbance, ATP production, and NADPH production
| Parameter | Default | Aggregative movement of mesophyll chloroplasts | Avoidance movement of mesophyll chloroplasts |
|---|---|---|---|
| Total absorbance | 0.87 | 0.81 | 0.82 |
| Chloroplast absorbance | 0.84 | 0.77 | 0.71 |
| Transmittance | 0.051 | 0.10 | 0.10 |
| Absorbance, bundle sheath:mesophyll | 0.51 | 0.88 | 0.74 |
| a | 0.89 | 0.99 | 0.96 |
| b | 0.28 | 0.33 | 0.31 |
| c | 0.85 | 0.81 | 0.83 |
| d | 0.20 | 0.01 | 0.08 |
| e | 0.14 | 0.23 | 0.20 |
| f | 0.39 | 0.53 | 0.49 |
a Fraction of light for LET in mesophyll cells.
b Fraction of light for LET in bundle sheath cells.
c Fraction of CET in bundle sheath.
d Fraction of CET in mesophyll.
e Fraction of NADPH produced in bundle sheath cells.
f Fraction of ATP produced in bundle sheath.
Fig. 3.
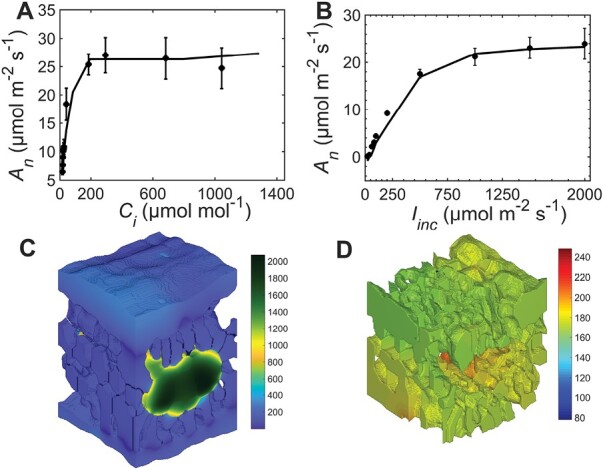
Comparison of model prediction of the response of net photosynthesis (An) and CO2 profile in leaf tissue. (A, B) The response of An to intercellular CO2 (Ci) (A) and to irradiance (Iinc) (B). Model predictions are shown by solid lines and experimental data are shown by symbols with error bars. Simulation conditions were irradiance of 1500 µmol m−2 s−1, ambient CO2 of 380 µmol mol−1, and oxygen of 210 mmol mol−1 for (A). The response to Iinc (B) was computed at ambient [CO2] of 250 µmol mol−1 and 210 mmol mol−1 O2. (C, D) The profiles of CO2 concentration (µmol mol−1) in the liquid phase (C) and in the intercellular airspace (D). In (A) and (B), the bars show standard error (n = 4). Color bars (C, D) are the CO2 concentrations (µmol mol−1).
The 3D model was compared with a simpler 2D model (Retta et al., 2016a) using random slices from the same default leaf geometry (Supplementary Fig. S4). The An–Ci curve was underestimated by the 2D models, especially if the viscosity of the aqueous symplast was estimated as double that of pure water (Supplementary Fig. S4A). The Cc estimated from the 3D model was 1584 µmol mol−1 (ambient [CO2] of 380 µmol mol−1, 210 mmol mol−1 O2, and Iinc of 1500 µmol m−2 s−1). The Cc calculated using three 2D slices selected at z-positions of 20, 40, and 60 in the stack of 120 slices was 1520 ± 270 µmol mol−1 suggesting that if Cc estimated from the 3D model is the more accurate, the use of randomly selected 2D slices will bias the concentration of CO2 at the sites of Rubisco. In particular, the 3D model of light absorption within the leaf structure profile (Fig. 1D) represents a major improvement over the assumption of constant photon flux across the leaf in the model of Retta et al. (2016a). Moreover, 2D models understate the interconnectivity of the IAS prevalent in the 3D space and may lead to areas of IAS not connected to a stoma, which compromises the modeling of CO2 diffusion within the IAS (Supplementary Fig. S4). Therefore, the 3D model is definitely more accurate than the 2D model to simulate diffusion of gases and photosynthesis in a C4 leaf.
Chloroplast movement increased the relative light absorbance by bundle sheath chloroplasts
wThe effect of mesophyll and bundle sheath chloroplast arrangement on light propagation is illustrated in Fig. 1D–F. The geometries of the different chloroplast arrangement scenarios (Fig. 1B, C) have similar volume fractions of chloroplasts per cell and total volume fractions of chloroplasts as the default geometry (Fig. 1A; Supplementary Fig. S3). The interveinal mesophyll cells whose chloroplast arrangement changed accounted for 25% of the mesophyll volume and the total chloroplast in avoidance arrangement is 18% of the total chloroplast volume.
Table 3 shows the total light absorption by the leaf decreased by ca. 7% for aggregative movement of mesophyll chloroplasts and ca. 6% for avoidance movement compared with that of the default geometry. The avoidance movements reduced the absorbance of chloroplasts by ca. 15% while aggregative movement resulted in ca. 8% lower absorbance. On the other hand, the transmittance of light through the maize leaf doubled in both chloroplast movement scenarios (Table 3). By contrast, the ratio of absorbed light by bundle sheath chloroplasts relative to mesophyll chloroplasts was increased by ca. 73% over the default case due to the aggregative movement and ca. 45% due to avoidance movement. Although transmittance did not change (Table 3) the reflectance increased by 6% in the avoidance movement compared with the aggregative movement.
The total leaf absorbance profile across the leaf depth is shown in Fig. 2B. The profile for the avoidance movement slightly differed close to mid-leaf thickness from that of the default case. The profile for avoidance movement changed in such a way that there was an increased absorbance followed by steeper decline starting at 100 µm depth, which was where the chloroplast arrangement changed from that of the default geometry (Fig. 2B). The aggregative chloroplast arrangement had a more significant change in the profile of light absorbed across the leaf, which resulted in a peak of absorption around the bundle sheath (Fig. 2B), but also boosted the fractional photon absorption by bundle sheath chloroplasts (Fig. 2C). Although the fractional photon absorption by bundle sheath increased in the avoidance scenario at lower leaf deep, it decreased deeper in the leaf (Fig. 2C).
Aggregative movement increased ATP and NADPH production in bundle sheath at high light intensities
The effect of chloroplast arrangement on ATP and NADPH production required to balance cell-type-specific demand at limiting light conditions is shown in Table 3. For the default geometry, the absorbed light was mainly used to drive linear electron transport (LET) in mesophyll chloroplasts and cyclic electron transport (CET) in bundle sheath cells. About 40% of the total ATP production was due to bundle sheath chloroplasts. The low NADPH production in bundle sheath cells was due to the assumption of little PSII in bundle sheath cells in the NADP-ME species.
In the aggregative movement case, nearly all of the light absorbed by mesophyll chloroplasts should be used for LET, as in the default case (Table 3). However, ca. 18% more light was allocated to LET in bundle sheath chloroplasts compared with the default. At the bundle sheath cell level, the contribution of CET to the total electron transport rate was only slightly lower in the aggregative than in the default arrangement (Table 3). The aggregative arrangement required ca. 36% more ATP production and ca. 64% more NADPH production in bundle sheath cells.
For avoidance movement, there was increased use of absorbed light by mesophyll and bundle sheath chloroplasts for LET. The increased use of light for LET was ca. 8% more in mesophyll chloroplasts and ca. 11% more in bundle sheath chloroplasts. In addition, the fractions of ATP and NADPH production at limited light intensity (Table 3) increased by ca. 43% and ca. 26% respectively, compared with the default chloroplast arrangement.
The effect of chloroplast arrangement on ATP production was extended to high light intensities where the maximum electron transport rate could be achieved (Fig. 2D). The mean ATP production at high Iinc was ca. 14–16% higher for aggregative movement compared with the default configuration. The avoidance movement, however, had little effect at Iinc of 1500 µmol m−2 s−1 and above. At low Iinc, the avoidance movement decreased the mean ATP production by ca. 15% (Fig. 2D). At limiting Iinc, the total ATP production decreased (Fig. 2D, inset) for all chloroplast movement cases.
Aggregative chloroplast movement increased An at high light but also increased leakiness
Figure 4A shows the effect of chloroplast arrangement on light response of An. Because of the higher ATP production (Fig. 2D), aggregative movement resulted in 4–8% higher An at high Iinc where the movement may occur. By contrast, An decreased by ca. 12–16% for avoidance movement of mesophyll chloroplasts at Iinc of 500 µmol m−2 s−1 and higher. At Iinc of 1500 µmol m−2 s−1, Φ was ca. 30% higher for the aggregative and avoidance arrangements than that for the default geometry (Fig. 4B). The increase in Φ for aggregative movement was due to higher CO2 in bundle sheath cells and leakage created by the imbalance in CO2 assimilation in mesophyll and bundle sheath (Supplementary Fig. S5). The higher ATP production at high Iinc translated into increased PEP carboxylation as the latter was limited by PEP regeneration, which consumes ATP. The higher PEP carboxylation increased the CO2 supply into bundle sheath chloroplasts, where the local Rubisco carboxylation was not proportionally increased (Supplementary Fig. S5). In addition, aggregative and avoidance movements increased oxygen production in bundle sheath cells because of the higher LET (Table 1) thereby increasing photorespiratory CO2 release in bundle sheath cytosol (not shown) despite a lower PSII proportion in bundle sheath chloroplasts of maize (assumed here to be 10%).
Fig. 4.
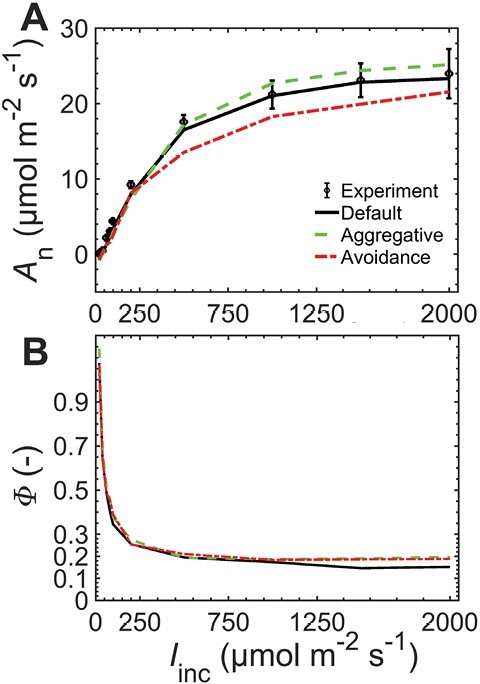
The response of net photosynthesis (An) (A) and leakiness (Φ) (B) to changes in irradiance (Iinc). The responses are for default geometry (black solid line), aggregative movement of mesophyll chloroplasts (green dashed line), and the avoidance movement of mesophyll chloroplasts (red dash-dotted line). The responses were computed at ambient CO2 of 250 µmol mol−1 and 210 mmol mol−1 O2. Symbols (with error bars) in (A) are for measurement data and lines are for model prediction.
Discussion
Overall performances of the 3D reaction–diffusion model for C4 photosynthesis applied to a maize leaf
We developed and tested for the first time a model that concurrently simulates CO2 and O2 transport, light propagation, C4 energetics and related photosynthetic processes in the full 3D geometry of a leaf of the C4 model crop maize. The 3D model was primarily validated by comparing simulated and measured responses of photosynthesis to CO2 concentration and light intensity. A large part of the merit in this rests on the fine tuning of the 3D light propagation model within a real maize leaf that properly reproduced the in vivo absorptance and transmittance measurements. This first 3D model of C4 photosynthesis constitutes an advance on the understanding of how anatomy regulates photosynthesis in C4 leaves, a complex process that requires fine tuning between the CCM and light available for chloroplasts in mesophyll and bundle sheath cells. The anatomical features influencing gas diffusion and light propagation compared well with literature values, although the features vary with treatments (Table 1) (Dengler et al., 1994; von Caemmerer et al., 2007; Retta et al., 2016b). The 3D model was applied in analysing photosynthesis by addressing the role of chloroplast arrangement, which requires a representative tissue-level 3D geometry and could not be realistically carried out by a 2D model (Supplementary Fig. S4) (Théroux-Rancourt et al., 2017; Earles et al., 2019). The 3D light profile showed that large photon absorption gradients existed when the Kranz anatomy was illuminated unilaterally depending on the 3D chloroplast distribution across the leaf thickness. The large gradient means that some of the chloroplasts are still light limited (Figs 1D, 2B; 18% by volume of the chloroplast absorbed less than 0.001% of the photons) and may strongly contribute to the non-saturated irradiance response of the leaf-level photosynthesis. However, light may be scattered more than modeled here by cell walls (Gates et al., 1965; Allen et al., 1973; Vogelmann, 1993), which were not explicitly included in the geometry because of the requirement of a much denser mesh and, hence, computational demand, but the scattering effect was lumped with the chloroplasts. Light may also penetrate deeper in leaf tissue in C4 leaves having bundle sheath extensions (Bellasio and Lundgren, 2016), which were not included here because bundle sheath extensions were not observed in the maize leaf anatomy (Supplementary Fig. S1A). In addition, the 3D model could be validated more accurately by comparing the intra-leaf profile of light and photosynthetic capacity. For instance, light-sheet microscopy can be used to resolve the profile of light across the leaf thickness (Slattery et al., 2016). In addition, the profile of photosynthetic capacity could also be estimated using epi-illumination fluorescence microscopy to derive the profile of chlorophyll and Rubisco, together with the aforementioned light absorption profile (Vogelmann and Evans, 2002; Slattery et al., 2016; Borsuk and Brodersen, 2019). Overall, the heterogeneity in light and [CO2] suggests that the contributions of electron transport and enzyme-limited CO2 assimilation rates to the total assimilation are influenced by the leaf microstructure.
Effect of mesophyll chloroplast movement on CO2 concentrating mechanism efficiency and photosynthetic rate
The 3D gas transport model was coupled with the ATP and NADPH production model using the validated light propagation model and was applied to test hypotheses on the effect of chloroplast movement on CCM efficiency and photosynthetic rate. The default 3D geometry was modified to model the geometries of the various arrangements of mesophyll and bundle sheath chloroplast scenarios inspired by what is observed in vivo from microscopy imaging (Yamada et al., 2009; Maai et al., 2011, 2020a,b; Sales et al., 2018). Care was taken not to modify the chloroplast volume fraction at the cell level in addition to the total chloroplast volume fraction so that the absorption and scattering coefficients remained similar. Consistent with previous observations, chloroplast movement increased transmittance and decreased light absorption (Yamada et al., 2009; Sun et al., 2014; Maai et al., 2020a). Avoidance movement was slightly more effective in decreasing total light absorption by chloroplasts. By contrast, aggregative movement highly increased absorption by bundle sheath chloroplasts while reducing the light exposure of mesophyll chloroplasts (Table 3). Although the aim of this study was to test the efficiency of mesophyll chloroplasts in gas exchange rates, our findings of light absorption profiles could be used in further studies to evaluate mechanisms of photoprotection and photoinhibition in C4 leaves when abiotic stress results in chloroplast movement (Ghannoum, 2009; Guidi et al., 2019).
The 3D model predicts that chloroplast movement impacted photosynthetic rate and CCM efficiency through altered light availability in mesophyll and bundle sheath chloroplasts, energy production, and changes in the process of electron transport. At high light intensities, where the aggregative movement was expected, there was a strong increase in photosynthetic rate (Fig. 4A) supporting our hypothesis that aggregative movement of mesophyll chloroplasts improves photosynthetic rate. In addition, avoidance movement of mesophyll chloroplasts decreased ATP production and An and increased Φ at high light intensities compared with the default case of no chloroplast movement. Thus, the hypothesis that avoidance movement decreases photosynthetic rate was supported. These results support the previous suggestion that preference for aggregative movement rather than avoidance movement in maize upon exposure to blue light intensity may have benefits for photosynthesis (Ryu et al., 2014). The altered light absorbance by mesophyll and bundle sheath chloroplasts created an imbalance in the rate of CO2 assimilation in mesophyll and bundle sheath cells resulting in increased leakiness (Fig. 4b). Such an imbalance has recently been shown to increase leakiness due to lack of coordination between mesophyll and bundle sheath cells following dark to high light transition (Wang et al., 2022). Previous modeling results suggested that increased leakiness may be beneficial as it helps balance reducing power demand and availability by removing excess CO2 from bundle sheath cells (Wang et al., 2014; Kromdijk et al., 2014). Balancing ATP and NADPH demand of the CCM required an increased operation of linear electron transport in mesophyll cells due to less light absorption by mesophyll chloroplasts (Table 3). Overall, the results support the hypothesis that chloroplast movement, although useful for photoprotection because less light is absorbed by chloroplasts, may affect the operation of CCM and reduce its efficiency (Taniguchi et al., 2003; Yamada et al., 2009; Maai et al., 2011, 2020b; Sun et al., 2014). These results are clear indications that C4 photosynthesis can be improved by optimizing light absorption and increasing ATP and NADPH production (Ermakova et al., 2019, 2021b), but at the expense of CCM efficiency. These results are relevant for stacking traits in the C4 Rice project (Ermakova et al., 2021a; Xiao et al., 2023), for example, one should consider designing strategies of boosting Rubisco activity in order to remedy the lower CCM efficiency in addition to reducing the limitation by electron transport at high light intensity by boosting electron transport capacity in C4 plants (Ermakova et al., 2019).
Chloroplast movement in C4 plants, unlike in C3 plants, requires exposure to high light intensity for several hours, which can be experienced by leaves close to the top of the canopy. The long duration may have been due to the sparse arrangement of chloroplasts in mesophyll cells of C4 plants making them less susceptible (Ghannoum et al., 2005; Stata et al., 2014), an evolutionary adaption of C4 plants, which may allow more light to pass through to bundle sheath cells (Stata et al., 2014). Our results suggest that CCM efficiency may also add another constraint, which needs to be verified experimentally. In addition, the limitation of metabolite transport may explain the limited movement of maize bundle sheath chloroplasts (Taniguchi et al., 2003; Kato et al., 2022). Our simulation results suggest that aggregative movement may provide benefits for improved photosynthesis besides photoprotection. However, if mesophyll chloroplasts are not arranged in this mode most of the day, it means that random distribution of chloroplasts in mesophyll cells is needed for processes other than photosynthesis, and only when light intensity is really high does the advantage of this configuration for gas exchange and photoprotection overcome the benefits of the other chloroplast functions within mesophyll cells.
Concluding remarks
We developed a 3D R-D model of gas exchange and light propagation coupled to an ATP and NADPH production model and applied it to test the hypotheses that movement of chloroplasts reduces light absorption within the C4 leaf but modifies differently the CCM efficiency and photosynthesis depending on the type of mesophyll chloroplast movement. We found that mesophyll aggregative chloroplasts arrangement increased the proportion of light absorption by bundle sheath cells, the leaf ATP and NADPH production, and photosynthetic rate. By contrast, the avoidance arrangement decreased photosynthesis. None of the chloroplast movement scenarios were beneficial for maintaining CCM efficiency. C4 plants could boost photosynthetic rate further at the expense of increased leakiness using chloroplast movement in addition to photo-protection under high light intensity (Yamada et al., 2009; Maai et al., 2011, 2020b). Furthermore, evidence has been provided that a 3D model, unlike simpler biochemical models and a 2D model, can provide increased mechanistic understanding of the light propagation, CO2 diffusion, and chloroplast movement in complex C4 photosynthesis.
Supplementary data
The following supplementary data are available at JXB online.
Fig. S1. Sample light microscopy images of maize leaf tissue.
Fig. S2. Stomatal conductance to CO2 in response to irradiance and degree of stomatal opening.
Fig. S3. Comparison of volume of mesophyll chloroplasts per cell.
Fig. S4. Comparison of a 2D and a 3D model.
Fig. S5. Comparison of local rates and CO2 concentration.
Table S1. List of symbols, their definitions, and units.
Table S2. Mean equivalent radius and total number of organelles per volume.
Table S3. Computed optical properties of the different compartments of the leaf model.
Acknowledgements
We would like to thank Prof. Johan Billen, KU Leuven, Belgium for helping us make serial light microscopy images of the leaf anatomy.
Contributor Information
Moges A Retta, KU Leuven, MeBioS division, Willem de Croylaan 42, B-3001, Leuven, Belgium; Centre for Crop Systems Analysis, Wageningen University & Research, P.O. Box 430, 6700 AK Wageningen, The Netherlands.
Xinyou Yin, Centre for Crop Systems Analysis, Wageningen University & Research, P.O. Box 430, 6700 AK Wageningen, The Netherlands.
Quang Tri Ho, Institute of Marine Research, Nordnesgaten 50, NO-5005 Bergen, P.O. Box 1870, Nordnes, Norway.
Rodrigo Watté, KU Leuven, MeBioS division, Willem de Croylaan 42, B-3001, Leuven, Belgium.
Herman N C Berghuijs, Plant Production Systems group, Wageningen University & Research, P.O. Box 430, 6700 AK Wageningen, The Netherlands.
Pieter Verboven, KU Leuven, MeBioS division, Willem de Croylaan 42, B-3001, Leuven, Belgium.
Wouter Saeys, KU Leuven, MeBioS division, Willem de Croylaan 42, B-3001, Leuven, Belgium.
Francisco Javier Cano, Centro de Investigación Forestal (CIFOR), Instituto Nacional de Investigacion y Tecnologia Agraria y Alimentaria (INIA), Consejo Superior de Investigaciones Científicas (CSIC), Carretera de la Coruña Km 7.5, 28040, Madrid, Spain; ARC Centre of Excellence for Translational Photosynthesis, Hawkesbury Institute for the Environment, University of Western Sydney, Hawkesbury campus, Locked Bag 1797, Penrith 2751, NSW, Australia.
Oula Ghannoum, ARC Centre of Excellence for Translational Photosynthesis, Hawkesbury Institute for the Environment, University of Western Sydney, Hawkesbury campus, Locked Bag 1797, Penrith 2751, NSW, Australia.
Paul C Struik, Centre for Crop Systems Analysis, Wageningen University & Research, P.O. Box 430, 6700 AK Wageningen, The Netherlands.
Bart M Nicolaï, KU Leuven, MeBioS division, Willem de Croylaan 42, B-3001, Leuven, Belgium; Flanders Center of Postharvest Technology, Willem de Croylaan 42, B-3001, Leuven, Belgium.
Elizabete Carmo-Silva, Lancaster University, UK.
Author contributions
MAR carried out simulations, analysed data and wrote the manuscript. QTH contributed to developing the numerical model. XY developed the ATP and NADPH production model. RW and WS developed the ray-tracing model and measured spectral properties of maize leaves. HNCB, FJC, and OG helped in the analysis and interpretation of gas transport calculations. BMN, PCS, and PV planned and designed the research. All authors reviewed and approved the manuscript.
Conflict of interest
The authors declare they have no conflict of interest.
Funding
The work is supported by the Research Council of KU Leuven (project C1/16/002) and the Research Fund Flanders (project G.0645.13). Wageningen based authors have contributed to this work within the program BioSolar Cells. FJC was funded through the Spanish fellowship Ramon y Cajal (RYC2021-035064-I).
Data availability
The MATLAB code used for solving the reaction–diffusion models is available at Dryad Digital Repository at https://doi.org/10.5061/dryad.59zw3r2bx (Retta et al., 2023).
References
- Aernouts B, Watté R, Van Beers R, Delport F, Merchiers M, De Block J, Lammertyn J, Saeys W.. 2014. Flexible tool for simulating the bulk optical properties of polydisperse spherical particles in an absorbing host: experimental validation. Optics Express 22, 20223–20238. [DOI] [PubMed] [Google Scholar]
- Allen WA, Gausman HW, Richardson AJ.. 1973. Willstätter-Stoll theory of leaf reflectance evaluated by ray tracing. Applied Optics 12, 2448–2453. [DOI] [PubMed] [Google Scholar]
- Anderson CM, Mattoon EM, Zhang N, et al. 2021. High light and temperature reduce photosynthetic efficiency through different mechanisms in the C4 model Setaria viridis. Communications Biology 4, 1092. [DOI] [PMC free article] [PubMed] [Google Scholar]
- Bauwe H. 1986. An efficient method for the determination of Km values for HCO3 −of phosphoenolpyruvate carboxylase. Planta 169, 356–360. [DOI] [PubMed] [Google Scholar]
- Bellasio C. 2017. A generalized stoichiometric model of C3, C2, C2+C4, and C4 photosynthetic metabolism. Journal of Experimental Botany 68, 269–282. [DOI] [PMC free article] [PubMed] [Google Scholar]
- Bellasio C, Farquhar GD.. 2019. A leaf-level biochemical model simulating the introduction of C2 and C4 photosynthesis in C3 rice: gains, losses and metabolite fluxes. New Phytologist 223, 150–166. [DOI] [PubMed] [Google Scholar]
- Bellasio C, Lundgren MR.. 2016. Anatomical constraints to C4 evolution: light harvesting capacity in the bundle sheath. New Phytologist 212, 485–496. [DOI] [PubMed] [Google Scholar]
- Berghuijs HNC, Yin X, Ho QT, Driever SM, Retta MA, Nicolaï BM, Struik PC.. 2016. Mesophyll conductance and reaction-diffusion models for CO2 transport in C3 leaves; needs, opportunities and challenges. Plant Science 252, 62–75. [DOI] [PubMed] [Google Scholar]
- Berghuijs HNC, Yin X, Ho QT, Retta MA, Nicolaï BM, Struik PC.. 2019. Using a reaction-diffusion model to estimate day respiration and reassimilation of (photo)respired CO2 in leaves. New Phytologist 223, 619–631. [DOI] [PMC free article] [PubMed] [Google Scholar]
- Borsuk AM, Brodersen CR.. 2019. The spatial distribution of chlorophyll in leaves. Plant Physiology 180, 1406–1417. [DOI] [PMC free article] [PubMed] [Google Scholar]
- Boyd RA, Gandin A, Cousins AB.. 2015. Temperature response of C4 photosynthesis: biochemical analysis of rubisco, phosphoenolpyruvate carboxylase and carbonic anhydrase in Setaria viridis. Plant Physiology 169, 1850–1861. [DOI] [PMC free article] [PubMed] [Google Scholar]
- Burnell JN, Hatch MD.. 1988. Low bundle sheath carbonic anhydrase is apparently essential for effective C4 pathway operation. Plant physiology 86, 1252–1256. [DOI] [PMC free article] [PubMed] [Google Scholar]
- Cousins AB, Ghannoum O, von Caemmerer S, Badger MR.. 2010. Simultaneous determination of Rubisco carboxylase and oxygenase kinetic parameters in Triticum aestivum and Zea mays using membrane inlet mass spectrometry. Plant, Cell & Environment 33, 444–452. [DOI] [PubMed] [Google Scholar]
- Dengler NG, Nelson T.. 1999. Leaf structure and development in C4 plants. In: Sage RF, Monson RK, eds. C4 plant biology. Toronto, ON, Canada: Academic Press, 133–172. [Google Scholar]
- Dengler NG, Dengler RE, Donnelly PM, Hatterlsey PW.. 1994. Quantitative leaf anatomy of C3 and C4 grasses (Poaceae): Bundle sheath and mesophyll surface area relationships. Annals of Botany 73, 241–255. [Google Scholar]
- Denny MW. 1993. Air and water: The biology and physics of life’s media. Princeton, NJ: Princeton University Press. [Google Scholar]
- Driscoll SP, Prins A, Olmos E, Kunert KJ, Foyer CH.. 2006. Specification of adaxial and abaxial stomata, epidermal structure and photosynthesis to CO2 enrichment in maize leaves. Journal of Experimental Botany 57, 381–390. [DOI] [PubMed] [Google Scholar]
- Earles JM, Buckley TN, Brodersen CR, et al. 2019. Embracing 3D complexity in leaf carbon–water exchange. Trends in Plant Science 24, 15–24. [DOI] [PubMed] [Google Scholar]
- El-Sharkawy MA. 2009. Pioneering research on C4 leaf anatomical, physiological, and agronomic characteristics of tropical monocot and dicot plant species: Implications for crop water relations and productivity in comparison to C3 cropping systems. Photosynthetica 47, 163–183. [Google Scholar]
- Ermakova M, Arrivault S, Giuliani R, et al. 2021a. Installation of C4 photosynthetic pathway enzymes in rice using a single construct. Plant Biotechnology Journal 19, 575–588. [DOI] [PMC free article] [PubMed] [Google Scholar]
- Ermakova M, Bellasio C, Fitzpatrick D, Furbank RT, Mamedov F, von Caemmerer S.. 2021b. Upregulation of bundle sheath electron transport capacity under limiting light in C4Setaria viridis. The Plant Journal 106, 1443–1454. [DOI] [PMC free article] [PubMed] [Google Scholar]
- Ermakova M, Lopez-Calcagno PE, Raines CA, Furbank RT, von Caemmerer S.. 2019. Overexpression of the Rieske FeS protein of the Cytochrome b6f complex increases C4 photosynthesis in Setaria viridis. Communications Biology 2, 314. [DOI] [PMC free article] [PubMed] [Google Scholar]
- Evans JR. 2021. Mesophyll conductance: walls, membranes and spatial complexity. New Phytologist 229, 1864–1876. [DOI] [PubMed] [Google Scholar]
- Evans JR, Kaldenhoff R, Genty B, Terashima I.. 2009. Resistances along the CO2 diffusion pathway inside leaves. Journal of Experimental Botany 60, 2235–2248. [DOI] [PubMed] [Google Scholar]
- Evans JR, Vogelmann TC, Caemmerer S von.. 2007. Balancing light capture with distributed metabolic demand during C4 photosynthesis. In: Sheehy J, Mitchell P, Hardy B, eds. Charting new pathways to C4 rice. Los Baños, Philippines: International Rice Research Institute, 127–144. [Google Scholar]
- Farquhar G, Wong S.. 1984. An empirical model of stomatal conductance. Australian Journal of Plant Physiology 11, 191. [Google Scholar]
- Frank MJW, Kuipers JAM, Swaaij WPM van.. 1996. Diffusion coefficients and viscosities of CO2 + H2O, CO2 + CH3OH, NH3 + H2O, and NH3 + CH3OH liquid mixtures. Journal of Chemical & Engineering Data 41, 297–302. [Google Scholar]
- Furbank RT. 2011. Evolution of the C4 photosynthetic mechanism: are there really three C4 acid decarboxylation types? Journal of Experimental Botany 62, 3103–3108. [DOI] [PubMed] [Google Scholar]
- Furbank RT, Hatch MD.. 1987. Mechanism of C4 photosynthesis: The size and composition of the inorganic carbon pool in bundle sheath cells. Plant Physiology 85, 958–964. [DOI] [PMC free article] [PubMed] [Google Scholar]
- Gates DM, Keegan HJ, Schleter JC, Weidner VR.. 1965. Spectral properties of plants. Applied Optics 4, 11. [Google Scholar]
- Geers C, Gros G.. 2000. Carbon dioxide transport and carbonic anhydrase in blood and muscle. Physiological Reviews 80, 681–715. [DOI] [PubMed] [Google Scholar]
- Ghannoum O. 2009. C4 photosynthesis and water stress. Annals of Botany 103, 635–644. [DOI] [PMC free article] [PubMed] [Google Scholar]
- Ghannoum O, Evans JR, Chow WS, Andrews TJ, Conroy JP, von Caemmerer S.. 2005. Faster Rubisco is the key to superior nitrogen-use efficiency in NADP-malic enzyme relative to NAD-malic enzyme C4 grasses. Plant Physiology 137, 638–650. [DOI] [PMC free article] [PubMed] [Google Scholar]
- Gotoh E, Suetsugu N, Yamori W, Ishishita K, Kiyabu R, Fukuda M, Higa T, Shirouchi B, Wada M.. 2018. Chloroplast accumulation response enhances leaf photosynthesis and plant biomass production. Plant Physiology 178, 1358–1369. [DOI] [PMC free article] [PubMed] [Google Scholar]
- Guidi L, Lo Piccolo E, Landi M.. 2019. Chlorophyll fluorescence, photoinhibition and abiotic stress: Does it make any difference the fact to be a C3 or C4 species? Frontiers in Plant Science 10, 174. [DOI] [PMC free article] [PubMed] [Google Scholar]
- Gutknecht J, Bisson MA, Tosteson FC.. 1977. Diffusion of carbon dioxide through lipid bilayer membranes: effects of carbonic anhydrase, bicarbonate, and unstirred layers. The Journal of General Physiology 69, 779–794. [DOI] [PMC free article] [PubMed] [Google Scholar]
- Hatch MD, Burnell JN.. 1990. Carbonic anhydrase activity in leaves and its role in the first step of C4 photosynthesis. Plant Physiology 93, 825–828. [DOI] [PMC free article] [PubMed] [Google Scholar]
- Hattersley PW, Browning AJ.. 1981. Occurrence of the suberized lamella in leaves of grasses of different photosynthetic types. I. In parenchymatous bundle sheaths and PCR (‘Kranz’) sheaths. Protoplasma 109, 371–401. [Google Scholar]
- Ho QT, Berghuijs HNC, Watté R, et al. 2016. Three-dimensional microscale modelling of CO2 transport and light propagation in tomato leaves enlightens photosynthesis. Plant, Cell & Environment 39, 50–61. [DOI] [PubMed] [Google Scholar]
- Ho QT, Verboven P, Verlinden BE, Herremans E, Wevers M, Carmeliet J, Nicolaï BM.. 2011. A three-dimensional multiscale model for gas exchange in fruit. Plant Physiology 155, 1158–1168. [DOI] [PMC free article] [PubMed] [Google Scholar]
- Ho QT, Verboven P, Yin X, Struik PC, Nicolaï BM.. 2012. A microscale model for combined CO2 diffusion and photosynthesis in leaves. PLoS One 7, e48376. [DOI] [PMC free article] [PubMed] [Google Scholar]
- Jolly W. 1985. Modern inorganic chemistry. New York: McGraw-Hill. [Google Scholar]
- Juurola E, Aalto T, Thum T, Vesala T, Hari P.. 2005. Temperature dependence of leaf-level CO2 fixation: revising biochemical coefficients through analysis of leaf three-dimensional structure. New Phytologist 166, 205–215. [DOI] [PubMed] [Google Scholar]
- Kanai R, Edwards GE.. 1999. The biochemistry of C4 photosynthesis. In: Sage RF, Monson RK, eds. C4 plant biology. Toronto, ON, Canada: Academic Press, 49–87. [Google Scholar]
- Kato Y, Tsukaguchi T, Yata I, Yamamura R, Oi T, Taniguchi M.. 2022. Aggregative movement of mesophyll chloroplasts occurs in a wide variety of C4 plant species. Flora 294, 152133. [Google Scholar]
- Kromdijk J, Griffiths H, Schepers HE.. 2010. Can the progressive increase of C4 bundle sheath leakiness at low PFD be explained by incomplete suppression of photorespiration? Plant, Cell & Environment 33, 1935–1948. [DOI] [PubMed] [Google Scholar]
- Kromdijk J, Ubierna N, Cousins AB, Griffiths H.. 2014. Bundle-sheath leakiness in C4 photosynthesis: a careful balancing act between CO2 concentration and assimilation. Journal of Experimental Botany 65, 3443–3457. [DOI] [PubMed] [Google Scholar]
- Lide DR. 1999. Handbook of chemistry and physics. Boca Raton, FL, USA: CRC Press. [Google Scholar]
- Maai E, Nishimura K, Takisawa R, Nakazaki T.. 2020a. Diurnal changes in chloroplast positioning and photosynthetic traits of C4 grass finger millet. Plant Production Science 4, 477–489. [Google Scholar]
- Maai E, Nishimura K, Takisawa R, Nakazaki T.. 2020b. Light stress-induced chloroplast movement and midday depression of photosynthesis in sorghum leaves. Plant Production Science 23, 172–181. [Google Scholar]
- Maai E, Shimada S, Yamada M, Sugiyama T, Miyake H, Taniguchi M.. 2011. The avoidance and aggregative movements of mesophyll chloroplasts in C4 monocots in response to blue light and abscisic acid. Journal of Experimental Botany 62, 3213–3221. [DOI] [PubMed] [Google Scholar]
- Missner A, Kugler P, Saparov SM, Sommer K, Mathai JC, Zeidel ML, Pohl P.. 2008. Carbon dioxide transport through membranes. Journal of Biological Chemistry 283, 25340–25347. [DOI] [PMC free article] [PubMed] [Google Scholar]
- Pengelly JJL, Sirault XRR, Tazoe Y, Evans JR, Furbank RT, von Caemmerer S.. 2010. Growth of the C4 dicot Flaveria bidentis: photosynthetic acclimation to low light through shifts in leaf anatomy and biochemistry. Journal of Experimental Botany 61, 4109–4122. [DOI] [PMC free article] [PubMed] [Google Scholar]
- Pignon CP, Lundgren MR, Osborne CP, Long SP.. 2019. Bundle sheath chloroplast volume can house sufficient Rubisco to avoid limiting C4 photosynthesis during chilling. Journal of Experimental Botany 70, 357–365. [DOI] [PMC free article] [PubMed] [Google Scholar]
- Pocker Y, Miksch RR.. 1978. Plant carbonic anhydrase. Properties and bicarbonate dehydration kinetics. Biochemistry 17, 1119–1125. [DOI] [PubMed] [Google Scholar]
- Retta M, Ho QT, Yin X, Verboven P, Berghuijs HNC, Struik PC, Nicolaï BM.. 2016a. A two-dimensional microscale model of gas exchange during photosynthesis in maize (Zea mays L.) leaves. Plant Science 246, 37–51. [DOI] [PubMed] [Google Scholar]
- Retta MA, Yin X, Ho QT, et al. 2023. MATLAB code from: The role of chloroplast movement in C4 photosynthesis: a theoretical analysis using a 3D reaction–diffusion model for maize. Dryad Digital Repository. 10.5061/dryad.59zw3r2bx [DOI] [PMC free article] [PubMed]
- Retta M, Yin X, van der Putten PEL, Cantre D, Berghuijs HNC, Ho QT, Verboven P, Struik PC, Nicolaï BM.. 2016b. Impact of anatomical traits of maize (Zea mays L.) leaf as affected by nitrogen supply and leaf age on bundle sheath conductance. Plant Science 252, 205–214. [DOI] [PubMed] [Google Scholar]
- Ryu J, Nam H, Kim HK, Joo Y, Lee SJ, Kim KH.. 2014. In vivo monitoring of intracellular chloroplast movements in intact leaves of C4 plants using two-photon microscopy. Microscopy Research and Technique 77, 806–813. [DOI] [PubMed] [Google Scholar]
- Sales CR, Ribeiro RV, Hayashi AH, Marchiori PE, Silva KI, Martins MO, Silveira JAG, Silveira NM, Machado EC.. 2018. Flexibility of C4 decarboxylation and photosynthetic plasticity in sugarcane plants under shading. Environmental and Experimental Botany 149, 34–42. [Google Scholar]
- Slattery RA, Grennan AK, Sivaguru M, Sozzani R, Ort DR.. 2016. Light sheet microscopy reveals more gradual light attenuation in light-green versus dark-green soybean leaves. Journal of Experimental Botany 67, 4697–4709. [DOI] [PMC free article] [PubMed] [Google Scholar]
- Somerville CR. 2001. An early arabidopsis demonstration. resolving a few issues concerning photorespiration. Plant Physiology 125, 20–24. [DOI] [PMC free article] [PubMed] [Google Scholar]
- Sonawane BV, Koteyeva NK, Johnson DM, Cousins AB.. 2021. Differences in leaf anatomy determines temperature response of leaf hydraulic and mesophyll CO2 conductance in phylogenetically related C4 and C3 grass species. New Phytologist 230, 1802–1814. [DOI] [PubMed] [Google Scholar]
- Sowiński P, Szczepanik J, Minchin PEH.. 2008. On the mechanism of C4 photosynthesis intermediate exchange between Kranz mesophyll and bundle sheath cells in grasses. Journal of Experimental Botany 59, 1137–1147. [DOI] [PubMed] [Google Scholar]
- Spalding MH, Portis AR.. 1985. A model of carbon dioxide assimilation in Chlamydomonas reinhardii. Planta 164, 308–320. [DOI] [PubMed] [Google Scholar]
- Stata M, Sage TL, Rennie TD, Khoshravesh R, Sultmanis S, Khaikin Y, Ludwig M, Sage RF.. 2014. Mesophyll cells of C4 plants have fewer chloroplasts than those of closely related C3 plants. Plant, Cell & Environment 37, 2587–2600. [DOI] [PubMed] [Google Scholar]
- Sun W, Ubierna N, Ma J-Y, Cousins AB.. 2012. The influence of light quality on C4 photosynthesis under steady-state conditions in Zea mays and Miscanthus × giganteus: changes in rates of photosynthesis but not the efficiency of the CO2 concentrating mechanism. Plant, Cell & Environment 35, 982–993. [DOI] [PubMed] [Google Scholar]
- Sun W, Ubierna N, Ma J-Y, Walker BJ, Kramer DM, Cousins AB.. 2014. The coordination of C4 photosynthesis and the CO2-concentrating mechanism in maize and Miscanthus × giganteus in response to transient changes in light quality. Plant Physiology 164, 1283–1292. [DOI] [PMC free article] [PubMed] [Google Scholar]
- Taiz L. 1992. The plant vacuole. The Journal of Experimental Biology 172, 113–122. [DOI] [PubMed] [Google Scholar]
- Taniguchi M, Cousins AB.. 2018. Significance of C4 leaf structure at the tissue and cellular levels. In: Adams WW III, Terashima I, eds. The leaf: A platform for performing photosynthesis. Cham: Springer International Publishing, 255–279. [Google Scholar]
- Taniguchi Y, Taniguchi M, Kawasaki M, Miyake H.. 2003. Strictness of the centrifugal location of bundle sheath chloroplasts in different NADP-ME type C4 grasses. Plant Production Science 6, 274–280. [Google Scholar]
- Théroux-Rancourt G, Earles JM, Gilbert ME, Zwieniecki MA, Boyce CK, McElrone AJ, Brodersen CR.. 2017. The bias of a two-dimensional view: comparing two-dimensional and three-dimensional mesophyll surface area estimates using noninvasive imaging. New Phytologist 215, 1609–1622. [DOI] [PubMed] [Google Scholar]
- Tholen D, Boom C, Noguchi K, Ueda S, Katase T, Terashima I.. 2008. The chloroplast avoidance response decreases internal conductance to CO2 diffusion in Arabidopsis thaliana leaves. Plant, Cell & Environment 31, 1688–1700. [DOI] [PubMed] [Google Scholar]
- Tholen D, Zhu X-G.. 2011. The mechanistic basis of internal conductance: a theoretical analysis of mesophyll cell photosynthesis and CO2 diffusion. Plant Physiology 156, 90–105. [DOI] [PMC free article] [PubMed] [Google Scholar]
- Versteeg H, Malalasekera W.. 1995. An introduction to computational fluid dynamics: the finite volume method. Harlow, UK: Longman Scientific and Technical. [Google Scholar]
- Vogelmann TC. 1993. Plant tissue optics. Annual Review of Plant Physiology and Plant Molecular Biology 44, 231–251. [Google Scholar]
- Vogelmann TC, Evans JR.. 2002. Profiles of light absorption and chlorophyll within spinach leaves from chlorophyll fluorescence. Plant, Cell & Environment 25, 1313–1323. [Google Scholar]
- von Caemmerer S, Evans JR, Cousins AB, Badger MR, Furbank RT.. 2007. C4 photosynthesis and CO2 diffusion. In: Sheehy J, Mitchell P, Hardy B, eds. Charting new pathways to C4 rice. Los Baños, Philippines: International Rice Research Institute, 95–116. [Google Scholar]
- von Caemmerer S, Furbank RT.. 1999. Modeling C4 photosynthesis. In: Sage RF, Monson RK, eds. C4 plant biology. Toronto, ON, Canada: Academic Press, 173–211. [Google Scholar]
- Wada M. 2013. Chloroplast movement. Plant Science 210, 177–182. [DOI] [PubMed] [Google Scholar]
- Wang S, Tholen D, Zhu X-G.. 2017. C4 photosynthesis in C3 rice: a theoretical analysis of biochemical and anatomical factors. Plant, Cell & Environment 40, 80–94. [DOI] [PMC free article] [PubMed] [Google Scholar]
- Wang Y, Bräutigam A, Weber APM, Zhu X-G.. 2014. Three distinct biochemical subtypes of C4 photosynthesis? A modelling analysis. Journal of Experimental Botany 65, 3567–3578. [DOI] [PMC free article] [PubMed] [Google Scholar]
- Wang Y, Stutz SS, Bernacchi CJ, Boyd RA, Ort DR, Long SP.. 2022. Increased bundle-sheath leakiness of CO2 during photosynthetic induction shows a lack of coordination between the C4 and C3 cycles. New Phytologist 236, 1661–1675. [DOI] [PMC free article] [PubMed] [Google Scholar]
- Watté R, Aernouts B, Van Beers R, Herremans E, Ho QT, Verboven P, Nicolaï B, Saeys W.. 2015. Modeling the propagation of light in realistic tissue structures with MMC-fpf: a meshed Monte Carlo method with free phase function. Optics Express 23, 17467–17486. [DOI] [PubMed] [Google Scholar]
- Xiao Y, Sloan J, Hepworth C, et al. 2023. Defining the scope for altering rice leaf anatomy to improve photosynthesis: a modelling approach. New Phytologist 237, 441–453. [DOI] [PMC free article] [PubMed] [Google Scholar]
- Xiao Y, Tholen D, Zhu X-G.. 2016. The influence of leaf anatomy on the internal light environment and photosynthetic electron transport rate: exploration with a new leaf ray tracing model. Journal of Experimental Botany 67, 6021–6035. [DOI] [PMC free article] [PubMed] [Google Scholar]
- Yamada M, Kawasaki M, Sugiyama T, Miyake H, Taniguchi M.. 2009. Differential positioning of C4 mesophyll and bundle sheath chloroplasts: aggregative movement of C4 mesophyll chloroplasts in response to environmental stresses. Plant & Cell Physiology 50, 1736–1749. [DOI] [PubMed] [Google Scholar]
- Yin X, Harbinson J, Struik PC.. 2006. Mathematical review of literature to assess alternative electron transports and interphotosystem excitation partitioning of steady-state C3 photosynthesis under limiting light. Plant, Cell & Environment 29, 1771–1782. [DOI] [PubMed] [Google Scholar]
- Yin X, Struik PC.. 2009. C3 and C4 photosynthesis models: An overview from the perspective of crop modelling. NJAS – Wageningen Journal of Life Sciences 57, 27–38. [Google Scholar]
- Yin X, Struik PC.. 2012. Mathematical review of the energy transduction stoichiometries of C4 leaf photosynthesis under limiting light. Plant, Cell & Environment 35, 1299–1312. [DOI] [PubMed] [Google Scholar]
- Yin X, Struik PC.. 2018. The energy budget in C4 photosynthesis: insights from a cell-type-specific electron transport model. New Phytologist 218, 986–998. [DOI] [PMC free article] [PubMed] [Google Scholar]
- Yin X, Struik PC.. 2021. Exploiting differences in the energy budget among C4 subtypes to improve crop productivity. New Phytologist 229, 2400–2409. [DOI] [PMC free article] [PubMed] [Google Scholar]
- Yin X, Struik PC, Romero P, Harbinson J, Evers JB, Van Der Putten PEL, Vos J.. 2009. Using combined measurements of gas exchange and chlorophyll fluorescence to estimate parameters of a biochemical C3 photosynthesis model: a critical appraisal and a new integrated approach applied to leaves in a wheat (Triticum aestivum) canopy. Plant, Cell & Environment 32, 448–464. [DOI] [PubMed] [Google Scholar]
- Yin X, Sun Z, Struik PC, Van der Putten PEL, Van Ieperen W, Harbinson J.. 2011. Using a biochemical C4 photosynthesis model and combined gas exchange and chlorophyll fluorescence measurements to estimate bundle-sheath conductance of maize leaves differing in age and nitrogen content. Plant, Cell & Environment 34, 2183–2199. [DOI] [PubMed] [Google Scholar]
- Zheng Y, Xu M, Shen R, Qiu S.. 2013. Effects of artificial warming on the structural, physiological, and biochemical changes of maize (Zea mays L.) leaves in northern China. Acta Physiologiae Plantarum 35, 2891–2904. [Google Scholar]
Associated Data
This section collects any data citations, data availability statements, or supplementary materials included in this article.
Supplementary Materials
Data Availability Statement
The MATLAB code used for solving the reaction–diffusion models is available at Dryad Digital Repository at https://doi.org/10.5061/dryad.59zw3r2bx (Retta et al., 2023).