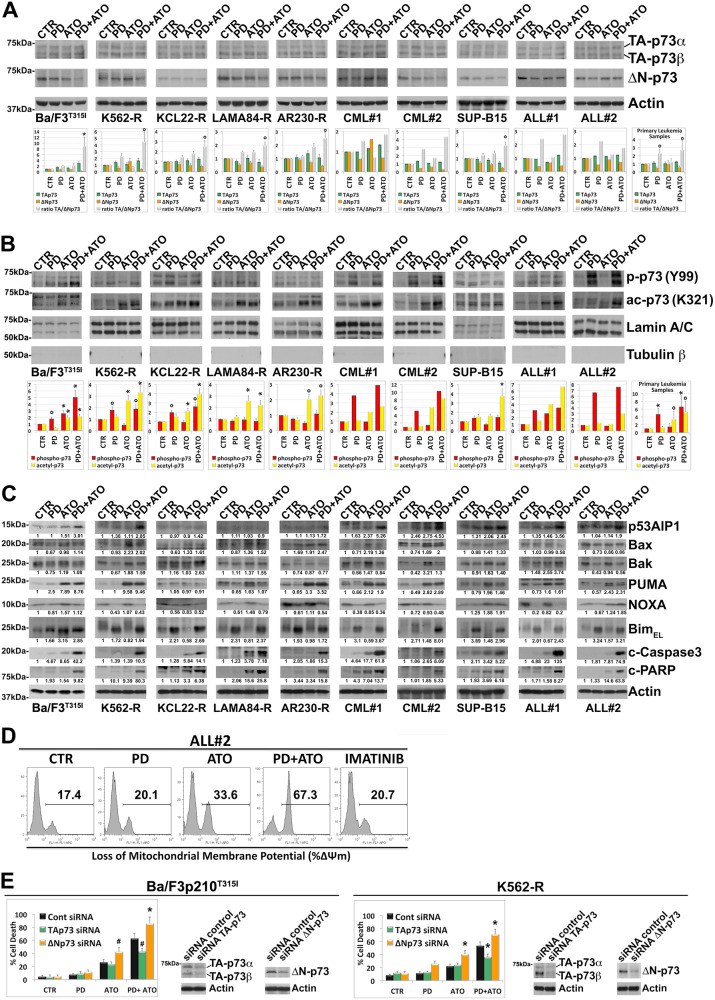
Fig. 5. Combined treatment with MEK1/2 inhibitor PD0325901 and ATO activates the p73 pathway in TKI-resistant Ph+ leukemia cells.
A Analysis of endogenous TA-p73α + β, ΔN-p73 and Actin expression in murine Ba/F3p210T315I cells, Imatinib-resistant Ph+ cell lines and primary cells from Ph+ leukemia patients following sequential and combined treatment with PD0325901 (0.5 μM) and ATO (2 μM) for 24 h. TA-p73α + β and ΔN-p73 were analyzed sequentially and images shown are from the same blot. The graphs show the relative fold change of TA-p73α + β, ΔN-p73 and the ratio TA/ΔN-p73 normalized with respect to control condition, which was set at 1 (mean ± SD of three independent blots of Ph+ cell lines and of n = 4 primary samples; °p < 0.05, *p < 0.005 vs. untreated control cells, Dunnett test). B Analysis of phospho-p73 (Tyr99) and acetyl-p73 (Lys321) levels in nuclear extract of murine Ba/F3p210T315I cells, Imatinib-resistant Ph+ cell lines and primary cells from Ph+ leukemia patients following sequential and combined treatment with PD0325901 (0.5 μM) and ATO (2 μM) for 24 h. Bands from nuclear extracts were subjected to densitometric scanning and normalized to Lamin A/C expression. The graphs show the fold changes of phospho-p73 (Tyr99) and acetyl-p73 (Lys321) in nuclear extracts, relative to control conditions set at 1 (mean ± SD of three independent blots of Ph+ cell lines and of n = 4 primary samples; °p < 0.05, *p < 0.01 vs. untreated control cells, Dunnett test). C Relative expression levels of endogenous p53AIP1, Bax, Bak, PUMA, NOXA, BimEL, cleaved Caspase-3 and cleaved-PARP in cells treated as described in (A, B). Western blot results were subjected to densitometric scanning and normalized to Actin expression. Protein expression under control conditions was set as 1 for comparison and is shown below the blots. D Loss of mitochondrial membrane potential (ΔΨm) as determined by flow cytometry in primary blasts from patient ALL#2 after 24 h of treatment with PD0325901 (0.5 μM) and/or ATO (2 μM) or Imatinib (1 μM). E Relative levels of cell death in Ba/F3p210T315I cells and K562-R cells subjected to the above drug treatments following siRNA knockdown of TA-p73 or ΔN-p73 or transfection with a non-targeting control siRNA (Control), as determined by flow cytometric analysis of Annexin V-FITC/PI staining. Values represent means ± SD of three independent experiments (*p < 0.02, #p < 0.05 TA-p73 or ΔN-p73 siRNA condition vs. control siRNA condition, Tukey–Kramer tests). Transfected cells were subjected to western blot analysis to monitor TA-p73α + β or ΔN-p73 silencing.

