

Abstract
There is increasing recognition that socioeconomic inequalities contribute to disparities in brain and cognitive health in older adults. However, whether neighborhood socioeconomic status (SES) buffers individuals with low individual SES against neurodegeneration, cerebrovascular disease, and poorer cognitive function is not well understood. Here, we evaluated whether neighborhood deprivation (Townsend deprivation index) interacted with individual SES (composite household income and education levels) on hippocampus volume, regional cortical thickness, white matter hyperintensities, and cognition in 19,638 individuals (mean age = 54.8) from the UK Biobank. We found that individuals with low individual SES had the smallest hippocampal volumes, greatest white matter hyperintensity burden, and poorest cognition if they were living in high deprivation neighborhoods but that these deleterious effects on brain and cognitive function were attenuated if they were living in low deprivation neighborhoods (p for interactions < .05). While neighborhood deprivation did not interact with individual SES to influence regional cortical thickness, higher neighborhood deprivation was independently associated with lower cortical thickness in 16 regions (false discovery rate q < .05). Across multiple brain indices and cognitive function analyses, we found converging evidence suggesting that low neighborhood deprivation may have a neuroprotective effect against neurodegeneration, cerebrovascular pathology, and cognitive impairment, particularly in vulnerable individuals with low household income and education levels.
Keywords: Hippocampus, Neurodegeneration, Cognition, White matter lesions, Socioeconomic status, Neighborhood deprivation
Introduction
Socioeconomic disparities have been found to contribute to differences in brain health in older adults [1] and are associated with poorer cognitive function [2–6] and greater dementia incidence [7, 8]. Neuroimaging studies focusing on older adults have also examined socioeconomic status (SES)-brain relationships, with most finding that higher individual SES such as income and/or education levels is neuroprotective and associated with larger total brain volume [9, 10], hippocampus volume [11–13], greater cortical thickness [14–16], white matter integrity [17], and white matter lesions [10]. However, some studies have also reported no or reverse associations between individual SES and neuroimaging markers [16, 18, 19].
Beyond individual SES measures, some studies have also highlighted the role of neighborhood SES on brain health in older adults. Neighborhood disadvantage was found to be associated with lower robustness in brain morphological networks [20], greater Alzheimer’s neuropathology [21], and brain atrophy [22]. Taken together, these studies support the idea that SES, as a multidimensional construct, composes of a complex bundle of imperfectly correlated economic and social factors [23, 24] that may affect health outcomes interactively. While the presence of interactions between neighborhood and individual SES on other health outcomes such as cardiovascular health [25], mortality [26], and self-reported general and mental health [27] has been previously investigated, whether and how neighborhood SES interact with individual SES to influence brain and cognitive health that are implicated in neurodegenerative diseases are not well-understood.
In this study, we leveraged on a large sample of adults from the UK Biobank to test whether low neighborhood deprivation (Townsend deprivation index) buffers individuals with lower individual SES (composite of household income and education) against neurodegeneration (hippocampus volume, regional cortical thickness), white matter hyperintensities (WMH) of presumed vascular origins, and lower fluid intelligence. We hypothesize that the deleterious effects on brain and cognitive health of both low neighborhood and individual-level SES compound with each other but would be attenuated for low individual SES individuals who are living in less deprived neighborhoods.
Methods
Participants
The UK Biobank (https://biobank.ndph.ox.ac.uk/) recruited more than 500,000 individuals aged between 40 and 69 years old from the years 2006–2010. The UK Biobank study has research ethics approved by the North West Multi-centre Research Ethics Committee (21/NW/0157). Participants underwent comprehensive evaluation and provided blood, urine and saliva samples, and other health and neuroimaging data to improve our understanding of a wide variety of diseases. In our study, we determined the sample sizes based on the number of individuals who had complete data on the key variables of interests, namely neighborhood and individual level SES, neuroimaging data for extracting of hippocampus volume, regional cortical thickness, white matter hyperintensities, and fluid intelligence. Demographics based on 19,638 individuals included in the study are summarized in Table 1.
Table 1.
Demographics of individuals
| Age at baseline, years (mean ± SD) | 54.76 (7.47) |
| Females, n (%) | 10,006 (50.95) |
| Townsend deprivation index (mean ± SD) | − 1.99 (2.64) |
| Household income | |
| Less than 18,000, n (%) | 2504 (12.75) |
| 18,000 to 30,999, n (%) | 4581 (23.33) |
| 31,000 to 51,999, n (%) | 6102 (31.07) |
| 52,000 to 100,000, n (%) | 5255 (27.47) |
| Greater than 100,000, n (%) | 1196 (6.49) |
| Years of education (mean ± SD) | 15.57 (4.74) |
| Hippocampus volume (mean ± SD) | 8126 (801) |
| White matter hyperintensities volume (mean ± SD) | 7.91 (0.99) |
| Fluid intelligence (mean ± SD) | 6.80 (2.06) |
SES
We assessed neighborhood SES with the Townsend deprivation index calculated at first visit. The Townsend deprivation index was calculated by incorporating data on unemployment, car ownership, home ownership, and household overcrowding [28]. Similar to prior studies [29, 30], we recoded Townsend deprivation index into quintiles, with higher quintiles corresponding to higher deprivation and hence lower neighborhood SES. We assessed individual SES with 2 variables: average total household income before taxes and highest attained education qualification at first visit. The 5 levels of household income are “Less than 18,000,” “18,000 to 30,999,” “31,000 to 51,999,” “52,000 to 100,000,” and “Greater than 100,000.” Following the International Standard Classification of Education (ISCED) and as used in other studies [31, 32], education qualification were converted to years of education based on the following conversion: “None of the above (7 years),” “CSEs or equivalent (10 years),” “O levels/GCSEs or equivalent (10 years),” “A levels/AS levels or equivalent (13 years),” “Other professional qualifications (15 years), “NVQ or HND or HNC or equivalent (19 years)” and “College or University degree (20 years).” Household income and education levels were correlated (r(19,636) = 0.28, p < 2.2 × 10⁻¹⁶), and we derived a composite individual SES measure by averaging the z scores of household income and education [33].
MRI
In brief, magnetic resonance imaging scans were performed on identical 3 T Siemens Skyra scanners with a standard Siemens 32-channel head coil. T1-weighted (1 × 1 × 1 mm, 208 × 256 × 256 matrix, TI/TR = 880/2000 ms) scans were processed through Freesurfer 6.0. We extracted hippocampus volume from the subcortical segmentation and estimated intracranial volume as a covariate. For regional indices, we extracted cortical thickness from 33 regions of interest (ROI) available based on the parcellation from the Desikan-Killiany atlas [34] and we averaged right and left hemisphere for each of the regional cortical thickness measures [35] prior to statistical analysis to reduce multiple comparisons. White matter hyperintensity volumes were derived from T2-weighted FLAIR structural imaging with a resolution of 1.05 × 1 × 1 mm and field of view 192 × 256 × 256 matrix. The lesion segmentation was processed automatically using BIANCA [36]. These post-processed data were directly extracted from the UK Biobank, and no manual editing of the segmentation and parcellations was conducted by the authors. Further details of the MRI sequences, processing, and quality control procedures have been previously described [37].
Cognition
The assessment of fluid intelligence that captures the individual’s capacity to use logic and reasoning to solve problems was conducted using a touch screen. Participants were required to complete as many questions as possible within a 2-min timeframe. The test required participants to answer 13 questions relating to conditional arithmetic, word interpolation, square sequence recognition, and subset inclusion logic, among others. A maximum score of 13 points can be achieved. Descriptions of the fluid intelligence assessment can be found on UK Biobank.
Statistical analysis
We conducted multiple linear regression to evaluate whether neighborhood SES (Townsend deprivation index) interacted with composite individual SES (household income and education) to influence neurodegeneration (hippocampus volume, regional cortical thickness), cerebrovascular disease (WMH volume), and fluid intelligence in separate models. For volumetric measures (hippocampus and WMH) that scales with general head size, we controlled for age at first visit and at MRI scan, sex, and also intracranial volume. Intracranial volume was not included as a covariate for the regional cortical thickness analyses and fluid intelligence analyses. For the regional cortical thickness analyses involving 33 regions of interest (ROIs), we additionally controlled for multiple comparisons at a false discovery rate (FDR) of q < 0.05. The dependent variables and Townsend deprivation index were scaled prior to analyses to generate standardized estimates. All interactions models included based terms (i.e., Townsend deprivation index and individual SES). If the interactions were statistically significant, we then conducted simple slopes analyses to determine what is driving the interaction. If the interaction was not significant, we conducted the multiple linear regression without the interaction term to determine if neighborhood deprivation was associated with the brain and cognitive variables, independent of composite individual-level SES and relevant covariates. For the interaction models, we additionally conducted Monte Carlo cross-validation to examine generalizability of the models, using 200 repetitions and 80:20 split for training and testing set respectively in each repetition [38]. All statistical analyses were conducted using R 4.2.2.
Results
Interactions of neighborhood deprivation and individual SES on neurodegeneration
The interaction of Townsend deprivation index with composite individual SES was statistically significant for hippocampus volume (β = 0.015, SE = 0.07, p < 0.05; Fig. 1A). Simple slope analyses revealed that for individuals living in high deprivation neighborhoods, higher individual SES individuals had larger hippocampus volume (β = 0.05, SE = 0.01, p < 0.01) than lower individual SES individuals. However, for individuals living in low deprivation neighborhoods, there were no differences in hippocampus volume between individuals with higher or lower individual SES (β = 0.02, SE = 0.01, p = 0.12). The prediction accuracy of the model (R2 = 0.3974) was very similar to the averaged Monte Carlo cross-validated models (R2 = 0.3972). We did not find any statistically significant interaction of neighborhood deprivation and individual SES on any of the 33 regional cortical thickness (p for all interactions > 0.05 and FDR q > 0.98).
Fig. 1.

Interaction between neighborhood and individual socioeconomic status (SES) on hippocampus volume (A) and white matter hyperintensities (B). Individuals with low individual level SES had the smallest hippocampus volume and greatest WMH burden if they were living in high deprivation areas. These effects were attenuated if they were living in less deprived neighborhoods
Interactions of neighborhood deprivation and individual SES on cerebrovascular disease
Townsend deprivation index also interacted with individual SES on WMH volume (β = − 0.016, SE = 0.008, p < 0.05; Fig. 1B). Analyses of the simple slopes revealed that for individuals in high deprivation neighborhoods, higher individual SES individuals had lower WMH volume (β = − 0.09, SE = 0.01, p < 0.001), indicating better cerebrovascular health, than lower individual SES individuals. For individuals living in low deprivation neighborhoods, a statistically significant difference in WMH volume was found between individuals with higher or lower individual SES, but these effects were significantly attenuated (β = − 0.06, SE = 0.01, p < 0.001). The prediction accuracy of the model (R2 = 0.2693) was also very similar to the averaged Monte Carlo cross-validated models (R2 = 0.2688).
Interactions of neighborhood deprivation and individual SES on cognition
Lastly, we found a significant interaction of Townsend deprivation index with composite individual SES on cognition as quantified by fluid intelligence (β = 0.014, SE = 0.007, p < 0.05). Simple slope analyses showed a similar pattern as WMH volume, such that for individuals in high deprivation neighborhoods, higher individual SES individuals had better cognitive function (β = 0.39, SE = 0.01, p < 0.001) than lower individual SES individuals. For individuals living in low deprivation neighborhoods, a statistically significant difference in cognitive function between individuals with higher or lower individual SES persisted, but these effects were also significantly attenuated (β = 0.35, SE = 0.01, p < 0.001). The prediction accuracy of the model (R2 = 0.1115) was also very similar to the averaged Monte Carlo cross-validated models (R2 = 0.1102).
Independent associations of neighborhood deprivation and individual SES on regional cortical thickness
Given that no statistically significant interactions (p > 0.05) between neighborhood deprivation and individual SES on regional cortical thickness were found, we proceeded to evaluate whether neighborhood deprivation and individual SES were associated with regional cortical thickness, independent of individual SES without the interaction term. The results showed that greater neighborhood deprivation was associated with lower cortical thickness in 18 out of 33 regions (p < 0.05). After correcting for multiple comparisons, 16 cortical regions remained statistically significant (FDR q < 0.05; Table 2; Fig. 2). Individual SES was also independently associated with cortical regions in 16 regions (p < 0.05), of which 11 regions survived correction for multiple correction (FDR q < 0.05). Of the 11 statistically significant regions, 6 showed positive associations and 5 were negative (Table 2).
Table 2.
Independent associations of neighborhood deprivation and individual SES with regional cortical thickness
| Region of interest (ROI) | Neighborhood deprivation | Individual SES | ||
|---|---|---|---|---|
| t value | FDR- adjusted q |
t value | FDR- adjusted q |
|
| Banks of the superior temporal sulcus | − 2.44 | 0.034 | 2.98 | 0.015 |
| Caudal anterior cingulate | 0.32 | 0.770 | − 0.05 | 0.957 |
| Caudal middle frontal | − 2.52 | 0.030 | 1.45 | 0.231 |
| Cuneus | 0.64 | 0.613 | − 2.3 | 0.054 |
| Entorhinal | − 1.00 | 0.405 | 1.61 | 0.186 |
| Fusiform | − 2.36 | 0.037 | 2.13 | 0.073 |
| Inferior parietal | − 3.67 | 0.004 | 0.21 | 0.884 |
| Inferior temporal | − 1.00 | 0.405 | 3.2 | 0.010 |
| Isthmus cingulate | − 1.74 | 0.136 | − 3.45 | 0.006 |
| Lateral orbitofrontal | − 1.4 | 0.231 | − 2.91 | 0.015 |
| Lateral occipital | − 2.2 | 0.054 | − 0.13 | 0.921 |
| Lingual | 0.61 | 0.613 | − 1.3 | 0.290 |
| Medial orbitofrontal | − 2.55 | 0.030 | − 1.52 | 0.213 |
| Middle temporal | − 1.89 | 0.102 | 2.31 | 0.054 |
| Paracentral | − 0.36 | 0.767 | 2.51 | 0.037 |
| Parahippocampal | − 0.59 | 0.613 | 0.31 | 0.831 |
| Pars opercularis | − 2.55 | 0.030 | 2.77 | 0.021 |
| Pars orbitalis | − 3.07 | 0.010 | − 0.97 | 0.420 |
| Pars triangularis | − 3.37 | 0.008 | − 0.86 | 0.474 |
| Pericalcarine | − 0.87 | 0.466 | − 3.17 | 0.010 |
| Postcentral | − 2.42 | 0.034 | − 0.4 | 0.782 |
| Posterior cingulate | − 3.06 | 0.010 | − 2.27 | 0.054 |
| Precentral | − 2.04 | 0.076 | 2.91 | 0.015 |
| Precuneus | − 2.79 | 0.020 | 0.98 | 0.420 |
| Rostral anterior cingulate | − 1.26 | 0.287 | − 2.62 | 0.029 |
| Rostral middle frontal | − 2.94 | 0.013 | − 1.61 | 0.186 |
| Superior frontal | − 3.25 | 0.009 | − 1.02 | 0.420 |
| Superior parietal | − 3.22 | 0.009 | − 1.24 | 0.307 |
| Superior temporal | − 2.63 | 0.028 | 4.63 | < 0.001 |
| Supramarginal | − 3.92 | 0.003 | 0.61 | 0.636 |
| Frontal pole | − 1.44 | 0.227 | − 5.57 | < 0.001 |
| Transverse temporal | 0.01 | 0.995 | 1.72 | 0.167 |
| Insula | -1.53 | 0.197 | 2.1 | 0.074 |
Bold: q < .05
Fig. 2.
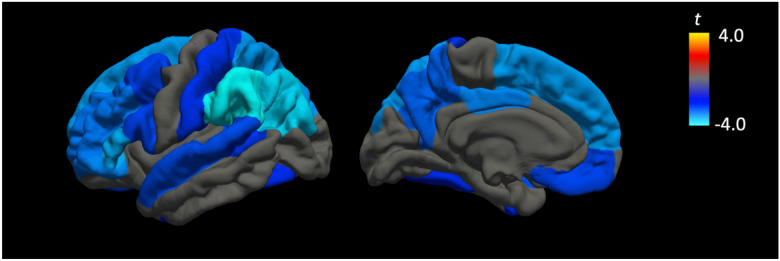
Independent associations of higher neighborhood deprivation beyond individual level SES measures on lower regional cortical thickness. The strongest negative associations were found in frontoparietal regions. All colored regions survived correction for multiple comparisons at a false discovery rate (FDR) of q < .05
Discussion
In this large sample of middle-aged and older adults, we demonstrate that lower neighborhood deprivation buffers against the negative effects of low individual SES on neural markers of hippocampal neurodegeneration, cerebrovascular disease, and cognitive performance. Specifically, differences in brain and cognitive health due to individual SES differences were most pronounced for individuals living in deprived neighborhoods but were attenuated for individuals who were living in less deprived areas. In addition, while no interactions on regional cortical thickness were found, neighborhood SES was independently associated with cortical thickness in multiple regions, even after correcting for multiple corrections. Our collective findings support the role of neighborhood SES as a neuroprotective factor against proliferation of age-related brain pathology and cognitive impairment in middle-aged and older adults.
Our findings are consistent with existing studies investigating the interaction of neighborhood and individual SES on health outcomes [25–27], generally showing a compounding negative effect of both low individual and low neighborhood SES on health. A recent longitudinal study computed a global composite of both individual and neighborhood SES and reported that it was associated with progression to mild cognitive impairment over a seven year period [39], supporting the role of both SES measures on clinical decline. Importantly, our study expands upon these findings by linking the interactive effects of neighborhood and individual SES to biological cerebral markers. The hippocampus is a key structure implicated in age-related memory loss and neurodegenerative diseases such as Alzheimer’s disease [40], and our findings suggest that lower neighborhood deprivation may exert a salubrious effect against hippocampal atrophy, particularly for low SES individuals.
Beyond hippocampal neurodegeneration, we also found evidence of an interactive effect on cerebrovascular health as measured by WMH volume. The presence of mixed pathology such as the combination of Alzheimer’s and cerebrovascular pathology increases with age and is considered the norm [41], especially in the oldest old [42]. Studies have also shown that the combination of both neurodegenerative and cerebrovascular pathologies best predicted multi-domain cognitive performance [43] and doubles the risk of dementia compared to individuals with pure degenerative pathologies [44]. Our significant interaction findings in both pathologies suggest that the neuroprotective effects of neighborhood SES may be conferred on both age-related neurodegenerative and cerebrovascular pathological pathways. We also found significant interactions on cognitive function beyond neural markers, demonstrating a convergence of evidence at both the neural and cognitive level. Overall, our results are also in agreement with the general idea of the double jeopardy to health hypothesis (e.g., [45]), where we demonstrate that the confluence of two negative exposures are associated with poorer brain and cognitive health outcomes.
While regional cortical thickness may represent brain structural integrity at a more precise level than global hippocampal volume, in our study, we only found an interaction effect of neighborhood and individual SES on hippocampus volume but not regional cortical thickness. This may suggest that while the multidimensional measure of neighborhood SES attenuates the negative effects of individual SES on brain structural health, this effect may be apparent only in larger volumetric regions such as the hippocampus but not conferred on specific cortical regions with distinct cytoarchitectural and functional properties. However, we found robust associations between greater neighborhood deprivation and lower cortical thickness in 16 regions that were independent of individual SES, even after correcting for multiple comparisons, indicating that neighborhood deprivation may be precise enough to affect distinct regional neocortical thickness, albeit not interactively with individual SES.
These associations were strongest in the frontoparietal regions and show substantial overlap with the default mode network and frontoparietal control network. These large-scale functional networks of the cerebral cortex have also been implicated in aging and Alzheimer’s disease [46–48], suggesting that neighborhood SES may be preferentially associated with degradation in structural and functional connectivity in age-related vulnerable regions, beyond individual SES. In addition, 8 statistically significant regions (inferior parietal, pars opercularis, pars orbitalis, pars triangularis, precuneus, supramarginal gyrus, superior parietal, and superior frontal) are putative Alzheimer’s associated cortical thinning signature regions [49]. Frontoparietal regions have also been previously implicated with measures of cerebrovascular health such as cerebral arterial elasticity [50]. When considered together with studies showing associations of SES with cardiovascular outcomes [25, 26, 51], future studies may further elucidate whether the interaction between SES and cortical thickness in vulnerable regions is mediated by cardiovascular and/or cerebrovascular health.
In our study, we also found independent associations of individual SES on regional cortical thickness in 11 regions. However, unlike neighborhood SES where we found consistent negative associations of greater neighborhood deprivation with cortical thickness, higher individual SES was associated with greater thickness in 6 regions but lower thickness in 5 regions. The presence of heterogeneous results between individual SES and global brain indices in individuals across the lifespan has also been previously reported [19] and may be reflective of heterogeneity in the estimation of individual SES levels such as education levels that do not fully account for the qualitative aspect of education or heterogeneity in estimating individual-level income effects based on average household income.
Our study is also limited by using only objective measures of SES. Given that subjective SES has been found to be associated with health-related factors [33] and brain morphology [52], future research investigations may further shed light on potential independent and interactive effects of both objective and subjective SES measures on brain and cognitive health. In addition, while the interaction effects were statistically significant and the models were robust to cross-validation, the simple effects were small corresponding to ~ 1% and ~ 2.5% difference in neural and cognitive outcomes, respectively. The difference between hippocampal atrophy rates of stable MCI versus converters to AD dementia has been found in a previous study to be about 0.9% (2.8% vs 3.7%) [53], suggesting that even small percentage differences in neurodegeneration may be meaningful. The presence of “healthy volunteer” selection bias in the UK Biobank [54] may also suggest that larger effects may be present in the general population who are likely to belong to a broader spectrum of SES levels, brain, and cognitive health. The measures of SES used in the current study were also quantified at a moment in time; while education levels are unlikely to vary substantially in middle-aged and older adults, household income and neighborhood deprivation may change over time. Future longitudinal studies will be required to further clarify whether changes in neighborhood and/or individual SES affects rates of cerebral atrophy, cerebrovascular pathology, and cognitive decline to better establish the presence of causative relationships. Lastly, given that higher Alzheimer’s disease polygenic risk have been found to be associated with greater rates of cognitive decline and neurodegeneration even in preclinical individuals [55, 56], future studies may examine gene and environment interactions [57] by evaluating whether neighborhood and/or individual SES can serve as buffer against higher Alzheimer’s genetic risk.
In conclusion, our study supports the presence of interactive effects of neighborhood and individual SES on brain and cognitive health, suggesting that the evaluation and consideration of these factors may be of relevance for understanding disease progression in neurodegenerative diseases such as Alzheimer’s disease. While interventions are typically targeted at the individual level, our findings suggest that broader interventions at the neighborhood level may also confer beneficial effects, particularly for vulnerable individuals with low household income and/or education attainment. Expanding on existing understanding of genetic risk and biomarkers profiles of neurodegenerative diseases, our study suggests that elucidating the effects of SES at both the individual and neighborhood level may further enhance our ability to identify individuals with the highest burden of neurodegenerative and cerebrovascular pathologies that may lead to downstream cognitive decline.
Funding
This study was supported by Nanyang Technological University, Singapore Start-Up Grant M40824100 and MOE AcRF Tier 1 M4012193.
Declarations
Competing interests
The authors declare no competing interests.
Footnotes
Publisher's note
Springer Nature remains neutral with regard to jurisdictional claims in published maps and institutional affiliations.
References
- 1.Resende EPF, Llibre Guerra JJ, Miller BL. Health and socioeconomic inequities as contributors to brain health. JAMA Neurol. 2019;76(6):633–634. doi: 10.1001/jamaneurol.2019.0362. [DOI] [PMC free article] [PubMed] [Google Scholar]
- 2.Zhang Z, Zhao Y, Bian Y. A role of socioeconomic status in cognitive impairment among older adults in Macau: a decomposition approach. Front Aging Neurosci. 2022;14:804307. doi: 10.3389/fnagi.2022.804307. [DOI] [PMC free article] [PubMed] [Google Scholar]
- 3.Muhammad T, Sekher T, Srivastava S. Association of objective and subjective socioeconomic markers with cognitive impairment among older adults: cross-sectional evidence from a developing country. BMJ Open. 2022;12(8):e052501. doi: 10.1136/bmjopen-2021-052501. [DOI] [PMC free article] [PubMed] [Google Scholar]
- 4.Peterson RL, George KM, Gilsanz P, Mayeda ER, Glymour MM, Meyer OL, et al. Lifecourse socioeconomic changes and late-life cognition in a cohort of U.S.-born and U.S. immigrants: findings from the KHANDLE study. BMC Public Health. 2021;21(1):920. doi: 10.1186/s12889-021-10976-6. [DOI] [PMC free article] [PubMed] [Google Scholar]
- 5.Pase MP, Rowsthorn E, Cavuoto MG, Lavale A, Yassi N, Maruff P, et al. Association of neighborhood-level socioeconomic measures with cognition and dementia risk in Australian adults. JAMA Netw Open. 2022;5(3):e22407. doi: 10.1001/jamanetworkopen.2022.4071. [DOI] [PMC free article] [PubMed] [Google Scholar]
- 6.Yang L, Martikainen P, Silventoinen K, Konttinen H. Association of socioeconomic status and cognitive functioning change among elderly Chinese people. Age Ageing. 2016;45(5):674–680. doi: 10.1093/ageing/afw107. [DOI] [PubMed] [Google Scholar]
- 7.Samuel LJ, Szanton SL, Wolff JL, Ornstein KA, Parker LJ, Gitlin LN. Socioeconomic disparities in six-year incident dementia in a nationally representative cohort of U.S. older adults: an examination of financial resources. BMC Geriatrics. 2020;20(1):156. doi: 10.1186/s12877-020-01553-4. [DOI] [PMC free article] [PubMed] [Google Scholar]
- 8.Yaffe K, Falvey C, Harris TB, Newman A, Satterfield S, Koster A, et al. Effect of socioeconomic disparities on incidence of dementia among biracial older adults: prospective study. BMJ : Br Med J. 2013;347:f7051. doi: 10.1136/bmj.f7051. [DOI] [PMC free article] [PubMed] [Google Scholar]
- 9.Dougherty RJ, Moonen J, Yaffe K, Sidney S, Davatzikos C, Habes M, et al. Smoking mediates the relationship between SES and brain volume: the CARDIA study. PLOS ONE. 2020;15(9):e0239548. doi: 10.1371/journal.pone.0239548. [DOI] [PMC free article] [PubMed] [Google Scholar]
- 10.Waldstein SR, Dore GA, Davatzikos C, Katzel LI, Gullapalli R, Seliger SL, et al. Differential associations of socioeconomic status with global brain volumes and white matter lesions in African American and White adults: the HANDLS SCAN Study. Psychosom Med. 2017;79(3):327–335. doi: 10.1097/psy.0000000000000408. [DOI] [PMC free article] [PubMed] [Google Scholar]
- 11.Elbejjani M, Fuhrer R, Abrahamowicz M, Mazoyer B, Crivello F, Tzourio C, et al. Life-course socioeconomic position and hippocampal atrophy in a prospective cohort of older adults. Psychosom Med. 2017;79(1):14–23. doi: 10.1097/psy.0000000000000365. [DOI] [PubMed] [Google Scholar]
- 12.Noble K, Grieve S, Korgaonkar M, Engelhardt L, Griffith E, Williams L, et al. Hippocampal volume varies with educational attainment across the life-span. Front Hum Neurosci. 2012;6:307. doi: 10.3389/fnhum.2012.00307. [DOI] [PMC free article] [PubMed] [Google Scholar]
- 13.Butterworth P, Cherbuin N, Sachdev P, Anstey KJ. The association between financial hardship and amygdala and hippocampal volumes: results from the PATH through life project. Soc Cogn Affect Neurosci. 2012;7(5):548–556. doi: 10.1093/scan/nsr027. [DOI] [PMC free article] [PubMed] [Google Scholar]
- 14.Chan MY, Na J, Agres PF, Savalia NK, Park DC, Wig GS. Socioeconomic status moderates age-related differences in the brain’s functional network organization and anatomy across the adult lifespan. Proc Natl Acad Sci. 2018;115(22):E5144–E5153. doi: 10.1073/pnas.1714021115. [DOI] [PMC free article] [PubMed] [Google Scholar]
- 15.Kim JP, Seo SW, Shin HY, Ye BS, Yang JJ, Kim C, et al. Effects of education on aging-related cortical thinning among cognitively normal individuals. Neurology. 2015;85(9):806–812. doi: 10.1212/wnl.0000000000001884. [DOI] [PubMed] [Google Scholar]
- 16.Liu Y, Julkunen V, Paajanen T, Westman E, Wahlund L-O, Aitken A, et al. Education increases reserve against Alzheimer’s disease—evidence from structural MRI analysis. Neuroradiology. 2012;54(9):929–938. doi: 10.1007/s00234-012-1005-0. [DOI] [PMC free article] [PubMed] [Google Scholar]
- 17.Shaked D, Leibel DK, Katzel LI, Davatzikos C, Gullapalli RP, Seliger SL, et al. Disparities in diffuse cortical white matter integrity between socioeconomic groups. Front Human Neurosci. 2019;13:198. doi: 10.3389/fnhum.2019.00198. [DOI] [PMC free article] [PubMed] [Google Scholar]
- 18.Fotenos AF, Mintun MA, Snyder AZ, Morris JC, Buckner RL. Brain volume decline in aging: evidence for a relation between socioeconomic status, preclinical Alzheimer disease, and reserve. Arch Neurol. 2008;65(1):113–120. doi: 10.1001/archneurol.2007.27. [DOI] [PubMed] [Google Scholar]
- 19.Walhovd KB, Fjell AM, Wang Y, Amlien IK, Mowinckel AM, Lindenberger U, et al. Education and income show heterogeneous relationships to lifespan brain and cognitive differences across European and US cohorts. Cereb Cortex. 2021;32(4):839–854. doi: 10.1093/cercor/bhab248. [DOI] [PMC free article] [PubMed] [Google Scholar]
- 20.Krishnadas R, Kim J, McLean J, Batty D, McLean J, Millar K, et al. The envirome and the connectome: exploring the structural noise in the human brain associated with socioeconomic deprivation. Front Hum Neurosci. 2013;7:722. doi: 10.3389/fnhum.2013.00722. [DOI] [PMC free article] [PubMed] [Google Scholar]
- 21.Hamilton CA, Matthews FE, Erskine D, Attems J, Thomas AJ. Neurodegenerative brain changes are associated with area deprivation in the United Kingdom: findings from the Brains for Dementia Research study. Acta Neuropathol Commun. 2021;9(1):198. doi: 10.1186/s40478-021-01301-8. [DOI] [PMC free article] [PubMed] [Google Scholar]
- 22.Hunt JFV, Buckingham W, Kim AJ, Oh J, Vogt NM, Jonaitis EM, et al. Association of neighborhood-level disadvantage with cerebral and hippocampal volume. JAMA Neurol. 2020;77(4):451–460. doi: 10.1001/jamaneurol.2019.4501. [DOI] [PMC free article] [PubMed] [Google Scholar]
- 23.Farah MJ. The neuroscience of socioeconomic status: correlates, causes, and consequences. Neuron. 2017;96(1):56–71. doi: 10.1016/j.neuron.2017.08.034. [DOI] [PubMed] [Google Scholar]
- 24.Tan JJX, Kraus MW, Carpenter NC, Adler NE. The association between objective and subjective socioeconomic status and subjective well-being: a meta-analytic review. Psychol Bull. 2020;146(11):970–1020. doi: 10.1037/bul0000258. [DOI] [PubMed] [Google Scholar]
- 25.Boylan JM, Robert SA. Neighborhood SES is particularly important to the cardiovascular health of low SES individuals. Soc Sci Med. 2017;188:60–68. doi: 10.1016/j.socscimed.2017.07.005. [DOI] [PMC free article] [PubMed] [Google Scholar]
- 26.Borrell LN, Diez Roux AV, Rose K, Catellier D, Clark BL. Neighbourhood characteristics and mortality in the Atherosclerosis Risk in Communities Study. Int J Epidemiol. 2004;33(2):398–407. doi: 10.1093/ije/dyh063. [DOI] [PubMed] [Google Scholar]
- 27.Stafford M, Marmot M. Neighbourhood deprivation and health: does it affect us all equally? Int J Epidemiol. 2003;32(3):357–366. doi: 10.1093/ije/dyg084. [DOI] [PubMed] [Google Scholar]
- 28.Townsend P, Phillimore P, Beattie A. Health and deprivation: inequality and the North. Routledge; 1988. [Google Scholar]
- 29.Foster HME, Celis-Morales CA, Nicholl BI, Petermann-Rocha F, Pell JP, Gill JMR, et al. The effect of socioeconomic deprivation on the association between an extended measurement of unhealthy lifestyle factors and health outcomes: a prospective analysis of the UK Biobank cohort. Lancet Pub Health. 2018;3(12):e576–e585. doi: 10.1016/S2468-2667(18)30200-7. [DOI] [PubMed] [Google Scholar]
- 30.Rask-Andersen M, Karlsson T, Ek WE, Johansson Å. Modification of heritability for educational attainment and fluid intelligence by socioeconomic deprivation in the UK Biobank. Am J Psychiatry. 2021;178(7):625–634. doi: 10.1176/appi.ajp.2020.20040462. [DOI] [PubMed] [Google Scholar]
- 31.Lee JJ, Wedow R, Okbay A, Kong E, Maghzian O, Zacher M, et al. Gene discovery and polygenic prediction from a genome-wide association study of educational attainment in 1.1 million individuals. Nat Genet. 2018;50(8):1112–21. doi: 10.1038/s41588-018-0147-3. [DOI] [PMC free article] [PubMed] [Google Scholar]
- 32.Ge T, Chen CY, Doyle AE, Vettermann R, Tuominen LJ, Holt DJ, et al. The shared genetic basis of educational attainment and cerebral cortical morphology. Cereb Cortex. 2019;29(8):3471–3481. doi: 10.1093/cercor/bhy216. [DOI] [PMC free article] [PubMed] [Google Scholar]
- 33.Adler NE, Epel ES, Castellazzo G, Ickovics JR. Relationship of subjective and objective social status with psychological and physiological functioning: preliminary data in healthy white women. Health Psychol. 2000;19(6):586–592. doi: 10.1037//0278-6133.19.6.586. [DOI] [PubMed] [Google Scholar]
- 34.Desikan RS, Segonne F, Fischl B, Quinn BT, Dickerson BC, Blacker D, et al. An automated labeling system for subdividing the human cerebral cortex on MRI scans into gyral based regions of interest. Neuroimage. 2006;31(3):968–980. doi: 10.1016/j.neuroimage.2006.01.021. [DOI] [PubMed] [Google Scholar]
- 35.Tan CH, Chew J, Zhang L, Gulyás B, Chen C. Differential effects of white matter hyperintensities and regional amyloid deposition on regional cortical thickness. Neurobiol Aging. 2022;115:12–19. doi: 10.1016/j.neurobiolaging.2022.03.013. [DOI] [PubMed] [Google Scholar]
- 36.Griffanti L, Douaud G, Bijsterbosch J, Evangelisti S, Alfaro-Almagro F, Glasser MF, et al. Hand classification of fMRI ICA noise components. Neuroimage. 2017;154:188–205. doi: 10.1016/j.neuroimage.2016.12.036. [DOI] [PMC free article] [PubMed] [Google Scholar]
- 37.Alfaro-Almagro F, Jenkinson M, Bangerter NK, Andersson JLR, Griffanti L, Douaud G, et al. Image processing and quality control for the first 10,000 brain imaging datasets from UK Biobank. Neuroimage. 2018;166:400–424. doi: 10.1016/j.neuroimage.2017.10.034. [DOI] [PMC free article] [PubMed] [Google Scholar]
- 38.Song QC, Tang C, Wee S. Making sense of model generalizability: a tutorial on cross-validation in R and Shiny. Adv Methods Pract Psychol Sci. 2021;4(1):2515245920947067. doi: 10.1177/2515245920947067. [DOI] [Google Scholar]
- 39.Fernández-Blázquez MA, Noriega-Ruiz B, Ávila-Villanueva M, Valentí-Soler M, Frades-Payo B, Del Ser T, et al. Impact of individual and neighborhood dimensions of socioeconomic status on the prevalence of mild cognitive impairment over seven-year follow-up. Aging Ment Health. 2021;25(5):814–823. doi: 10.1080/13607863.2020.1725803. [DOI] [PubMed] [Google Scholar]
- 40.Chen P, Guo Z, Zhou B. Insight into the role of adult hippocampal neurogenesis in aging and Alzheimer’s disease. Ageing Res Rev. 2023;84:101828. doi: 10.1016/j.arr.2022.101828. [DOI] [PubMed] [Google Scholar]
- 41.As A. 2021 Alzheimer’s disease facts and figures. Alzheimers Dement. 2021;17(3):327–406. doi: 10.1002/alz.12328. [DOI] [PubMed] [Google Scholar]
- 42.James BD, Bennett DA, Boyle PA, Leurgans S, Schneider JA. Dementia from Alzheimer disease and mixed pathologies in the oldest old. JAMA. 2012;307(17):1798–1800. doi: 10.1001/jama.2012.3556. [DOI] [PMC free article] [PubMed] [Google Scholar]
- 43.Tan CH, Hilal S, Xu X, Vrooman H, Cheng CY, Wong TY, et al. MRI markers of mixed pathology and cognitive impairment in multiethnic Asians. J Alzheimers Dis. 2020;73(4):1501–1509. doi: 10.3233/jad-190866. [DOI] [PubMed] [Google Scholar]
- 44.Azarpazhooh MR, Avan A, Cipriano LE, Munoz DG, Sposato LA, Hachinski V. Concomitant vascular and neurodegenerative pathologies double the risk of dementia. Alzheimers Dement. 2018;14(2):148–156. doi: 10.1016/j.jalz.2017.07.755. [DOI] [PubMed] [Google Scholar]
- 45.Ferraro KF, Farmer MM. Double jeopardy, aging as leveler, or persistent health inequality? A longitudinal analysis of White and Black Americans. J Gerontol: Ser B. 1996;51B(6):S319–S328. doi: 10.1093/geronb/51B.6.S319. [DOI] [PubMed] [Google Scholar]
- 46.Greicius MD, Srivastava G, Reiss AL, Menon V. Default-mode network activity distinguishes Alzheimer’s disease from healthy aging: evidence from functional MRI. Proc Natl Acad Sci U S A. 2004;101(13):4637–4642. doi: 10.1073/pnas.0308627101. [DOI] [PMC free article] [PubMed] [Google Scholar]
- 47.Chan MY, Han L, Carreno CA, Zhang Z, Rodriguez RM, LaRose M, et al. Long-term prognosis and educational determinants of brain network decline in older adult individuals. Nature Aging. 2021;1(11):1053–1067. doi: 10.1038/s43587-021-00125-4. [DOI] [PMC free article] [PubMed] [Google Scholar]
- 48.Kong TS, Gratton C, Low KA, Tan CH, Chiarelli AM, Fletcher MA, et al. Age-related differences in functional brain network segregation are consistent with a cascade of cerebrovascular, structural, and cognitive effects. Netw Neurosci. 2020;4(1):89–114. doi: 10.1162/netn_a_00110. [DOI] [PMC free article] [PubMed] [Google Scholar]
- 49.Dickerson BC, Bakkour A, Salat DH, Feczko E, Pacheco J, Greve DN, et al. The cortical signature of Alzheimer’s disease: regionally specific cortical thinning relates to symptom severity in very mild to mild AD dementia and is detectable in asymptomatic amyloid-positive individuals. Cereb Cortex. 2009;19(3):497–510. doi: 10.1093/cercor/bhn113. [DOI] [PMC free article] [PubMed] [Google Scholar]
- 50.Tan CH, Low KA, Kong T, Fletcher MA, Zimmerman B, Maclin EL, et al. Mapping cerebral pulse pressure and arterial compliance over the adult lifespan with optical imaging. PLoS One. 2017;12(2):e0171305. doi: 10.1371/journal.pone.0171305. [DOI] [PMC free article] [PubMed] [Google Scholar]
- 51.Schultz WM, Kelli HM, Lisko JC, Varghese T, Shen J, Sandesara P, et al. Socioeconomic status and cardiovascular outcomes. Circulation. 2018;137(20):2166–2178. doi: 10.1161/CIRCULATIONAHA.117.029652. [DOI] [PMC free article] [PubMed] [Google Scholar]
- 52.Gianaros PJ, Horenstein JA, Cohen S, Matthews KA, Brown SM, Flory JD, et al. Perigenual anterior cingulate morphology covaries with perceived social standing. Soc Cogn Affect Neurosci. 2007;2(3):161–173. doi: 10.1093/scan/nsm013. [DOI] [PMC free article] [PubMed] [Google Scholar]
- 53.Apostolova LG, Dutton RA, Dinov ID, Hayashi KM, Toga AW, Cummings JL, et al. Conversion of mild cognitive impairment to Alzheimer disease predicted by hippocampal atrophy maps. Arch Neurol. 2006;63(5):693–699. doi: 10.1001/archneur.63.5.693. [DOI] [PubMed] [Google Scholar]
- 54.Fry A, Littlejohns TJ, Sudlow C, Doherty N, Adamska L, Sprosen T, et al. Comparison of sociodemographic and health-related characteristics of UK Biobank participants with those of the general population. Am J Epidemiol. 2017;186(9):1026–1034. doi: 10.1093/aje/kwx246. [DOI] [PMC free article] [PubMed] [Google Scholar]
- 55.Tan CH, Hyman BT, Tan JJX, Hess CP, Dillon WP, Schellenberg GD, et al. Polygenic hazard scores in preclinical Alzheimer disease. Ann Neurol. 2017;82(3):484–488. doi: 10.1002/ana.25029. [DOI] [PMC free article] [PubMed] [Google Scholar]
- 56.Vacher M, Doré V, Porter T, Milicic L, Villemagne VL, Bourgeat P, et al. Assessment of a polygenic hazard score for the onset of pre-clinical Alzheimer’s disease. BMC Genom. 2022;23(1):401. doi: 10.1186/s12864-022-08617-2. [DOI] [PMC free article] [PubMed] [Google Scholar]
- 57.Migliore L, Coppedè F. Gene–environment interactions in Alzheimer disease: the emerging role of epigenetics. Nat Rev Neurol. 2022;18(11):643–660. doi: 10.1038/s41582-022-00714-w. [DOI] [PubMed] [Google Scholar]