

Abstract
Focal epilepsy is characterized by repeated spontaneous seizures that originate from cortical epileptogenic zone networks (EZN). Analysis of intracerebral recordings showed that subcortical structures, and in particular the thalamus, play an important role in seizure dynamics as well, supporting their structural alterations reported in the neuroimaging literature. Nonetheless, between‐patient differences in EZN localization (e.g., temporal vs. non‐temporal lobe epilepsy) as well as extension (i.e., number of epileptogenic regions) might impact the magnitude as well as spatial distribution of subcortical structural changes. Here we used 7 Tesla MRI T1 data to provide an unprecedented description of subcortical morphological (volume, tissue deformation, and shape) and longitudinal relaxation (T1) changes in focal epilepsy patients and evaluate the impact of the EZN and other patient‐specific clinical features. Our results showed variable levels of atrophy across thalamic nuclei that appeared most prominent in the temporal lobe epilepsy group and the side ipsilateral to the EZN, while shortening of T1 was especially observed for the lateral thalamus. Multivariate analyses across thalamic nuclei and basal ganglia showed that volume acted as the dominant discriminator between patients and controls, while (posterolateral) thalamic T1 measures looked promising to further differentiate patients based on EZN localization. In particular, the observed differences in T1 changes between thalamic nuclei indicated differential involvement based on EZN localization. Finally, EZN extension was found to best explain the observed variability between patients. To conclude, this work revealed multi‐scale subcortical alterations in focal epilepsy as well as their dependence on several clinical characteristics.
Keywords: focal epilepsy, subcortical gray matter, multivariate analysis, T1 , volume, shape, deformation
Haast et al. used 7 Tesla MRI T1 data to provide an unprecedented description of subcortical morphological (volume, tissue deformation, and shape) and longitudinal relaxation (T1) changes in focal epilepsy patients and evaluate the impact of the epileptogenic zone network and other patient‐specific clinical features.

1. INTRODUCTION
Focal epilepsy is a chronic neurological disorder that is characterized by repeated spontaneous seizures caused by abnormal neuronal rhythms. These seizures typically start in one or several specific regions of the brain (i.e., epileptogenic zone, or EZ) and propagate to other regions or the whole brain. The EZ is part of a hierarchical network organization with subnetworks involved in the generation (i.e., epileptogenic zone network, EZN) and propagation (i.e., propagation network, PN) of epileptic activities across the brain (Bartolomei et al., 2017). Brain abnormalities might extend well beyond the EZ, involving regions that correlate with cognitive impairment but are only affected by seizure propagation or even spared from ictal discharges (i.e., non‐involved networks). In approximately 30% of patients, epileptic seizures cannot be controlled by medication (Fattorusso et al., 2021; Kwan et al., 2010), thereby significantly hampering the patient's quality of life (Loring et al., 2004).
Network approaches—based on the mapping of inter‐regional connectivity or covariance—showed that focal epilepsy indeed affects the whole‐brain and that focal structural and functional changes within the EZ appear to act more as a set of nodes in a larger network of affected regions (Larivière et al., 2021; Rodriguez‐Cruces et al., 2022). For example, changes in cortical morphometry and connectivity have been consistently observed across the cortical mantle (Drenthen et al., 2018; Larivière et al., 2020; Larivière et al., 2022; Whelan et al., 2018; Wirsich et al., 2016). Direct longitudinal relaxation time (T1) mapping showed a prolongation of T1 relaxation times in temporopolar, orbitofrontal and para‐hippocampal regions indicating alterations at the microstructural level as well (Bernhardt et al., 2018).
Increasing evidence points to a crucial role for subcortical structures in facilitating and/or propagating epileptic activity (Pizzo et al., 2021) as integrative hubs for brain connectivity (Bell & Shine, 2016). In particular the thalamus, with its complex organization and nuclei, is a key gateway for cortico‐subcortical interactions facilitating precise motor‐sensory to broad cognitive functioning (Sherman, 2016; Shine, 2021). Not surprisingly, accumulating evidence using stereoelectroencephalography (SEEG; Guye et al., 2006; Pizzo et al., 2021; Rosenberg et al., 2006) and MRI (Bernhardt et al., 2012; Guye et al., 2006; Keller et al., 2014) reveal a prominent involvement of the thalamus in temporal lobe epilepsy (TLE). It has been demonstrated that previously observed cortical alterations in T1 extend into the thalamic region as well, positioning thalamic T1 as a promising metric to differentiate patients from controls (Tang et al., 2022) and complementing earlier observations of altered thalamic morphology (Keller et al., 2014; Whelan et al., 2018). Nonetheless, most of the published works has focused on the thalamus as a whole, a single metric, and/or a single type of focal epilepsy (mainly TLE). In addition, much of the current knowledge is derived from 3 Tesla (3T) MRI data which are suboptimal for identification of individual thalamic nuclei, as well as for detection of subtle differences across patients. Here, 7T MRI and its superior sensitivity is suitable alternative to probe the brain's subcortical gray matter at a much finer scale and with superior tissue contrast in the context of both health and disease (Duyn, 2018; Marques et al., 2010; Opheim et al., 2020; Pohmann et al., 2016; Trattnig et al., 2018). Compared to 3T MRI, its increased signal‐to‐noise ratio provides unique opportunities for submillimeter quantification of changes specific to certain thalamic nuclei and regions which are difficult to identify at lower field strengths, such as the claustrum (Marques et al., 2010; Pohmann et al., 2016).
Thus, so far it has remained elusive how each of the previous, separate subcortical observations scale among each other based on (i) metric type (e.g., morphometry vs. T1), (ii) thalamic nuclei and basal ganglia, and/or depend on (iii) the type of focal epilepsy (e.g., TLE vs. non‐TLE) or (iv) clinical features (e.g., number of epileptogenic regions, seizure frequency, left vs. right seizure onset). By leveraging 7T MRI anatomical data, this study aims to fill this knowledge gap by using a multi‐scale exploration of thalamic (nuclei) and basal ganglia alterations based on morphological (volume, deformation, and shape) and T1 relaxation time parameters in a heterogeneous patient population consisting of TLE and non‐TLE patients. Then, driven by the patient heterogeneity, we will employ a multivariate data‐driven approach to highlight patterns within the subcortical MRI phenotype (i.e., combining all MRI features) that relate to differences in EZN and other clinical features.
2. MATERIALS AND METHODS
2.1. Study cohort
We retrospectively included all consecutive patients with drug‐resistant focal epilepsy who underwent the presurgical evaluation at our center with available 7T brain MRI and SEEG recordings between June 2017 and October 2020. The SEEG recordings were performed in all patients as part of a routine clinical care according to the French guidelines (Isnard et al., 2018). The 7T MRI scans were acquired in the framework of two prospective studies recruiting patients undergoing presurgical evaluation for drug‐resistant focal epilepsy: the EPINOV trial (NCT03643016) and the local EPI study. Both studies were approved by the local ethics committee, and all participants gave written consent. From the initial 52, five patients were excluded for suboptimal quality of MRI data and two patients were excluded because SEEG was performed before the MRI. A last patient was excluded because of a large cerebral pial angioma that altered the anatomy and prevented adequate brain segmentation. Finally, data from 44 patients were used for further analyses. Patients were classified into five groups according to the EZN anatomo‐functional organization as defined by visual and quantitative SEEG data analyses (Bartolomei et al., 2008) by expert neurologists (authors F.B. and J.M.): (i) temporal plus, with EZN either limited to the temporal regions or with maximal epileptogenicity within the temporal lobe but EZN extension to some extratemporal regions (e.g., temporo‐insular, temporo‐frontal, temporo‐occipital, N = 25); (ii) prefrontal, with EZN involving prefrontal regions (N = 8); (iii) posterior, with EZN involving parietal and/or occipital regions (N = 5); (iv) insulo‐opercular, with EZN involving the insula and/or opercular cortex (N = 3); and (v) central‐premotor, with EZN involving the primary motor and/or premotor cortex (N = 3). A second grouping‐level was added by separating between temporal (i.e., temporal plus group patients, “TLE,” N = 25) and non‐temporal patients (all other groups, “NTLE,” N = 19) together to gain statistical power. Finally, we recruited 33 age‐ and sex‐matched healthy controls for comparison.
2.2. Image acquisition
All data were acquired on a Siemens Magnetom 7T MRI system (Siemens Healthineers, Erlangen, Germany) equipped with a 32‐channel head coil (Nova Medical, Inc., Wilmington, MA). Whole brain B1 + and T1 maps were acquired using a spin‐echo‐based, assessing the ratio of consecutive spin and stimulated echoes and 3D Magnetization Prepared with 2 Rapid Acquisition Gradient Echoes (MP2RAGE) sequence, respectively (Marques et al., 2010). The MP2RAGE sequence produces a T1‐weighted (T1w) image with a spatially normalized contrast and minimal receive bias. Acquisition parameters were: TRmpr/TR/TE/TI1/TI2 = 5000/7.4/3.13/2750 ms, α 1/α 2 = 6°/5°, FOV = 240 mm (matrix size: 402 × 402), 256 partitions, a parallel imaging acceleration factor of 3 (2D GRAPPA), and Partial Fourier factors of 6/8 in both phase‐ and partition‐encoding directions. This resulted in a nominal isotropic voxel size = 0.6 mm and a total acquisition time of 10.12 min.
2.3. Image preprocessing
The MP2RAGE data were used to segment thalamic nuclei and other basal ganglia for extracting morphometric and T1 features. MP2RAGE anatomical data preprocessing included (i) correction for gradient non‐linearities using the “gradunwarp” tool provided by the Human Connectome Project (HCP, https://github.com/Washington-University/gradunwarp); (ii) post hoc T1 correction for residual B1 + inhomogeneities; (iii) a skull stripping workflow optimized for MP2RAGE data using “PreSurfer” and (iv) cortical surface reconstruction and parcellation using FreeSurfer (v7.1.1). The MP2RAGE data were corrected for B1 + inhomogeneities resulting in a “corrected” T1w (i.e., UNI) and quantitative T1 map, synthesized using a lookup table specific for the current sequence setup (https://github.com/JosePMarques/MP2RAGE-related-scripts; Marques & Gruetter, 2013). Non‐brain tissue was then removed using the MP2RAGE's second inversion and (corrected) UNI images using SPM12 functionalities wrapped within PreSurfer (https://github.com/srikash/presurfer; Kashyap, 2021; Kashyap et al., 2021). The skull stripped MP2RAGE T1w images were used as input for the submillimeter processing workflow implemented in FreeSurfer (v7.1.1, http://surfer.nmr.mgh.harvard.edu/) image analysis suite to obtain brain tissue segmentations, estimated total intracranial volume (eTIV) and white matter and pial surface reconstructions (Fischl, 2012).
2.4. Segmentation of thalamic nuclei and basal ganglia
2.4.1. 7TAMIBrain
An improved version of the recently published 7TAMIBrain pipeline by Brun et al. was employed here for subcortical segmentation (Brun et al., 2022), making use of 60 atlases constructed from the 7TAMIBrain dataset (Girard et al., 2021). This multi atlas label fusion (MALF; Wang et al., 2013) approach renders the segmentation results more robust and accurate, especially in cohorts with (potential) variable anatomies. The most important steps are highlighted below but see the Supplementary Methods for more details.
For each subject, its skull stripped T1 map was first coregistered to each of the 60 atlases using the quick three stages registration procedure (i.e., rigid + affine + deformable SyN atlas‐to‐subject registrations), as implemented in ANTs “antsRegistrationSyNQuick” script (Avants et al., 2008; Avants et al., 2011). Fixed target (i.e., subject to segment) and moving (i.e., atlases) images were cropped (with matrix size = 192; Fattorusso et al., 2021) and centered on the DGN atlases pre‐segmented via the single‐atlas pipeline to optimize the computing time.
Second, the Joint Label Fusion algorithm and ANT's “antsJointLabelFusion2” script was used to merge the warped atlases into the individual subject's space (Wang et al., 2013). Label fusion reduces the impact of potential biases from the image registration while providing a good spatial consistency for the label boundaries. By default, the Joint Fusion method is only performed in voxels for which the atlas' labeling consensus is lower than 80%, otherwise Majority Voting is used to determine label assignment. For this work, Joint Fusion was used for any voxel for which full consensus was not reached across all atlases by setting this threshold at 100%. This reduces potential recurrent biases in the segmentation of epileptic subjects with large anatomical differences from the healthy controls of 7TAMIBrain dataset.
2.4.2. THOMAS
To assess the impact of atlas choice on the thalamic results, thalamic nuclei were additionally segmented using THOMAS (Su et al., 2019). Since THOMAS is optimized to work with white matter‐nulled (WMn) Magnetization Prepared with Rapid Acquisition Gradient Echoes (MPRAGE) images (i.e., enhanced thalamic‐white matter contrast), MP2RAGE T1 maps were first white matter‐nulled using a recently proposed thresholding method based on the inversion recovery signal equation (Datta et al., 2021):
| (1) |
Here, a T1 threshold of 700 ms. was found to provide most reliable performance as assessed through visual inspection of segmentation results using varying thresholds. The WMn T1 maps were than used as input for the joint‐fusion THOMAS pipeline (https://github.com/thalamicseg/thomas_new).
2.5. MRI feature extraction
Different MRI features were extracted from the MRI data using the thalamic (both atlases) and basal ganglia segmentations (7TAMIBrain atlas only).
2.5.1. Volume‐based features
For each ROI, total volume was computed (mm3) while longitudinal relaxation time (T1, ms) were averaged across voxels. In addition, voxel‐wise deformations were obtained by warping the 7TAMIBrain T1 template to the subject's T1 map. Here, a non‐linear registration was performed using ANTs' deformable (diffeomorphic) registration (with shrink factors: 12 × 6 × 4 × 2 × 1; smoothing factors: 6 × 3 × 2 × 1 × 0 vox; max iterations: 100 × 100 × 70 × 50 × 10; transformation model: SyN; similarity metric: cross‐correlation; Avants et al., 2008). The resulting affine transformation matrix and non‐linear transformation field were combined to obtain a single displacement field. Local change in tissue density was then estimated as the derivative of the displacement of a given voxel in each direction. The derivatives can be calculated as the determinant of the Jacobian matrix using ANTs' ComputeJacobianDeterminant function. The absolute value of the Jacobian determinant at voxel p gives us the factor by which the tissue expands or shrinks near p. By taking the logarithm of the determinant, no change is given by 0, tissue loss is given by a positive value, and tissue expansion is given by a negative value. Average deformation‐based morphometry (DBM) values were obtained by averaging across all voxels within each ROI.
2.5.2. Surface‐based features
To assess changes in shape, surface‐based metrics were extracted following the procedure described previously and using openly available image processing scripts (https://github.com/khanlab/surfmorph; Khan et al., 2019). The subject's T1w image and labels were first aligned along the AC‐PC plane, following the HCP procedure, to enable left–right flipping to combine analyses of the left and right hemisphere labels. Fuzzy labels for each of the subject's labels (ROIs) were then obtained by smoothing the binary ROI label with a 1 × 1 × 1 mm kernel size. The fuzzy (i.e., smoothed) labels for each of the ROIs, for each subject, were transformed to MNI space using linear transformations based on the subject's MP2RAGE T1w to MNI volume transformation. These linearly aligned labels were used to generate unbiased averages for surface generation by iterating through steps of (i) template generation by averaging across subjects, and (ii) registration of each segmentation image to this template using LDDMM registration. The resulting fuzzy segmentation was then used to generate the ROI's template surface through a 50% probability isosurface. The 3D volume of the ROI's template was then fit to each subject's segmentation using LDDMM, with affine initialization to provide vertex‐wise correspondence between all surfaces of that specific ROI. The template surface was then propagated to each subject's ROI, to provide surfaces with common indices for projecting vertex displacement values and extraction of additional shape features. As such, vertex area and surface curvature were extracted using the “surface‐vertex‐areas” and “surface‐curvature” Connectome Workbench (v1.5.0) command line functions, respectively (Marcus et al., 2011). Please, see Figure S1 for a schematic of this procedure.
Please note that single surfaces were constructed for the thalamus (i.e., by grouping thalamic nuclei) and striatum (i.e., caudate nucleus, nucleus accumbens, and putamen). However, nuclei‐specific averages were calculated through thalamic and striatal surface atlases. To construct thalamic and striatal surface‐based nuclei atlases, subject‐specific volume labels were propagated toward the subject's surface models along the closest vertex normal, after which Majority Voting (i.e., across all subjects) was used to assign a label to each vertex. ROI‐wise displacement, area and curvature were then reduced to a single shape component through principal component analyses.
2.6. Statistical analysis
Prior to statistical analyses, ROI‐results were corrected for confounding, linear effects of age, head size (both continuous), and sex (male vs. female) and hemisphere (left vs. right) using the confounds (v.0.1.1) Python package (Raamana, 2020). Contributions of confounding variables to the given feature were determined using a linear regression model based on data obtained in control subjects only. Control and patient feature data were then “residualized” by subtracting the contributions from the confound variables and z‐scored using the controls' mean and standard deviation. An overview of the impact of each of these confounding factors on the different metrics can be found in Figure S2. Eventually, a data matrix of N subjects × [N feature type × N ROIs × N sides] was derived that was used as input for the following statistical analyses.
2.6.1. Feature‐wise comparison
Assessment of statistical differences of MRI features between subject groups was performed using (multivariate) analyses of variance (ANOVA). Besides correcting for age, head size, sex and hemisphere (see paragraph on confounder correction), multivariate ANOVA (MANOVA) and/or Bonferroni multiple comparisons correction was used in case of across nuclei and/or pair‐wise statistical comparisons, respectively. Moreover, for each feature, ipsilateral minus contralateral differences were computed to assess possible unilateral changes.
2.6.2. Partial least squares analyses
Partial least squares (PLS) analyses were carried out to further explore the variability in MRI‐based features between groups (i.e., mean‐centered PLS) and with respect to the clinical features across patients (i.e., behavioral PLS) using the PyPLS Python package (https://github.com/netneurolab/pypyls; Kirschner et al., 2020; McIntosh & Mišić, 2013). Compared to mass‐univariate (Pearson or Spearman) correlation analyses, PLS works well with data characterized by multicollinearity, as is the case for the current collection of MRI features. Mean‐centered PLS is a multivariate statistical approach that defines sets of variables in a matrix (X n×p ) which maximally discriminate between subgroups within the matrix. Here, the n rows represent the individual subjects and p columns the MRI‐based features. The resulting latent variable (LV) then constitutes a weighted combination of all MRI‐based features that best differentiates groups (e.g., “TLE vs. NTLE vs. controls”). On the other hand, behavioral PLS identifies weighted patterns of variables across two given matrices (X n×p and Y n×p ) that maximally covary with each other. For example, when comparing patients' MRI‐based features in matrix X and patients' clinical phenotype in matrix Y. Statistical evaluation of PLS results was performed using permutation tests (N = 10,000) to assess significance of overall patterns (i.e., LVs) and by bootstrap resampling (N = 10,000) to rank MRI and clinical features based on importance/reliability.
A graphical overview of the analytical pipeline is displayed in Figure 1 The directed acyclic graph in Figure S3 shows a detailed overview of the different (pre)processing steps.
FIGURE 1.

Schematic display of the analytical pipeline. (a) First, high resolution T1 maps were used to segment the thalamus and other basal ganglia. (b) Several MRI features were then extracted, focusing on morphometry, and longitudinal relaxation time (T1). Surface‐based metrics related to shape (i.e., displacement, area, and curvature) were reduced to a single shape component. (c) Statistical analyses were performed for (1) group‐wise comparisons as well as (2) identification of latent variables.
3. RESULTS
3.1. Clinical features
Demographic characteristics and clinical data for all patients are shown in Table 1. The mean age at epilepsy onset was 12.6 (range 0.1–40) years, mean duration of epilepsy was 18.3 (range 2–47) years. Left and right seizure onset was observed in 23 (52%) and 21 (48%) cases, respectively, while on average 5.25 (range 1–14) regions were categorized as epileptogenic with a mean seizure frequency of 38.7 (range 2–300) per month. Anatomical MRI appeared normal in 25 (57%) and showed a structural abnormality in 19 (43%) of the cases based on 3T examinations. For one patient, the MRI showed a lesion at 7T while this was normal at 3T. Epilepsy etiology according to MRI and available histopathological findings included gliosis in seven, focal cortical dysplasia (FCD) type I/II/III in respectively five, nine and one patient(s), dysembryoplastic neuroepithelial tumor (DNET) in four; polymicrogyria (PMG) in two and periventricular nodular heterotopia (PNH) in two patients.
TABLE 1.
Patient clinical demography.
| Demographic | Epilepsy | Lesion info | |||||||||||
|---|---|---|---|---|---|---|---|---|---|---|---|---|---|
| Patient | Age | Sex | Group | Epilepsy type | Side | Age at onset (years) | Disease duration (years) | Seizure frequency (per month) | Frequency of bilateral tonic–clonic seizures (per year) | Number of epileptogenic regions | 3T MRI | 7T MRI | Etiology/histological findings |
| sub‐001 | 21 | M | TLE | Temporal Plus | R | 0.8 | 20 | 10 | 4 | 12 | Lesion | Lesion | FCD2b |
| sub‐002 | 22 | F | TLE | Temporal Plus | R | 13 | 9 | 150 | 0 | 8 | Normal | Normal | Unknown/no abnormality |
| sub‐003 | 25 | F | TLE | Temporal Plus | L | 10 | 15 | 2 | 0 | 1 | Normal | Normal | FCD1 |
| sub‐004 | 40 | M | NTLE | Prefrontal | R | 16 | 24 | 90 | 0 | 8 | Lesion | Lesion | Gliosis |
| sub‐005 | 40 | M | NTLE | Posterior | R | 4 | 36 | 12 | 0 | 2 | Normal | Normal | Unknown/no abnormality |
| sub‐006 | 56 | F | NTLE | Posterior | R | 30 | 26 | 20 | 0 | 7 | Lesion | Lesion | FCD2/NA |
| sub‐007 | 44 | M | NTLE | Insulo‐opercular | L | 13 | 31 | 2 | 0 | 3 | Normal | Normal | Unknown/NA |
| sub‐008 | 46 | M | NTLE | Centra‐Premotor | L | 4 | 42 | 120 | 0 | 3 | Lesion | Lesion | FCD2/NA |
| sub‐009 | 48 | F | TLE | Temporal Plus | R | 40 | 9 | 30 | 0 | 3 | Normal | Normal | FCD1 |
| sub‐010 | 33 | F | TLE | Temporal Plus | R | 24 | 9 | 4 | 0 | 3 | Normal | Normal | FCD3a |
| sub‐011 | 29 | F | NTLE | Prefrontal | L | 12 | 17 | 20 | 0 | 2 | Lesion | Lesion | DNET |
| sub‐012 | 27 | F | NTLE | Centra‐Premotor | L | 4 | 23 | 90 | 0 | 4 | Lesion | Lesion | FCD2b |
| sub‐013 | 37 | F | TLE | Temporal Plus | L | 12 | 25 | 16 | 0 | 1 | Lesion | Lesion | Ganglioglioma |
| sub‐014 | 24 | F | TLE | Temporal Plus | L | 21 | 3 | 10 | 0 | 12 | Normal | Normal | Unknown/NA |
| sub‐015 | 28 | F | NTLE | Prefrontal | L | 0.1 | 28 | 90 | 0 | 2 | Normal | Lesion | FCD2a |
| sub‐016 | 36 | M | NTLE | Posterior | R | 3 | 33 | 300 | 0 | 3 | Lesion | Lesion | FCD2b |
| sub‐017 | 21 | F | NTLE | Insulo‐opercular | R | 14 | 7 | 60 | 0 | 1 | Lesion | Lesion | DNET |
| sub‐018 | 31 | F | NTLE | Prefrontal | L | 8 | 22 | 30 | 0 | 2 | Lesion | Lesion | FCD2b |
| sub‐019 | 47 | F | TLE | Temporal Plus | L | 5 | 42 | 10 | 0 | 6 | Normal | Normal | Unknown/NA |
| sub‐020 | 29 | M | TLE | Temporal Plus | L | 3 | 26 | 120 | 0 | 2 | Normal | Normal | Mild gliosis |
| sub‐021 | 25 | M | TLE | Temporal Plus | L | 11 | 14 | 8 | 4 | 6 | Normal | Normal | Unknown/NA |
| sub‐022 | 23 | M | TLE | Temporal Plus | L | 12 | 11 | 8 | 0 | 4 | Normal | Normal | FCD1 |
| sub‐023 | 26 | M | NTLE | Prefrontal | L | 17 | 10 | 50 | 0 | 6 | Normal | Normal | FCD2a |
| sub‐024 | 22 | F | TLE | Temporal Plus | R | 4 | 18 | 100 | 0 | 11 | Normal | Normal | Unknown/NA |
| sub‐025 | 15 | M | TLE | Temporal Plus | L | 2 | 13 | 5 | 0 | 7 | Normal | Normal | FCD2a |
| sub‐026 | 57 | F | TLE | Temporal Plus | R | 35 | 22 | 5 | 6 | 4 | Lesion | Lesion | Gliosis |
| sub‐027 | 22 | M | NTLE | Posterior | L | 20 | 2 | 9 | 0 | 2 | Lesion | Lesion | PMG |
| sub‐028 | 17 | M | NTLE | Insulo‐opercular | L | 7 | 10 | 12 | 1 | 5 | Normal | Normal | Unknown/NA |
| sub‐029 | 52 | F | TLE | Temporal Plus | L | 5 | 47 | 12 | 0 | 7 | Lesion | Lesion | PMG, PNH |
| sub‐030 | 30 | M | TLE | Temporal Plus | L | 3 | 26 | 15 | 6 | 5 | Normal | Normal | Unknown/NA |
| sub‐031 | 27 | F | TLE | Temporal Plus | R | 17 | 10 | 5 | 1 | 6 | Normal | Normal | Unknown/NA |
| sub‐032 | 42 | F | TLE | Temporal Plus | L | 28 | 14 | 15 | 6 | 4 | Lesion | Lesion | Gliosis |
| sub‐033 | 36 | M | TLE | Temporal Plus | R | 29 | 7 | 60 | 12 | 3 | Normal | Normal | FCD1 |
| sub‐034 | 41 | M | NTLE | Prefrontal | R | 12 | 29 | 60 | 0 | 2 | Normal | Normal | Unknown/NA |
| sub‐035 | 18 | F | TLE | Temporal Plus | R | 13 | 5 | 15 | 6 | 6 | Normal | Normal | Mild gliosis |
| sub‐036 | 38 | F | TLE | Temporal Plus | R | 20 | 18 | 68 | 0 | 4 | Lesion | Lesion | PNH, FCD1 |
| sub‐037 | 30 | M | TLE | Temporal Plus | L | 19 | 21 | 2 | 0 | 6 | Normal | Normal | Unknown/NA |
| sub‐038 | 20 | M | NTLE | Prefrontal | R | 7 | 13 | 15 | 0 | 11 | Lesion | Lesion | Pediatric infiltrative glioma |
| sub‐039 | 31 | M | TLE | Temporal Plus | R | 22 | 9 | 4 | 0 | 5 | Normal | Normal | Mild gliosis |
| sub‐040 | 21 | M | TLE | Temporal Plus | L | 12 | 9 | 2 | 0 | 3 | Lesion | Lesion | Gangliogioma |
| sub‐041 | 16 | M | NTLE | Posterior | R | 10 | 6 | 10 | 12 | 14 | Normal | Normal | Unknown/NA |
| sub‐042 | 21 | F | NTLE | Prefrontal | R | 9 | 11 | 5 | 0 | 1 | Normal | Normal | Mild gliosis |
| sub‐043 | 16 | M | TLE | Temporal Plus | R | 1.5 | 14 | 30 | 0 | 13 | Lesion | Lesion | DNET |
| sub‐044 | 17 | M | NTLE | Centra‐Premotor | L | 0.5 | 17 | 2 | 0 | 11 | Lesion | Lesion | DNET |
Abbreviations: DNET, dysembryoplastic neuroepithelial tumor; FCD, focal cortical dysplasia; L/R, left/right; M/F, male/female; NA, not applicable; NTLE non‐temporal lobe epilepsy; PMG, polymicrogyria; PNH, periventricular nodular heterotopia; TLE, temporal lobe epilepsy.
3.2. MRI features
Figure 2 shows the full data matrix with rows representing subjects, grouped based on epilepsy type, and columns representing the individual MRI features organized per metric type (i.e., volume, deformation, shape, and T1), brain structure (thalamic nuclei and other basal ganglia) and side with respect to seizure onset for patients (ipsilateral vs. contralateral), while based on hemisphere for control subjects. From this birds‐eye view, both volume and T1 show lower z‐scores (i.e., brighter blue) for the patients compared to controls while the opposite pattern is true for deformation and shape (i.e., brighter red).
FIGURE 2.

Z‐scores heatmap. Individual MRI features are color‐coded (thresholded at −1.5 and 1.5) as indicated by the horizontal bars on the top according to metric type (volume, deformation, shape, and T1), brain structure (thalamus vs. other basal ganglia) and side with respect to seizure onset for patients (contra‐ vs. ipsilateral), while left versus right for control subjects. Vertical color bars on the left side indicate subject group.
In the following sections will present these results in more detail focusing first on thalamic volume and T1, after which these will be analyzed in conjunction with the remaining MRI features (deformation and shape), other basal ganglia data, as well as patient‐specific clinical features using PLS analyses.
3.2.1. Volume
w?>Previous work has shown thalamic volume reduction in TLE. To confirm these effects in the current study cohort, as well as to investigate potential TLE and NTLE and nuclei‐specific differences, we compared thalamic changes at a global scale (i.e., whole thalamus) as well as at the single nucleus‐level.
At the level of the whole thalamus (Figure 3a), ipsilateral and contralateral thalamic volumes were significantly different between groups (F 2,76 = 20.68, p < .001). Both groups of patients had lower volumes compared to controls (p < .001). Thalamic volume was lower in the thalamus ipsilateral to the epileptogenic zone compared to controls in TLE (p < .05), but not in NTLE (p = .06). No significant differences were observed between TLE and NTLE.
FIGURE 3.

Volumetric results. (a) Whole thalamic volume (z‐scored) was compared between groups (top panel) as well as between sides (i.e., ipsilateral–contralateral differences for patients, left–right for controls, bottom panel). (b) Similarly, average volumes of each thalamic nuclei (z‐scored) are shown for both patient groups (columns) and side (rows, left heatmap). Asterisks below nuclei labels indicate MANOVA (black), and pair‐wise comparison (orange for NTLE and blue for TLE, vs. controls) results. Strip plot and right heatmap in B illustrate the ipsilateral–contralateral T1 differences for each patient (color‐coded by group). Color‐bars alongside nuclei labels indicate group assignment. C = contralateral; I = ipsilateral; *p < .05; **p < .01; ***p < .005; ****p < .001; Bonferroni corrected in case of multiple comparisons.
Thalamic nuclei volumes (Figure 3b) were lower than controls in both focal epileptic groups (F 18,138 = 3.502, p < .001; Wilk's Λ = 0.471, partial η 2 = .31). The strongest general group effect was observed in the mediodorsal nucleus (F 2,77 = 22.038, p < .001) with differences originating from both TLE and NTLE (both p < .001) groups compared to controls. The weakest (and only not significant) group effect was observed for the anterior nucleus (F 2,77 = 2.956, p = .058). Asterisks below nuclei labels indicate MANOVA (black), and pairwise comparison (orange for TLE and blue for NTLE, vs. controls) results. Multivariate analysis across thalamic nuclei did not show systematic ipsi‐ versus contralateral volume differences between groups.
For brevity reasons, see the Supplementary Results (section “Deformation and shape”) for extension of these analyses to the other morphometric features.
3.2.2. T1 relaxometry
Thalamic T1 relaxometry values (Figure 4a) were significantly modulated by group (F 2,76 = 3.80, p < .05), with differences coming from the TLE patients compared to controls (p < .05).
FIGURE 4.

T1 results. (a) Whole thalamic T1 (z‐scored) was compared between groups (top panel) as well as between sides (i.e., ipsilateral–contralateral differences for patients, left–right for controls, bottom panel). (b) Similarly, average T1 of each thalamic nuclei (z‐scored) are shown for both patient groups (columns) and side (rows, left heatmap). Asterisks below nuclei labels indicate MANOVA (black), and pairwise comparison (orange for NTLE and blue for TLE, vs. controls) results. Strip plot and right heatmap in B illustrate the ipsilateral–contralateral T1 differences for each patient (color‐coded by group). Color‐bars alongside nuclei labels indicate group assignment. C = contralateral; I = ipsilateral; *p < .05; **p < .01; ***p < .005; ****p < .001; Bonferroni corrected in case of multiple comparisons.
As for volume, thalamic nuclei T1 (Figure 4b) values were lower than controls in both focal epileptic groups (F 18,13 = 2.230, p < .01; Wilk's Λ = 0.600, partial η 2 = .24). Here, the lateral group shows the strongest effect (F 2,77 = 3.228, p < .005) with similar contributions from TLE (p < .05) and NTLE (p < .05) patients. As for volume, the weakest effect was seen for the anterior nucleus (N.S.). T1 was not significantly different between the ipsi‐ and contralateral sides.
3.3. MRI versus clinical features
In previous sections we reported on thalamic changes, focusing on the MRI features separately. Nonetheless, it remains unclear which feature(s) provide(s) the most discriminatory power between groups and/or across patients when analyzed together as well as the added value of the other basal ganglia. As such, in the following we performed mean‐centered and behavioral PLS analyses to rank MRI and clinical features in terms of importance/reliability, respectively.
3.3.1. Mean‐centered PLS
Mean‐centered PLS allows to rank individual MRI features based on their contribution to LVs that significantly differentiate(s) between subject groups. Contrasting MRI features between NTLE, TLE and controls resulted in one significant LV (81.4% explained variance, p perm < .001). Figure 5a shows the ranking and comparison of the MRI features (color‐coded as in Figure 2) in terms of their absolute contribution to the LV as defined by their bootstrapped ratio (BSR) between the feature's loading and its 95% confidence interval. Metric, structure, and side‐wise averages are shown using black diamonds (±95% CI). Here, BSRs were significantly modulated by metric type (F 3,102 = 12.27, p < .001) with higher BSRs observed for the volumetric features compared to deformation‐, shape‐, and T1‐based features (all p < .001). Although different in magnitude, a clear spatial correlation between volume and shape features can be observed when projecting the BSR value onto their respective surface reconstructions, with higher BSR values toward the ipsilateral, posterior thalamus (Figure 5b).
FIGURE 5.

Mean‐centered PLS results across patients and controls. (a) Line plot shows sorted bootstrapped ratios when contrasting NTLE, TLE, and controls. Heatmaps indicate feature properties (metric type, structure, and side, color‐coded as in Figure 2). Strip plot shows the decomposition of features based on feature properties with black diamonds indicating average BSR (±95% CI). *p < .05; **p < .01; ***p < .005; ****p < .001; Bonferroni corrected in case of multiple comparisons. (b) Projection of significant bootstrapped ratio values (color‐coded), based on mean‐centered partial‐least squares analyses, onto the structures' surface reconstructions. Results are separated per MRI metric type (rows). Black solid lines indicate structure boundaries.
A weaker, but nonetheless significant LV was detected when contrasting the five epilepsy types (62.3% explained variance, p perm < .05, Figure 6). Again, BSRs varied as function of metric type (F 3,102 = 12.27, p < .001), but structure as well (F 1,102 = 11.71, p < .005). Here, highest BSRs were observed for the T1‐based features (p < .005 compared to volume and p < .001 compared to shape). Moreover, changes in thalamic nuclei appear more strong contributors than changes in the other basal ganglia (p < .005). See Figure S3 for surface‐wise projections.
FIGURE 6.

Mean‐centered PLS results across patients. Line plot shows sorted bootstrapped ratios when contrasting epilepsy types (i.e., temporal plus, prefrontal, posterior, insulo‐opercular, and central‐premotor). Heatmaps indicate feature properties (metric type, structure, and side, color‐coded as in Figure 2). Strip plot shows the decomposition of features based on feature properties with black diamonds indicating average BSR (±95% CI). *p < .05; **p < .01; ***p < .005; ****p < .001; Bonferroni corrected in case of multiple comparisons.
3.3.2. Behavioral PLS
Focusing on the patient data only, behavioral PLS provides a mean to evaluate patterns based on both MRI and clinical features, independent of epilepsy type. This revealed one significant LV (35.2% explained variance, p perm < .05). Here BSRs were significantly modulated by metric type (F 3,102 = 13.91, p < .001), structure (F 1,102 = 6.814, p < .05) and side (F 1,102 = 7.680, p < .01). Contributions predominantly came from T1 (p < .001 compared to deformation‐based features), thalamic (p < .05 compared to other basal ganglia) and contralateral (p < .05 compared to ipsilateral) features (Figure 7a). With regards to the clinical characteristics, strongest contributions were found for the number of epileptic zones, but also presence of MRI‐detectable lesion(s), disease duration (years) and seizure frequency (all p boot < .05, Figure 7b). Pink bars indicate associations that were significant at p boot < .05. Surface projections reveal that volume features contributing robustly to the LV were found predominately within the thalamus, while T1 features were found more widespread across the basal ganglia (Figure S4). Again, volume and shape show similar surface‐wise projections.
FIGURE 7.
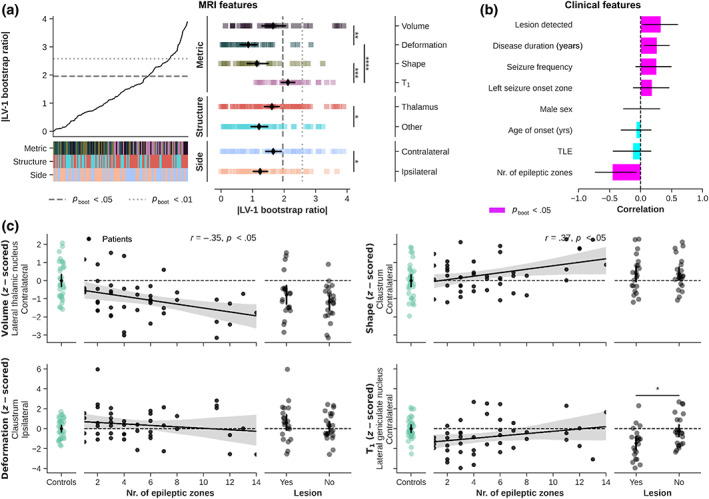
Behavioral PLS results. (a) Line plot shows sorted bootstrapped ratios with heatmaps indicating feature properties (metric type, structure, and side, color‐coded as in Figure 2). Strip plot shows the decomposition of features based on feature properties with black diamonds indicating average BSR (±95% CI). (b) Ranking of clinical features in terms of correlation with the LV. (c) Correlation between clinical features and MRI‐based z‐scores. *p < .05; **p < .01; ***p < .005; ****p < .001; Bonferroni corrected in case of multiple comparisons.
Finally, the scatterplots in Figure 7c visualize the correlations between covarying MRI and clinical features (number of epileptic zones and visible lesion, yes/no). We choose to show the MRI features with the highest BSR for each metric type. Here, lateral thalamic volume was lower in patients characterized by an increased number of epileptic zones, r (42) = −.35, p < .05. A similar (but inverse) pattern is visible for the claustrum's shape, r (42) = .37, p < .05. T1 in the lateral geniculate nucleus seem to be reduced in patients with a visible lesion compared to patients without a lesion (p < .05).
3.4. Replicating using THOMAS
To assess the dependence of current results on the atlas choice, all analyses were repeated but using the THOMAS atlas for the thalamic segmentations. These can be found in the Supplementary Results (section “Replicating using THOMAS”). Briefly, analyses conducted using thalamic results using the THOMAS atlas showed the same direction of differences as with the 7TAMIBrain atlas. Nonetheless, while remaining below significance threshold using the 7TAMIBrain atlas, the impact of seizure onset side was stronger across the different metrics using THOMAS. For example, average ipsi‐ versus contralateral T1 differed significantly between TLE and NTLE patients (p < .05).
4. DISCUSSION
Our cohort of focal epilepsy patients showed unprecedently described structural abnormalities across the thalamus and basal ganglia. In general, the strongest impact was observed for TLE patients. The spatial pattern of these differences and the contribution of the different metrics varied depending on whether the patient data was contrasted against controls or among themselves.
4.1. Thalamic structural alterations
Focal epilepsy patients showed significant reduction in thalamic volume, as well as increased—although characterized by smaller effect sizes—tissue deformation and shape values. These indicators of atrophy are in line with prior research in TLE (Bernhardt et al., 2012; Keller et al., 2014; Natsume et al., 2003) and as recently demonstrated on a larger scale using the multisite ENIGMA Epilepsy dataset (Whelan et al., 2018). Here, we confirm this phenomenon in our TLE and NTLE focal epilepsy cohort. This is not surprising given the widespread thalamo‐cortical connectivity (Lambert et al., 2017) and its implications in seizure initiation, propagation, spread (Bertram et al., 2008; Guye et al., 2006; Pizzo et al., 2021) as well as focal to bilateral tonic–clonic seizures (Sinha et al., 2021). Moreover, the ipsilateral predominance of global thalamic atrophy could intuitively be explained by the thalamo‐cortical connectivity during seizures. This has been illustrated previously by accurate prediction of seizure onset laterality in TLE patients based on individual thalamo‐hippocampal functional connectivity scores (Barron et al., 2015).
Deformation and shape might provide complementary and spatial‐specific insight into volume‐based thalamic structural alterations, especially at the scale of individual thalamic nuclei. Indeed, the lack of significant effects for the medial nucleus for both deformation and shape are indicative of spatially homogeneous alterations leading to an overall decrease in volume. Conversely, differences in shape and deformity may reflect preferential changes in pulvinar subparts that sum up to atrophy based on volume alone. In addition, isolated changes in the deformation of the anterior nucleus of the thalamus without volume, T1, or shape changes may suggest structural remodeling. Please see Section 6.2 for a more in‐depth discussion at the level of the individual nuclei.
Most interestingly, we report longitudinal relaxation data for the thalamus and other basal ganglia in both TLE and NTLE drug‐resistant patients characterized by SEEG (i.e., Figure 2). In contrast to the data reported in the cortex (Bernhardt et al., 2018) and thalamus previously (Tang et al., 2022), we found a decrease in thalamic T1. It is known that T1 shortens with increasing myelin and iron (i.e., ferritin) concentrations (Stüber et al., 2014). Therefore, the observed decrease in T1 can be attributed to higher levels of myelin and/or iron in patients compared to controls. In particular the latter is a hallmark of several neurological and neurodegenerative diseases (Ward et al., 2014). In epilepsy, using pilocarpine‐treated rats to induce a status epilepticus, iron (and calcium) deposits were selectively observed across the thalamus (Aggarwal et al., 2018). Potential mechanisms leading to iron accumulation include increased blood–brain barrier (BBB) permeability, inflammation, iron redistribution within the brain, and changes in iron homoeostasis (Ward et al., 2014). It remains unclear, however, if these abnormalities are mainly caused by seizures, or by the evolution of the disease and neurodegenerative processes. Leek et al. (2021) showed that volumetric abnormalities of structures known to be important for the generation and maintenance of focal seizures are established at the time of epilepsy diagnosis and are not necessarily a result of the chronicity of the disorder (Leek et al., 2021). On the other hand, longitudinal tracking of cortical thickness in TLE patients showed progressive thinning with longer disease duration, particularly in regions structurally connected with the ipsilateral hippocampus (Galovic et al., 2019).
Furthermore, differences between cortical and thalamus tissue and their increase (Bernhardt et al., 2018) versus decrease in T1, respectively, might be explained based on their tissue's organization including their connectivity. Cortical cyto‐ and myeloarchitecture is organized in a laminar fashion along a sheet‐like structure with cortical myelination gradually decreasing toward the pial surface and layer‐specific feed‐forward and feedback projections (Nieuwenhuys, 2013). This laminar organizational principle is not in place for thalamic gray matter with nuclei‐specific (sub)cortical projections (Morel et al., 1997). This imposes a dense network of innervating fiber bundles with high levels of crossing fibers (Behrens et al., 2003; Clascá et al., 2012). Given the important role of the thalamus in seizure organization and therefore widespread participation during seizures, changes in thalamic T1 might be dominated by pathophysiological processes (e.g., BBB dysfunctioning; Rüber et al., 2018) that cause iron to accumulate (Pizzo et al., 2021; Ward et al., 2014). In contrast, demyelination as also observed in postsurgical tissue derived from cortical dysplasia might be the predominant driver of the increase in cortical T1 (de Curtis et al., 2021). Also, while atrophy has been observed across both cortical and subcortical areas, differences in the microstructural environment (e.g., macromolecular composition) might render the impact of neuronal loss on T1 relaxation differently (Beaulieu, 2002; Mezer et al., 2013). Nonetheless, based on T1 relaxation time alone, it remains difficult to explain the histological and molecular translation of the observed changes. Multivariate analyses with other quantitative metrics, like the tissue's transverse relaxation time (T2*), susceptibility value (QSM) and diffusion properties (e.g., fractional anisotropy and mean diffusivity) are necessary to better explain this observed decrease in T1. This has proven to be beneficial at the cortical level with better discrimination of normal and abnormal neuron density in neocortical gray matter when T1 is combined with FA (Goubran et al., 2015), leading to better separation between left and right TLE (Khan et al., 2014).
4.2. Multi‐scale structural alterations
The thalamus as a whole and by itself provides relevant information to better understand the disease processes in focal epilepsy. However, the human thalamus hosts several nuclei with varying cytoarchitectonic features and projections innervating distinct (sub)cortical regions (Clascá et al., 2012; Jones, 2009). Therefore, thalamic nuclei might be differentially affected depending on epilepsy type (i.e., TLE vs. NTLE), EZN characteristics and other clinical features. Moreover, thalamic connectivity with basal ganglia warrant investigation of covarying patterns among subcortical structures (DeLong & Wichmann, 2007; Kai et al., 2022; Lenglet et al., 2012). To do so, we performed multivariate mapping of MRI‐based subcortical features and patient characteristics (i.e., epilepsy type or clinical features) using mean‐centered and behavioral PLS (Kirschner et al., 2020; McIntosh & Mišić, 2013), to isolate latent clinical‐anatomical dimensions of focal epilepsy. Understanding the heterogeneity of clinical and anatomical manifestations of focal epilepsy remains a major challenge (Whelan et al., 2018). A closer inspection and comparison of the primary LVs derived from PLS analyses using the data presented here revealed several interesting findings. First, while volume‐based measures appeared to be most discriminative when control data were included, T1 measurements gain importance with respect to other metric types when discriminating across patients only. This was evident based on the MRI features only (i.e., mean‐centered PLS), as well as when combined with the clinical features (behavioral PLS). Second, the spatial patterns of the LVs appear to be characterized by different topological modes with robust features either (i) confined to a set of thalamic nuclei or (ii) spread across the entire subcortex. When focusing on the thalamus again, morphometric abnormalities within the posteromedial thalamus, including the pulvinar and mediodorsal nucleus, acted as dominant discriminators between patients and controls. On the other hand, epilepsy types were best separated by their T1 within the posterolateral portion of the thalamus, in particular. Together, these patterns follow the same trend as the group‐level analyses and suggest that predisposition of thalamic nuclei to alterations (Aggarwal et al., 2018) may depend on the property being evaluated but also on clinical characteristics, such as the location and/or number of epileptogenic zones. The medial pulvinar has been implicated in focal epilepsy based on frequently observed ictal activity changes during temporal lobe seizures (Guye et al., 2006; Rosenberg et al., 2006) and its atrophy (Keller et al., 2014) has been proposed as potential target for therapeutic deep brain stimulation (DBS) in drug‐resistant epilepsies (Filipescu et al., 2019). Similarly, given its connectivity with the amygdala and temporal cortex (Behrens et al., 2003), the mediodorsal nucleus has been studied in the context of (medial) temporal lobe epilepsy. For example, rats experiencing status epilepticus and then developing epilepsy had a decrease in volume of the mediodorsal thalamic region related to histological indicators of neuronal loss (Bertram et al., 2001). Extending these findings to humans, mediodorsal and posterior thalamic gray matter density was reduced in TLE patients (Barron et al., 2012) and in patients with persistent seizures compared to patients without seizures after surgery (Keller et al., 2015). On the other hand, spatial specificity of T1 decreases toward the lateral thalamus in focal epilepsy (as well as across epilepsy types) could be explained by the interaction between activity‐regulated myelination (Gibson et al., 2014) and seizure pathophysiology. Increased seizure network myelination after epilepsy onset has recently been demonstrated in rat models of absence seizures and generalized epilepsy (Knowles et al., 2022). This, together with the strong connectivity of the lateral thalamus to somatosensory, posterior and parietal areas, organized along an anterior–posterior axis, might explain the consistent decrease in T1 for the lateral thalamic nuclei in our patient cohort (Behrens et al., 2003). The anterior nucleus volume and T1 appeared relatively unaffected. This is surprising given the frequent involvement of the limbic system in the TLE group. Potential explanations could be its small size, shape variability (as also shown in this work; Hughes et al., 2012), and its close vicinity to white matter (i.e., internal medullary lamina) which can influence segmentation accuracy. Furthermore, anterior nucleus atrophy has been reported to be particularly associated with hippocampal sclerosis, which was not reported in our cohort (Chan et al., 1997).
However, in line with earlier work using structural covariance networks in TLE and idiopathic generalized epilepsy (Whelan et al., 2018), our LVs show that volume‐based patterns extend beyond the thalamic borders and involve basal ganglia such as internal globus pallidus and striatum as well. This pattern might represent the same shared patterns of structural abnormalities across different epilepsies as suggested by Whelan et al. (2018), despite the heterogeneity of epilepsy and seizure types. Our results complement other recent studies of multivariate analyses in focal epilepsy. For example, Lee et al. (2022) identified several MRI‐based components spanning cortical and white matter tissue that described interindividual variability in TLE. Within a framework to predict treatment response or surgery outcome, these outperformed classifiers that did not operate on latent factor information. Another multivariate approach emphasized a close coupling of cognitive dysfunction and large‐scale network anomalies in TLE (Rodríguez‐Cruces et al., 2020). Here we show that subcortical volume measures allow discrimination between patients and controls, while T1 measures look promising to further differentiate patients based on epilepsy type. Altogether, these multivariate results demonstrate the brain‐phenotypic complexity of focal epilepsy at the whole‐brain scale with the extent, interplay and type of changes depending on brain compartment as well as clinical phenotype.
4.3. Methodological considerations and study limitations
Although the consistency across thalamic segmentation protocols corroborates the robustness of our results, they might not be generalizable to external datasets and those acquired at lower field strengths, in particular.
T1 is dependent on magnetic field strength with the level of dependency varying based on tissue characteristics (i.e., low vs. high molecular mobility; Rooney et al., 2007). It has been shown that 7T allows detection of epileptogenic lesions not visible at 3T (Opheim et al., 2020). Therefore, based on typical acquisitions performed at 3T and 7T, differences in the signal‐ and contrast‐to‐noise ratios of T1 data will impact sensitivity to segment individual nuclei as well as the power to detect patient‐control morphometric and T1 differences at lower field strengths (Le Ster et al., 2022; Pohmann et al., 2016). Precise delineation and quantification of thalamic nuclei and basal ganglia have become feasible with the advent of 7T MRI and the possibility to map T1 both at a submillimeter resolution and (relatively) fast using the MP2RAGE sequence (Marques et al., 2010). As a result, multiple protocols have been proposed, including the one developed in‐house (Brun et al., 2022), to segment thalamic nuclei and basal ganglia from such data (Datta et al., 2021; Su et al., 2019). When we compared results from our in‐house 7TAMIBrain atlas method with those from another popular approach (THOMAS), thalamic volumetric measurements appear relatively similar despite differences in segmentation algorithm and nuclei definitions. In addition, brain tissue segmentations based on (quantitative) MRI data like transmit field (B1 +)‐corrected MP2RAGE maps are known to be more robust and accurate than those based on uncorrected images affected by residual B1 + biases (Haast et al., 2018; Haast et al., 2021; Marques & Gruetter, 2013). In parallel, current results provide a proof‐of‐concept to assess morphometric and T1 properties of the claustrum—a deep brain structure characterized by challenging anatomy with its thin sheet of neurons, enclosed by white matter and situated between the insula and the putamen (Mathur, 2014)—in a clinical population.
Our cohort is limited in the number of patients diagnosed with non‐temporal epilepsies. Consequently, we have pooled all NTLE patients into a single patient group, with the risk of losing sensitivity during group‐level comparisons. Moreover, the statistical significance of the PLS LVs were evaluated within a descriptive framework to detect above‐chance associations in the current dataset. As such, we did not test whether such associations generalize to new data. For example, our cohort consists of rather challenging patients that required SEEG and replication using a separate cohort with a different number of patients per epilepsy type might rank MRI features differently and lead to different conclusions. Evaluation of out‐of‐sample correlation and predictive performance using an independent and larger study cohort is needed. It is therefore our hope that in the future a similar action will be undertaken to establish a multisite 7T epilepsy data as achieved by the ENIGMA Epilepsy study group (Sisodiya et al., 2022). As a first step, recent efforts by the 7T Epilepsy Task Force led to practical recommendations on targeted use of 7T MRI in the clinical management of patients with epilepsy (Opheim et al., 2020). Such datasets will help mitigate problems related to limited sample sizes as well as means to investigate potential methodological biases.
5. CONCLUSION AND FUTURE DIRECTIONS
This work reveals multi‐scale—based on multiple parameters across different structures—subcortical alterations in focal epilepsy patients using 7T MRI data. It shows that the relative importance for different MRI features across subcortical structures depend on whether the goal is to isolate patients from controls or to differentiate between epilepsy types. Moreover, these results provide a comprehensive representation of the subcortical phenotype of focal epilepsy and its correlation with clinical parameters. In future work, integration of (i) other quantitative MRI, as well as (ii) electrophysiological data might allow us to better understand its direct relation to the structures' microstructural and epileptogenic properties, respectively. Moreover, extending this framework to the cortex provides opportunities to investigate the impact of subcortical alterations on the brain's system‐wide functioning. Finally, since deep brain stimulation is largely based on empirical protocols, comprehensive mapping of subcortical changes and relationship with disease heterogeneity might contribute to an improved treatment planning and outcome.
FUNDING INFORMATION
This study received funding from the French government under the “Programme Investissements d'Avenir”, Excellence Initiative of Aix‐Marseille University—A*MIDEX (AMX‐19IET‐004), 7TEAMS Chair, EPINOV (ANR‐17‐RHUS‐0004) and the European Union's Horizon 2020 Framework Program (785907 and 945539). Author Roy A. M. Haast was supported by a Marie Skłodowska‐Curie Actions Postdoctoral Fellowship (101061988).
CONFLICT OF INTEREST STATEMENT
The authors declare no conflicts of interest.
Supporting information
Figure S1. Schematic display of the surface‐based morphometry pipeline. (A and C) Subject‐specific subcortical surfaces in MNI space were first reconstructed from the segmentation results. (B) Surfaces from control subjects were then used to build a canonical surface that served as reference for vertex‐wise quantification of in‐ and outward displacement through an iterative process (in orange, D and E).
Figure S2. Impact of confounding factors (columns) on the different MRI metrics, with and without prior adjustment (rows). Significant positive and negative Pearson's correlations between confounding values and MRI metrics are shown in red and blue, respectively.
Figure S3. Flow diagram of the various preprocessing steps.
Figure S4. Projection of significant bootstrapped ratio values (color‐coded), based on mean‐centered partial‐least squares analyses (i.e., between epilepsy types), onto the structures' surface reconstructions. Results are separated per MRI metric type (rows). Black solid lines indicate structure boundaries.
Figure S5. Projection of significant bootstrapped ratio values (color‐coded), based on behavioral partial‐least squares analyses (i.e., across patients using clinical characteristics), onto the structures' surface reconstructions. Results are separated per MRI metric type (rows). Black solid lines indicate structure boundaries.
Data S1. Supplementary Methods.
Data S2. Supplementary Results.
ACKNOWLEDGMENTS
We would like to thank the patients and control participants who agreed to take part in this study. The authors would like to thank Patrick Viout, Lauriane Pini, Claire Costes, and Veronique Gimenez for data acquisition and study logistics, and Lucas Gauer and Olivier Girard for their fruitful discussion on the presented results and/or support at various stages of this project.
Haast, R. A. M. , Testud, B. , Makhalova, J. , Dary, H. , Cabane, A. , Le Troter, A. , Ranjeva, J.‐P. , Bartolomei, F. , & Guye, M. (2023). Multi‐scale structural alterations of the thalamus and basal ganglia in focal epilepsy using 7T MRI . Human Brain Mapping, 44(13), 4754–4771. 10.1002/hbm.26414
Roy A. M. Haast and Benoit Testud contributed equally to this work.
DATA AVAILABILITY STATEMENT
Code to reproduce this work can be found online (https://github.com/royhaast/smk-epilepsy-7T-sctx). The data are not publicly available due to sensitive information that could compromise the privacy of research participants. Nonetheless, anonymized data are available from the corresponding author on reasonable request.
REFERENCES
- Aggarwal, M. , Li, X. , Gröhn, O. , & Sierra, A. (2018). Nuclei‐specific deposits of iron and calcium in the rat thalamus after status epilepticus revealed with quantitative susceptibility mapping (QSM). Journal of Magnetic Resonance Imaging, 47(2), 554–564. 10.1002/jmri.25777 [DOI] [PMC free article] [PubMed] [Google Scholar]
- Avants, B. B. , Epstein, C. L. , Grossman, M. , & Gee, J. C. (2008). Symmetric diffeomorphic image registration with cross‐correlation: Evaluating automated labeling of elderly and neurodegenerative brain. Medical Image Analysis, 12(1), 26–41. 10.1016/j.media.2007.06.004 [DOI] [PMC free article] [PubMed] [Google Scholar]
- Avants, B. B. , Tustison, N. J. , Song, G. , Cook, P. A. , Klein, A. , & Gee, J. C. (2011). A reproducible evaluation of ANTs similarity metric performance in brain image registration. NeuroImage, 54(3), 2033–2044. 10.1016/j.neuroimage.2010.09.025 [DOI] [PMC free article] [PubMed] [Google Scholar]
- Barron, D. S. , Fox, P. M. , Laird, A. R. , Robinson, J. L. , & Fox, P. T. (2012). Thalamic medial dorsal nucleus atrophy in medial temporal lobe epilepsy: A VBM meta‐analysis. NeuroImage: Clinical, 2, 25–32. 10.1016/j.nicl.2012.11.004 [DOI] [PMC free article] [PubMed] [Google Scholar]
- Barron, D. S. , Fox, P. T. , Pardoe, H. , Lancaster, J. , Price, L. R. , Blackmon, K. , Berry, K. , Cavazos, J. E. , Kuzniecky, R. , Devinsky, O. , & Thesen, T. (2015). Thalamic functional connectivity predicts seizure laterality in individual TLE patients: Application of a biomarker development strategy. NeuroImage: Clinical, 7, 273–280. 10.1016/j.nicl.2014.08.002 [DOI] [PMC free article] [PubMed] [Google Scholar]
- Bartolomei, F. , Chauvel, P. , & Wendling, F. (2008). Epileptogenicity of brain structures in human temporal lobe epilepsy: A quantified study from intracerebral EEG. Brain, 131(Pt 7), 1818–1830. 10.1093/brain/awn111 [DOI] [PubMed] [Google Scholar]
- Bartolomei, F. , Lagarde, S. , Wendling, F. , McGonigal, A. , Jirsa, V. , Guye, M. , & Bénar, C. (2017). Defining epileptogenic networks: Contribution of SEEG and signal analysis. Epilepsia, 58(7), 1131–1147. 10.1111/epi.13791 [DOI] [PubMed] [Google Scholar]
- Beaulieu, C. (2002). The basis of anisotropic water diffusion in the nervous system—A technical review. NMR in Biomedicine, 15(7–8), 435–455. 10.1002/nbm.782 [DOI] [PubMed] [Google Scholar]
- Behrens, T. E. J. , Johansen‐Berg, H. , Woolrich, M. W. , Smith, S. M. , Wheeler‐Kingshott, C. A. M. , Boulby, P. A. , Barker, G. J. , Sillery, E. L. , Sheehan, K. , Ciccarelli, O. , Thompson, A. J. , Brady, J. M. , & Matthews, P. M. (2003). Non‐invasive mapping of connections between human thalamus and cortex using diffusion imaging. Nature Neuroscience, 6(7), 750–757. 10.1038/nn1075 [DOI] [PubMed] [Google Scholar]
- Bell, P. T. , & Shine, J. M. (2016). Subcortical contributions to large‐scale network communication. Neuroscience and Biobehavioral Reviews, 71, 313–322. 10.1016/j.neubiorev.2016.08.036 [DOI] [PubMed] [Google Scholar]
- Bernhardt, B. C. , Bernasconi, N. , Kim, H. , & Bernasconi, A. (2012). Mapping thalamocortical network pathology in temporal lobe epilepsy. Neurology, 78(2), 129–136. 10.1212/WNL.0b013e31823efd0d [DOI] [PubMed] [Google Scholar]
- Bernhardt, B. C. , Fadaie, F. , Vos de Wael, R. , Hong, S. J. , Liu, M. , Guiot, M. C. , Rudko, D. A. , Bernasconi, A. , & Bernasconi, N. (2018). Preferential susceptibility of limbic cortices to microstructural damage in temporal lobe epilepsy: A quantitative T1 mapping study. NeuroImage, 182, 294–303. 10.1016/j.neuroimage.2017.06.002 [DOI] [PubMed] [Google Scholar]
- Bertram, E. H. , Mangan, P. S. , Zhang, D. , Scott, C. A. , & Williamson, J. M. (2001). The midline thalamus: Alterations and a potential role in limbic epilepsy. Epilepsia, 42(8), 967–978. 10.1046/j.1528-1157.2001.042008967.x [DOI] [PubMed] [Google Scholar]
- Bertram, E. H. , Zhang, D. , & Williamson, J. M. (2008). Multiple roles of midline dorsal thalamic nuclei in induction and spread of limbic seizures. Epilepsia, 49(2), 256–268. 10.1111/j.1528-1167.2007.01408.x [DOI] [PubMed] [Google Scholar]
- Brun, G. , Testud, B. , Girard, O. M. , Lehmann, P. , de Rochefort, L. , Besson, P. , Massire, A. , Ridley, B. , Girard, N. , Guye, M. , Ranjeva, J. P. , & le Troter, A. (2022). Automatic segmentation of deep grey nuclei using a high‐resolution 7T magnetic resonance imaging atlas‐quantification of T1 values in healthy volunteers. The European Journal of Neuroscience, 55(2), 438–460. 10.1111/ejn.15575 [DOI] [PubMed] [Google Scholar]
- Chan, S. , Erickson, J. K. , & Yoon, S. S. (1997). Limbic system abnormalities associated with mesial temporal sclerosis: A model of chronic cerebral changes due to seizures. Radio Graphics, 17(5), 1095–1110. 10.1148/radiographics.17.5.9308104 [DOI] [PubMed] [Google Scholar]
- Clascá, F. , Rubio‐Garrido, P. , & Jabaudon, D. (2012). Unveiling the diversity of thalamocortical neuron subtypes. European Journal of Neuroscience, 35(10), 1524–1532. 10.1111/j.1460-9568.2012.08033.x [DOI] [PubMed] [Google Scholar]
- Datta, R. , Bacchus, M. K. , Kumar, D. , Elliott, M. A. , Rao, A. , Dolui, S. , Reddy, R. , Banwell, B. L. , & Saranathan, M. (2021). Fast automatic segmentation of thalamic nuclei from MP2RAGE acquisition at 7 Tesla. Magnetic Resonance in Medicine, 85(5), 2781–2790. 10.1002/mrm.28608 [DOI] [PubMed] [Google Scholar]
- de Curtis, M. , Garbelli, R. , & Uva, L. (2021). A hypothesis for the role of axon demyelination in seizure generation. Epilepsia, 62(3), 583–595. 10.1111/epi.16824 [DOI] [PubMed] [Google Scholar]
- DeLong, M. R. , & Wichmann, T. (2007). Circuits and circuit disorders of the basal ganglia. Archives of Neurology, 64(1), 20–24. 10.1001/archneur.64.1.20 [DOI] [PubMed] [Google Scholar]
- Drenthen, G. S. , Backes, W. H. , Rouhl, R. P. W. , Vlooswijk, M. C. G. , Majoie, M. H. J. M. , Hofman, P. A. M. , Aldenkamp, A. P. , & Jansen, J. F. A. (2018). Structural covariance networks relate to the severity of epilepsy with focal‐onset seizures. NeuroImage: Clinical, 20, 861–867. 10.1016/j.nicl.2018.09.023 [DOI] [PMC free article] [PubMed] [Google Scholar]
- Duyn, J. H. (2018). Studying brain microstructure with magnetic susceptibility contrast at high‐field. NeuroImage, 168, 152–161. 10.1016/j.neuroimage.2017.02.046 [DOI] [PMC free article] [PubMed] [Google Scholar]
- Fattorusso, A. , Matricardi, S. , Mencaroni, E. , Dell'Isola, G. B. , di Cara, G. , Striano, P. , & Verrotti, A. (2021). The pharmacoresistant epilepsy: An overview on existent and new emerging therapies. Frontiers in Neurology, 12, 674483. 10.3389/fneur.2021.674483 [DOI] [PMC free article] [PubMed] [Google Scholar]
- Filipescu, C. , Lagarde, S. , Lambert, I. , Pizzo, F. , Trébuchon, A. , McGonigal, A. , Scavarda, D. , Carron, R. , & Bartolomei, F. (2019). The effect of medial pulvinar stimulation on temporal lobe seizures. Epilepsia, 60(4), e25–e30. 10.1111/epi.14677 [DOI] [PubMed] [Google Scholar]
- Fischl, B. (2012). Free surfer. NeuroImage, 62(2), 774–781. 10.1016/j.neuroimage.2012.01.021 [DOI] [PMC free article] [PubMed] [Google Scholar]
- Galovic, M. , van Dooren, V. Q. H. , Postma, T. S. , Vos, S. B. , Caciagli, L. , Borzì, G. , Cueva Rosillo, J. , Vuong, K. A. , de Tisi, J. , Nachev, P. , Duncan, J. S. , & Koepp, M. J. (2019). Progressive cortical thinning in patients with focal epilepsy. JAMA Neurology, 76(10), 1230–1239. 10.1001/jamaneurol.2019.1708 [DOI] [PMC free article] [PubMed] [Google Scholar]
- Gibson, E. M. , Purger, D. , Mount, C. W. , Goldstein, A. K. , Lin, G. L. , Wood, L. S. , Inema, I. , Miller, S. E. , Bieri, G. , Zuchero, J. B. , Barres, B. A. , Woo, P. J. , Vogel, H. , & Monje, M. (2014). Neuronal activity promotes oligodendrogenesis and adaptive myelination in the mammalian brain. Science, 344(6183), 1252304. 10.1126/science.1252304 [DOI] [PMC free article] [PubMed] [Google Scholar]
- Girard, O. , De Rochefort, L. , Guye, M. , Ranjeva, J.‐P. , & Troter, A. L. (2021). 7TAMIbrain . 10.18112/OPENNEURO.DS003967.V1.0.0 [DOI]
- Goubran, M. , Hammond, R. R. , de Ribaupierre, S. , Burneo, J. G. , Mirsattari, S. , Steven, D. A. , Parrent, A. G. , Peters, T. M. , & Khan, A. R. (2015). Magnetic resonance imaging and histology correlation in the neocortex in temporal lobe epilepsy. Annals of Neurology, 77(2), 237–250. 10.1002/ana.24318 [DOI] [PubMed] [Google Scholar]
- Guye, M. , Régis, J. , Tamura, M. , Wendling, F. , McGonigal, A. , Chauvel, P. , & Bartolomei, F. (2006). The role of corticothalamic coupling in human temporal lobe epilepsy. Brain, 129(Pt 7), 1917–1928. 10.1093/brain/awl151 [DOI] [PubMed] [Google Scholar]
- Haast, R. A. M. , Ivanov, D. , & Uludağ, K. (2018). The impact of B1+ correction on MP2RAGE cortical T1 and apparent cortical thickness at 7T. Human Brain Mapping, 39(6), 2412–2425. 10.1002/hbm.24011 [DOI] [PMC free article] [PubMed] [Google Scholar]
- Haast, R. A. M. , Lau, J. C. , Ivanov, D. , Menon, R. S. , Uludağ, K. , & Khan, A. R. (2021). Effects of MP2RAGE B1+ sensitivity on inter‐site T1 reproducibility and hippocampal morphometry at 7T. NeuroImage, 224, 117373. 10.1016/j.neuroimage.2020.117373 [DOI] [PubMed] [Google Scholar]
- Hughes, E. J. , Bond, J. , Svrckova, P. , Makropoulos, A. , Ball, G. , Sharp, D. J. , Edwards, A. D. , Hajnal, J. V. , & Counsell, S. J. (2012). Regional changes in thalamic shape and volume with increasing age. NeuroImage, 63(3), 1134–1142. 10.1016/j.neuroimage.2012.07.043 [DOI] [PMC free article] [PubMed] [Google Scholar]
- Isnard, J. , Taussig, D. , Bartolomei, F. , Bourdillon, P. , Catenoix, H. , Chassoux, F. , Chipaux, M. , Clémenceau, S. , Colnat‐Coulbois, S. , Denuelle, M. , Derrey, S. , Devaux, B. , Dorfmüller, G. , Gilard, V. , Guenot, M. , Job‐Chapron, A. S. , Landré, E. , Lebas, A. , Maillard, L. , … Sauleau, P. (2018). French guidelines on stereoelectroencephalography (SEEG). Neurophysiologie Clinique, 48(1), 5–13. 10.1016/j.neucli.2017.11.005 [DOI] [PubMed] [Google Scholar]
- Jones, E. G. (2009). Synchrony in the interconnected circuitry of the thalamus and cerebral cortex. Annals of the New York Academy of Sciences, 1157, 10–23. 10.1111/j.1749-6632.2009.04534.x [DOI] [PubMed] [Google Scholar]
- Kai, J. , Khan, A. R. , Haast, R. A. , & Lau, J. C. (2022). Mapping the subcortical connectome using in vivo diffusion MRI: Feasibility and reliability. NeuroImage, 262, 119553. 10.1016/j.neuroimage.2022.119553 [DOI] [PubMed] [Google Scholar]
- Kashyap, S. (2021). srikash/presurfer: ondu . 10.5281/zenodo.4626841 [DOI]
- Kashyap, S. , Ivanov, D. , Havlicek, M. , Huber, L. , Poser, B. A. , & Uludağ, K. (2021). Sub‐millimetre resolution laminar fMRI using arterial spin labelling in humans at 7 T. PLoS One, 16(4), e0250504. 10.1371/journal.pone.0250504 [DOI] [PMC free article] [PubMed] [Google Scholar]
- Keller, S. S. , O'Muircheartaigh, J. , Traynor, C. , Towgood, K. , Barker, G. J. , & Richardson, M. P. (2014). Thalamotemporal impairment in temporal lobe epilepsy: A combined MRI analysis of structure, integrity, and connectivity. Epilepsia, 55(2), 306–315. 10.1111/epi.12520 [DOI] [PMC free article] [PubMed] [Google Scholar]
- Keller, S. S. , Richardson, M. P. , Schoene‐Bake, J. C. , O'Muircheartaigh, J. , Elkommos, S. , Kreilkamp, B. , Goh, Y. Y. , Marson, A. G. , Elger, C. , & Weber, B. (2015). Thalamotemporal alteration and postoperative seizures in temporal lobe epilepsy. Annals of Neurology, 77(5), 760–774. 10.1002/ana.24376 [DOI] [PMC free article] [PubMed] [Google Scholar]
- Khan, A. R. , Goubran, M. , de Ribaupierre, S. , Hammond, R. R. , Burneo, J. G. , Parrent, A. G. , & Peters, T. M. (2014). Quantitative relaxometry and diffusion MRI for lateralization in MTS and non‐MTS temporal lobe epilepsy. Epilepsy Research, 108(3), 506–516. 10.1016/j.eplepsyres.2013.12.012 [DOI] [PubMed] [Google Scholar]
- Khan, A. R. , Hiebert, N. M. , Vo, A. , Wang, B. T. , Owen, A. M. , Seergobin, K. N. , & MacDonald, P. A. (2019). Biomarkers of Parkinson's disease: Striatal sub‐regional structural morphometry and diffusion MRI. NeuroImage: Clinical, 21, 101597. 10.1016/j.nicl.2018.11.007 [DOI] [PMC free article] [PubMed] [Google Scholar]
- Kirschner, M. , Shafiei, G. , Markello, R. D. , Makowski, C. , Talpalaru, A. , Hodzic‐Santor, B. , Devenyi, G. A. , Paquola, C. , Bernhardt, B. C. , Lepage, M. , Chakravarty, M. M. , Dagher, A. , & Mišić, B. (2020). Latent clinical‐anatomical dimensions of schizophrenia. Schizophrenia Bulletin, 46(6), 1426–1438. 10.1093/schbul/sbaa097 [DOI] [PMC free article] [PubMed] [Google Scholar]
- Knowles, J. K. , Xu, H. , Soane, C. , Batra, A. , Saucedo, T. , Frost, E. , Tam, L. T. , Fraga, D. , Ni, L. , Villar, K. , Talmi, S. , Huguenard, J. R. , & Monje, M. (2022). Maladaptive myelination promotes generalized epilepsy progression. Nature Neuroscience, 25(5), 596–606. 10.1038/s41593-022-01052-2 [DOI] [PMC free article] [PubMed] [Google Scholar]
- Kwan, P. , Arzimanoglou, A. , Berg, A. T. , Brodie, M. J. , Allen Hauser, W. , Mathern, G. , Moshé, S. L. , Perucca, E. , Wiebe, S. , & French, J. (2010). Definition of drug resistant epilepsy: Consensus proposal by the ad hoc task force of the ILAE commission on therapeutic strategies. Epilepsia, 51(6), 1069–1077. 10.1111/j.1528-1167.2009.02397.x [DOI] [PubMed] [Google Scholar]
- Lambert, C. , Simon, H. , Colman, J. , & Barrick, T. R. (2017). Defining thalamic nuclei and topographic connectivity gradients in vivo. NeuroImage, 158, 466–479. 10.1016/j.neuroimage.2016.08.028 [DOI] [PubMed] [Google Scholar]
- Larivière, S. , Bernasconi, A. , Bernasconi, N. , & Bernhardt, B. C. (2021). Connectome biomarkers of drug‐resistant epilepsy. Epilepsia, 62(1), 6–24. 10.1111/epi.16753 [DOI] [PubMed] [Google Scholar]
- Larivière, S. , Rodríguez‐Cruces, R. , Royer, J. , Caligiuri, M. E. , Gambardella, A. , Concha, L. , Keller, S. S. , Cendes, F. , Yasuda, C. , Bonilha, L. , Gleichgerrcht, E. , Focke, N. K. , Domin, M. , von Podewills, F. , Langner, S. , Rummel, C. , Wiest, R. , Martin, P. , Kotikalapudi, R. , … Bernhardt, B. C. (2020). Network‐based atrophy modeling in the common epilepsies: A worldwide ENIGMA study. Science Advances, 6(47), eabc 6457. 10.1126/sciadv.abc6457 [DOI] [PMC free article] [PubMed] [Google Scholar]
- Larivière, S. , Royer, J. , Rodríguez‐Cruces, R. , Paquola, C. , Caligiuri, M. E. , Gambardella, A. , Concha, L. , Keller, S. S. , Cendes, F. , Yasuda, C. L. , Bonilha, L. , Gleichgerrcht, E. , Focke, N. K. , Domin, M. , von Podewills, F. , Langner, S. , Rummel, C. , Wiest, R. , Martin, P. , … Bernhardt, B. C. (2022). Structural network alterations in focal and generalized epilepsy assessed in a worldwide ENIGMA study follow axes of epilepsy risk gene expression. Nature Communications, 13, 4320. 10.1038/s41467-022-31730-5 [DOI] [PMC free article] [PubMed] [Google Scholar]
- Le Ster, C. , Grant, A. , Van de Moortele, P. F. , Monreal‐Madrigal, A., Adriany, G., Vignaud, A., Mauconduit, F., Rabrait‐Lerman, C., Poser, B. A., Uğurbil, K., & Boulant, N. (2022). Magnetic field strength dependent SNR gain at the center of a spherical phantom and up to 11.7T. Magnetic Resonance in Medicine, 88(5), 2131–2138. 10.1002/mrm.29391 [DOI] [PMC free article] [PubMed] [Google Scholar]
- Lee, H. M. , Fadaie, F. , Gill, R. , Caldairou, B. , Sziklas, V. , Crane, J. , Hong, S. J. , Bernhardt, B. C. , Bernasconi, A. , & Bernasconi, N. (2022). Decomposing MRI phenotypic heterogeneity in epilepsy: A step towards personalized classification. Brain, 145(3), 897–908. 10.1093/brain/awab425 [DOI] [PMC free article] [PubMed] [Google Scholar]
- Leek, N. J. , Neason, M. , Kreilkamp, B. A. K. , de Bezenac, C., Ziso, B., Elkommos, S., Das, K., Marson, A. G., & Keller, S. S. (2021). Thalamohippocampal atrophy in focal epilepsy of unknown cause at the time of diagnosis. European Journal of Neurology, 28(2), 367–376. 10.1111/ene.14565 [DOI] [PubMed] [Google Scholar]
- Lenglet, C. , Abosch, A. , Yacoub, E. , De Martino, F. , Sapiro, G. , & Harel, N. (2012). Comprehensive in vivo mapping of the human basal ganglia and thalamic connectome in individuals using 7T MRI. PLoS One, 7(1), e29153. 10.1371/journal.pone.0029153 [DOI] [PMC free article] [PubMed] [Google Scholar]
- Loring, D. W. , Meador, K. J. , & Lee, G. P. (2004). Determinants of quality of life in epilepsy. Epilepsy & Behavior, 5(6), 976–980. 10.1016/j.yebeh.2004.08.019 [DOI] [PubMed] [Google Scholar]
- Marcus, D. S. , Harwell, J. , Olsen, T. , Hodge, M. , Glasser, M. F. , Prior, F. , Jenkinson, M. , Laumann, T. , Curtiss, S. W. , & van Essen, D. (2011). Informatics and data mining tools and strategies for the human connectome project. Frontiers in Neuroinformatics, 5, 4. 10.3389/fninf.2011.00004 [DOI] [PMC free article] [PubMed] [Google Scholar]
- Marques, J. P. , & Gruetter, R. (2013). New developments and applications of the MP2RAGE sequence—Focusing the contrast and high spatial resolution R1 mapping. PLoS One, 8(7), e69294. 10.1371/journal.pone.0069294 [DOI] [PMC free article] [PubMed] [Google Scholar]
- Marques, J. P. , Kober, T. , Krueger, G. , van der Zwaag, W. , Van de Moortele, P. F. , & Gruetter, R. (2010). MP2RAGE, a self bias‐field corrected sequence for improved segmentation and. NeuroImage, 49(2), 1271–1281. 10.1016/j.neuroimage.2009.10.002 [DOI] [PubMed] [Google Scholar]
- Mathur, B. N. (2014). The claustrum in review. Frontiers in Systems Neuroscience, 8, 48. 10.3389/fnsys.2014.00048 [DOI] [PMC free article] [PubMed] [Google Scholar]
- McIntosh, A. R. , & Mišić, B. (2013). Multivariate statistical analyses for neuroimaging data. Annual Review of Psychology, 64, 499–525. 10.1146/annurev-psych-113011-143804 [DOI] [PubMed] [Google Scholar]
- Mezer, A. , Yeatman, J. D. , Stikov, N. , Kay, K. N. , Cho, N. J. , Dougherty, R. F. , Perry, M. L. , Parvizi, J. , Hua, L. H. , Butts‐Pauly, K. , & Wandell, B. A. (2013). Quantifying the local tissue volume and composition in individual brains with magnetic resonance imaging. Nature Medicine, 19(12), 1667–1672. 10.1038/nm.3390 [DOI] [PMC free article] [PubMed] [Google Scholar]
- Morel, A. , Magnin, M. , & Jeanmonod, D. (1997). Multiarchitectonic and stereotactic atlas of the human thalamus. The Journal of Comparative Neurology, 387(4), 588–630. [DOI] [PubMed] [Google Scholar]
- Natsume, J. , Bernasconi, N. , Andermann, F. , & Bernasconi, A. (2003). MRI volumetry of the thalamus in temporal, extratemporal, and idiopathic generalized epilepsy. Neurology, 60(8), 1296–1300. 10.1212/01.wnl.0000058764.34968.c2 [DOI] [PubMed] [Google Scholar]
- Nieuwenhuys, R. (2013). The myeloarchitectonic studies on the human cerebral cortex of the Vogt‐Vogt school, and their significance for the interpretation of functional neuroimaging data. Brain Structure & Function, 218(2), 303–352. 10.1007/s00429-012-0460-z [DOI] [PubMed] [Google Scholar]
- Opheim, G. , van der Kolk, A. , Bloch, K. M. , Colon, A. J., Davis, K. A., Henry, T. R., Jansen, J. F. A., Jones, S. E, Pan, J. W., Rössler, K., Stein, J. M., Strandberg, M. C., Trattnig, S., Moortele, P‐FV. de., Vargas, M. I., Wang, I., Bartolomei, F., Bernasconi, N., Bernasconi, A., Bernhardt, B., … Guye, M. (2020). 7T epilepsy task force consensus recommendations on the use of 7T in clinical practice. Neurology, 96(7), 327–341. 10.1212/WNL.0000000000011413 [DOI] [PMC free article] [PubMed] [Google Scholar]
- Pizzo, F. , Roehri, N. , Giusiano, B. , Lagarde, S. , Carron, R. , Scavarda, D. , McGonigal, A. , Filipescu, C. , Lambert, I. , Bonini, F. , Trebuchon, A. , Bénar, C. G. , & Bartolomei, F. (2021). The ictal signature of thalamus and basal ganglia in focal epilepsy: A SEEG study. Neurology, 96(2), e280–e293. 10.1212/WNL.0000000000011003 [DOI] [PubMed] [Google Scholar]
- Pohmann, R. , Speck, O. , & Scheffler, K. (2016). Signal‐to‐noise ratio and MR tissue parameters in human brain imaging at 3, 7, and 9.4 Tesla using current receive coil arrays. Magnetic Resonance in Medicine, 75(2), 801–809. 10.1002/mrm.25677 [DOI] [PubMed] [Google Scholar]
- Raamana, P. R. (2020). Conquering confounds and covariates in machine learning with the python library confounds . 10.5281/zenodo.3701528 [DOI]
- Rodríguez‐Cruces, R. , Bernhardt, B. C. , & Concha, L. (2020). Multidimensional associations between cognition and connectome organization in temporal lobe epilepsy. NeuroImage, 213, 116706. 10.1016/j.neuroimage.2020.116706 [DOI] [PubMed] [Google Scholar]
- Rodriguez‐Cruces, R. , Royer, J. , Larivière, S. , Bassett, D. S. , Caciagli, L. , & Bernhardt, B. C. (2022). Multimodal connectome biomarkers of cognitive and affective dysfunction in the common epilepsies. Network Neuroscience, 6(2), 320–338. 10.1162/netn_a_00237 [DOI] [PMC free article] [PubMed] [Google Scholar]
- Rooney, W. D. , Johnson, G. , Li, X. , Cohen, E. R. , Kim, S. G. , Ugurbil, K. , & Springer, C. S. (2007). Magnetic field and tissue dependencies of human brain longitudinal 1H2O relaxation in vivo. Magnetic Resonance in Medicine, 57(2), 308–318. 10.1002/mrm.21122 [DOI] [PubMed] [Google Scholar]
- Rosenberg, D. S. , Mauguière, F. , Demarquay, G. , Ryvlin, P., Isnard, J., Fischer, C., Guénot, M., & Magnin, M. (2006). Involvement of medial pulvinar thalamic nucleus in human temporal lobe seizures. Epilepsia, 47(1), 98–107. 10.1111/j.1528-1167.2006.00375.x [DOI] [PubMed] [Google Scholar]
- Rüber, T. , David, B. , Lüchters, G. , Nass, R. D. , Friedman, A. , Surges, R. , Stöcker, T. , Weber, B. , Deichmann, R. , Schlaug, G. , Hattingen, E. , & Elger, C. E. (2018). Evidence for peri‐ictal blood–brain barrier dysfunction in patients with epilepsy. Brain, 141(10), 2952–2965. 10.1093/brain/awy242 [DOI] [PubMed] [Google Scholar]
- Sherman, S. M. (2016). Thalamus plays a central role in ongoing cortical functioning. Nature Neuroscience, 19(4), 533–541. 10.1038/nn.4269 [DOI] [PubMed] [Google Scholar]
- Shine, J. M. (2021). The thalamus integrates the macrosystems of the brain to facilitate complex, adaptive brain network dynamics. Progress in Neurobiology, 199, 101951. 10.1016/j.pneurobio.2020.101951 [DOI] [PubMed] [Google Scholar]
- Sinha, N. , Peternell, N. , Schroeder, G. M. , Tisi, J. , Vos, S. B. , Winston, G. P. , Duncan, J. S. , Wang, Y. , & Taylor, P. N. (2021). Focal to bilateral tonic–clonic seizures are associated with widespread network abnormality in temporal lobe epilepsy. Epilepsia, 62(3), 729–741. 10.1111/epi.16819 [DOI] [PMC free article] [PubMed] [Google Scholar]
- Sisodiya, S. M. , Whelan, C. D. , Hatton, S. N. , Huynh, K. , Altmann, A. , Ryten, M. , Vezzani, A. , Caligiuri, M. E. , Labate, A. , Gambardella, A. , Ives‐Deliperi, V. , Meletti, S. , Munsell, B. C. , Bonilha, L. , Tondelli, M. , Rebsamen, M. , Rummel, C. , Vaudano, A. E. , Wiest, R. , … Zhang, G. (2022). The ENIGMA—Epilepsy working group: Mapping disease from large data sets. Human Brain Mapping, 43(1), 113–128. 10.1002/hbm.25037 [DOI] [PMC free article] [PubMed] [Google Scholar]
- Stüber, C. , Morawski, M. , Schäfer, A. , Labadie, C. , Wähnert, M. , Leuze, C. , Streicher, M. , Barapatre, N. , Reimann, K. , Geyer, S. , Spemann, D. , & Turner, R. (2014). Myelin and iron concentration in the human brain: A quantitative study of MRI contrast. NeuroImage, 93, 95–106. 10.1016/j.neuroimage.2014.02.026 [DOI] [PubMed] [Google Scholar]
- Su, J. H. , Thomas, F. T. , Kasoff, W. S. , Tourdias, T. , Choi, E. Y. , Rutt, B. K. , & Saranathan, M. (2019). Thalamus optimized multi atlas segmentation (THOMAS): Fast, fully automated segmentation of thalamic nuclei from structural MRI. NeuroImage, 194, 272–282. 10.1016/j.neuroimage.2019.03.021 [DOI] [PMC free article] [PubMed] [Google Scholar]
- Tang, Y. , Su, T. Y. , Choi, J. Y. , Hu, S. , Wang, X. , Sakaie, K. , Murakami, H. , Alexopoulos, A. , Griswold, M. , Jones, S. , Najm, I. , Ma, D. , & Wang, Z. I. (2022). Characterizing thalamic and basal ganglia nuclei in medically intractable focal epilepsy by MR fingerprinting. Epilepsia, 63(8), 1998–2010. 10.1111/epi.17318 [DOI] [PubMed] [Google Scholar]
- Trattnig, S. , Springer, E. , Bogner, W. , Hangel, G. , Strasser, B. , Dymerska, B. , Cardoso, P. L. , & Robinson, S. D. (2018). Key clinical benefits of neuroimaging at 7T. NeuroImage, 168, 477–489. 10.1016/j.neuroimage.2016.11.031 [DOI] [PMC free article] [PubMed] [Google Scholar]
- Wang, H. , Suh, J. W. , Das, S. R. , Pluta, J. B. , Craige, C. , & Yushkevich, P. A. (2013). Multi‐atlas segmentation with joint label fusion. IEEE Transactions on Pattern Analysis and Machine Intelligence, 35(3), 611–623. 10.1109/TPAMI.2012.143 [DOI] [PMC free article] [PubMed] [Google Scholar]
- Ward, R. J. , Zucca, F. A. , Duyn, J. H. , Crichton, R. R. , & Zecca, L. (2014). The role of iron in brain ageing and neurodegenerative disorders. The Lancet Neurology, 13(10), 1045–1060. 10.1016/S1474-4422(14)70117-6 [DOI] [PMC free article] [PubMed] [Google Scholar]
- Whelan, C. D. , Altmann, A. , Botía, J. A. , Jahanshad, N. , Hibar, D. P. , Absil, J. , Alhusaini, S. , Alvim, M. K. M. , Auvinen, P. , Bartolini, E. , Bergo, F. P. G. , Bernardes, T. , Blackmon, K. , Braga, B. , Caligiuri, M. E. , Calvo, A. , Carr, S. J. , Chen, J. , Chen, S. , … Sisodiya, S. M. (2018). Structural brain abnormalities in the common epilepsies assessed in a worldwide ENIGMA study. Brain, 141(2), 391–408. 10.1093/brain/awx341 [DOI] [PMC free article] [PubMed] [Google Scholar]
- Wirsich, J. , Perry, A. , Ridley, B. , Proix, T. , Golos, M. , Bénar, C. , Ranjeva, J. P. , Bartolomei, F. , Breakspear, M. , Jirsa, V. , & Guye, M. (2016). Whole‐brain analytic measures of network communication reveal increased structure–function correlation in right temporal lobe epilepsy. NeuroImage: Clinical, 11, 707–718. 10.1016/j.nicl.2016.05.010 [DOI] [PMC free article] [PubMed] [Google Scholar]
Associated Data
This section collects any data citations, data availability statements, or supplementary materials included in this article.
Supplementary Materials
Figure S1. Schematic display of the surface‐based morphometry pipeline. (A and C) Subject‐specific subcortical surfaces in MNI space were first reconstructed from the segmentation results. (B) Surfaces from control subjects were then used to build a canonical surface that served as reference for vertex‐wise quantification of in‐ and outward displacement through an iterative process (in orange, D and E).
Figure S2. Impact of confounding factors (columns) on the different MRI metrics, with and without prior adjustment (rows). Significant positive and negative Pearson's correlations between confounding values and MRI metrics are shown in red and blue, respectively.
Figure S3. Flow diagram of the various preprocessing steps.
Figure S4. Projection of significant bootstrapped ratio values (color‐coded), based on mean‐centered partial‐least squares analyses (i.e., between epilepsy types), onto the structures' surface reconstructions. Results are separated per MRI metric type (rows). Black solid lines indicate structure boundaries.
Figure S5. Projection of significant bootstrapped ratio values (color‐coded), based on behavioral partial‐least squares analyses (i.e., across patients using clinical characteristics), onto the structures' surface reconstructions. Results are separated per MRI metric type (rows). Black solid lines indicate structure boundaries.
Data S1. Supplementary Methods.
Data S2. Supplementary Results.
Data Availability Statement
Code to reproduce this work can be found online (https://github.com/royhaast/smk-epilepsy-7T-sctx). The data are not publicly available due to sensitive information that could compromise the privacy of research participants. Nonetheless, anonymized data are available from the corresponding author on reasonable request.