

Summary
Synthetic protocols providing mechanical patterns to culture substrate are essential to control the self-condensation of cells for organoid engineering. Here, we present a protocol for preparing hydrogels with mechanical patterns. We describe steps for hydrogel synthesis, mechanical evaluation of the substrate, and time-lapse imaging of cell self-organization. This protocol will facilitate the rational design of culture substrates with mechanical patterns for the engineering of various functional organoids.
For complete details on the use and execution of this protocol, please refer to Takebe et al. (2015) and Matsuzaki et al. (2014, 2022).1,2,3
Subject areas: Biophysics, Atomic Force Microscopy (AFM), Health Sciences, Stem Cells, Organoids, Tissue Engineering, Biotechnology and Bioengineering, Material Sciences
Graphical abstract
Highlights
-
•
A synthetic protocol for a mechanically patterned hydrogel
-
•
Mechanical characterization of the hydrogel
-
•
Time-lapse imaging of cell self-condensation
-
•
Applicable to rational design of a culture substrate for organoid engineering
Publisher’s note: Undertaking any experimental protocol requires adherence to local institutional guidelines for laboratory safety and ethics.
Synthetic protocols providing mechanical patterns to culture substrate are essential to control the self-condensation of cells for organoid engineering. Here, we present a protocol for preparing hydrogels with mechanical patterns. We describe steps for hydrogel synthesis, mechanical evaluation of the substrate, and time-lapse imaging of cell self-organization. This protocol will facilitate the rational design of culture substrates with mechanical patterns for the engineering of various functional organoids.
Before you begin
After the discovery that the differentiation of isolated mesenchymal stems depends4 on the mechanical environment, various molecular biological approaches have been developed to identify the related intra- and intercellular proteins (i.e., mechanosensors).5,6 Weaver et al. first discovered that the morphology of mammary cancer spheroids could be regulated by soft environments.7,8 In 2015, we identified the mechanical interactions that maximize the creation of liver organoids.2 Additionally, Trepat et al. demonstrated that the formation of small intestinal organoids could be precisely controlled by the stiffness of the culture materials.9 Recently, we developed hydrogels, comprising mechanical patterns, to control the self-condensation and structure of liver organoids.3 Similar successive bioengineering processes for shaping cell aggregates into tissue architecture have attracted attention because they provide insights into the mechanisms of organ development.10 Despite the growing demand to develop synthetic materials for culture substrates, there is a limited number of established protocols; one such protocol focuses on preparing a simple mechanical "gradient" in one direction.11
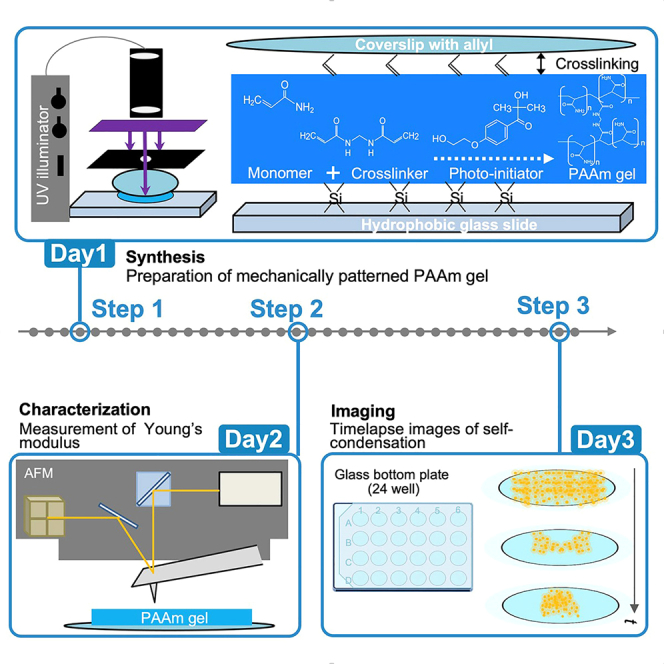
In this paper, we describe a step-by-step protocol for preparing hydrogels with mechanical patterns that enable the control of the self-condensation of cells. We optimized the three steps involved in the protocol, namely, hydrogel synthesis, mechanical evaluation of the substrate, and visualization of the self-organized cells. Step 1 optimized the protocols for hydrogel synthesis with mechanical patterns (Day 1, Step 1-Procedure No. 1 to No. 6). Step 2 evaluated the mechanical properties (Young’s modulus, [kPa]) using atomic force microscopy (AFM) via nanoindentation tests (Day 2, Step 2-Procedure No. 7 to No. 8). Step 3 involved time-lapse imaging of the self-condensation of cells on the hydrogels (Day 3, Step 3-Procedure No. 9 to No. 10). This protocol enabled the reproducible control of the self-condensation of hydrogel substrates with mechanical patterns.
Key resources table
| REAGENT or RESOURCE | SOURCE | IDENTIFIER |
|---|---|---|
| Chemicals, peptides, and recombinant proteins | ||
| Deionized water | Advantech, Japan | GS-200 |
| MilliQ-Synergy | Merck, USA | SYNS0HFWW |
| Circular glass slip | Matsunami, Japan | C012001 |
| Micro slide glass | Matsunami, Japan | S2112 |
| Acetone | Wako, Japan | 019-00353 |
| Methanol | Wako, Japan | 137-01823 |
| Ethanol | Wako, Japan | 057-00451 |
| Chloroform | Wako, Japan | 038-02601 |
| Allyltrichlorosilane | Merck, USA | 107778-5G |
| 40% v/v Acrylamide | Merck, USA | A4058 |
| 2% v/v N,N′-Methylenebisacrylamide | Merck, USA | M1533 |
| 1-[4-(2-Hydroxyethoxyl)-phenyl]-2-hydroxy-methylpropanone, Omnirad 2959 (Previous name Irgacure 2959 ) | IGM Resins B.V., Netherlands | - |
| Dichlorodimethylsilane | Merck, USA | 40140 |
| Acetylcellulose film | Agar Scientific Ltd, England | G254B |
| Matrigel basement membrane 10 mL | Corning, USA | 354234 |
| Sulfosuccinimidyl-6-[4′-azido-2′-nitrophenylamino]hexanoate(Sulfo-SANPAH) | Thermo, USA | 22589 |
| HEPES (4-(2-hydroxyethyl)-1-piperazineethanesulfonic acid) | Dojindo, Japan | 346-01373 |
| RPMI 1640 | Nissui, Japan | 05911 |
| DMEM | Nissui, Japan | 05919 |
| Penicillin-streptomycin | Wako, Japan | 168-23191 |
| Non-essential amino acid | Wako, Japan | 139-15651 |
| Glutamax | Thermo, USA | 35050-061 |
| Sodium bicarbonate | Thermo, USA | 25080-094 |
| MSCGM | Lonza, Switzerland | PT-3001 |
| EGM | Lonza, Switzerland | CC-3124 |
| HCM | Lonza, Switzerland | CC-3198 |
| Software and algorithms | ||
| Igor 6.3 Pro | WaveMetrix, England | https://www.wavemetrics.com/order/order_igordownloads6.htm |
| SPM Control software | JPK (now, Bruker), USA | V.4 JPK Instruments AG |
| JPK data processing | JPK (now, Bruker), USA | https://japan.jpk.com/downloads |
| Nis-ElementsC | Nikon, Japan | https://www.microscope.healthcare.nikon.com/ja_JP/products/software/nis-elements |
| Other | ||
| Laser printer | OKI, Japan | MC860 |
| Atomic force microscopy (AFM) | JPK (now Bruker), USA | Nanowizard3 |
| Optional extend of piezo | JPK (now, Bruker), USA | CellHesion module |
| Microscopic body | Nikon, Japan | Nikon-Ti2E |
| Active vibration system | Hertz, Japan | TS-150 |
| sCMOS camera | Hamamatsu Photonics, Japan | C11578-36U, Oraca-spark |
| Cantilever | MikroMasch, Estonia | CSC-37/NoAl |
| Compact centrifuge system | AS-ONE, Japan | AC500 |
| UV lamp | Sigma, USA | Z169633-1EA |
| Cantilever | Olympus, Japan | OMCL-RC800-PSA |
| Stage top incubator | Tokai hit, Japan | INU8H-ZILCS-F1 |
| Confocal microscopy | Nikon/Leica, Japan/Germany | C2 or A1HDR25/SP8 |
| Vacuum pump | ULVAC, Japan | G-50DA |
| Sonicator | AS-ONE, Japan | ASU-3M |
| Glass slip | Matsunami, Japan | S05-SA-5864 |
| Glass slide | Matsunami, Japan | S2112 |
| Beaker | AS-ONE, Japan | 010020-100A |
| Beaker weight | AS-ONE, Japan | BH-100 |
Materials and equipment
Reaction solution for PAAm hydrogels
| Reagent | Final concentration | Amount |
|---|---|---|
| Ominirad 2959 solution (1.25% w/v) | 0.5% w/v | 0.8 mL |
| Acrylamide (40% v/v) | 12% v/v | 0.6 mL |
| N,N′-Methylenebisacrylamide (2% v/v) | 0.6% v/v | 0.6 mL |
| Total | N/A | 2 mL |
Use the reaction solution immediately after the preparation.
Step-by-step method details
Synthesis of hydrogel with mechanical patterns
Timing: Day 1
-
1.RCA cleaning12 of glass slips and slides using ultrasonication (1 h).Note: This section (day1) summarizes the protocols for synthesizing polyacrylamide (PAAm) hydrogels with mechanical patterns via photoinitiated radical polymerization (Day 1, Steps. 1–6) (Figure 1A). Reaction solutions are composed of the monomer (acrylamide), crosslinker (N, N′-methylene bis(acrylamide)), and photosensitive initiator (Omnirad 2959). Irradiation with UV light (λ = 365 nm) initiates the photo-crosslinking reaction; thus, a mechanical pattern can form according to the intensity of the light irradiation. However, there is a limited number of protocols demonstrating PAAm gels with mechanical "gradients" for guiding "isolated" cell locomotion.11Recently we successfully assessed various mechanical "patterns" for the "self-organization of cells".3 Therefore, we describe the preparation protocols for PAAm hydrogels with various mechanical patterns.
-
a.Place glass slides (≤ 6 slides) in a glass container, and place glass slips (φ = 12 mm) in a 50 mL beaker.Note: The beaker should be fixed with a metal weight to avoid spilling during ultrasonication. Harmful organic and inorganic gases are evaporated during RCA cleaning (classically RCA inc. developed); thus, all procedures should be performed in a draft chamber. Although the original RCA cleaning method used hydrofluoric acid,12 in this study, we eliminated hydrofluoric acid (i.e., SC-I cleaning), and ensured the protocol is user-friendly, even for young scientists and students. Especially, SC-I cleaning dedicates to eliminating organic contaminants from the glass surface and exposing slilanol group (-OH) for subsequent silanization reactions. All the solvents should be treated (discarded) according to institutional rules.
-
b.Add acetone and ensure that the glass slides and slips are immersed.
-
c.Perform ultrasonication at 25°C for 3 min.
-
d.After removing the acetone solution, repeat Step b-c, using ethanol, methanol, and distilled water, in that order.
-
e.Immerse glass slides and slips in a solution of 28% ammonia water, 30% hydrogen peroxide, and deionized water in a 1:1:5 ratio, and incubate in a hot water bath at 60°C for 30 min.
-
f.Rinse the glass slides and slips, ten times with deionized water, after the temperature drops to room temperature (20°C).
 Pause point: It is important that the glass surfaces (hydrophilicity) be freshly cleaned to enable the silane coupling between the exposed -OH groups of the glass substrate and the -Cl groups of allyl trichlorosilane (ATCS). Additional RCA cleaning is recommended if more than 1 week elapses after the initial RCA cleaning. The cleaned glass slips and slides should be stored in deionized water. [optional] The glass slips and slides can also be stored under a vacuum after drying in an oven (∼ 60°C for 3 h). If the added deionized water does not easily coat the glass surface, repeat the RCA cleaning. It should be noted that contact angle () measurement provides pre-cleaned ( ∼ 40°) and cleaned ( ∼ 20°) surface of the glass, which is possibly the criteria to repeat the cleaning.
-
a.
-
2.Allylation of glass slips (1 h) (Figure 1B).
-
a.Place the RCA-cleaned glass slips on a clean Teflon dish (ø = 7.5 cm).
-
b.Immerse the glass slips in 10 mL of ethanol, then rinse ultrasonically for 3 min at 25°C.
-
c.Gently remove the ethanol (possibly via a glass syringe or decantation).
-
d.Add 10 mL of chloroform to the dish, and immediately sonicate it (1 min at 25°C).Note: These steps are to eliminate the water from the surface of glass substrate. Thus, if the glass substrate was completely dried under a vacuum oven (see procedure 1, pause point), the dried glass was directly immersed in the reaction solution of procedure 2-d. The water remaining in the chloroform solution suppresses the allylation of the glass slips, leading to inhomogeneous wettability. During wet summers, the condensation of water due to the evaporation of chloroform (a decrease in the temperature of the glass leads to the condensation of water), suppresses the reaction. [Optional] Therefore, we recommend using a dehumidifying device with air conditionor (∼ 30%, ∼ 20°C). In the case of heterogenous silanization of glass were happened, it is generally advisable to first prepare a homogeneous reaction solution (chloroform, ATCS, and TEA), then immerse the glass slips into it. Dehydration process for the organic solvent just before the reaction (e.g., use of molecular sieves) may improve the reaction. Operation of the reaction under dried air (inert gas such as nitrogen) at the glove box also improves the reaction.
-
e.After gently removing the chloroform in a draft chamber, add 10 mL of fresh chloroform, 80 μL of triethylamine (TEA), and mix gently.
-
f.Add 80 μL of allyl trichlorosilane (ATCS) and mix gently.Note: The classical combination of NaOH and APTES (aminopropyl tri ethoxy silane)11 is not recommended for this protocol, because -OH groups are exposed by the evaporation of the NaOH solution; the evaporation leads to undissolved powder remaining on the glass surface, which may prevent the light passing through the substrate (during inverted microscopy). For reflection interference imaging, as in our previous study,1 it is critical to use a transparent glass substrate. Currently, the ATCS silane coupling is recommended. These ATCS protocols have been described by the Discher group.13
-
g.Perform ultrasonication for 3 min at 25°C.
-
h.Place a glass Petri dish on the Teflon dish to prevent evaporation of the solution and allow the solution to stand for 30 min.
-
i.If allylation does not occur when the glass slips overlap each other; use aluminum tweezers to separate the glass slips .
-
j.Discard the solution and rinse the coverslips at least three times with chloroform, ethanol, and deionized water.
-
k.Confirm the completion of allylation of the coverslip by checking the wettability after washing with distilled water.Note: Water drops on the surface should exhibit large contact angles owing to the strong hydrophobicity of the substrate surface (Figure 1B inset). It should be noted that contact angle () measurement provides the untreated ( ∼ 20°) and ATCS-treated ( ∼ 50°) surface of the glass.
-
a.
-
3.Hydrophobic treatment of glass slide by silane coupling (40 min) (Figure 1C).
-
a.Remove the moisture from the surface of the RCA-washed glass slides by drying them with nitrogen gas.
-
b.Transfer the two glass slides to a glass Petri dish.
-
c.Transfer dichloro dimethyl silane (DCDMS, 150 μL) onto one of the glass slides (in a draft chamber).
-
d.Place the cleaned side of the other glass slide onto the original slide, and allow the slides to stand for 10 min.
-
e.Add sufficient water to cover the glass slides (this is a process for stopping the reaction of DCDMS to glass); rinse the slides at least twice with distilled water.
-
f.If the two glass slides have firmly adhered to each other, separate them with aluminum tweezers.
-
a.
CRITICAL: Ensure that the glass slides are placed on surfaces that have not been exposed to nitrogen gas. The HCl gas that is produced during silane coupling is harmful; therefore, the reaction should be performed in a draft chamber. A hydrophobic slide should be used immediately after incubation.
-
4.Preparation of reaction solutions for PAAm hydrogel (15 min).
-
a.To prepare the photoinitiator solution in 50 mL plastic tubes, add 50 mg of Omnirad 2959 to 0.5 mL of ethanol, followed by 3.5 mL of distilled water.Note: The solution should be heated by shaking in a hot water bath (60°C) until the powder dissolves completely.
-
b.To prepare the complete reaction solution of PAAm hydrogel, mix together 0.6 mL of 40% acrylamide, 0.6 mL of 2% bis-acrylamide, and 0.8 mL of Omnirad 2959 solutions.
-
c.Cover the beaker containing complete reaction solutions of PAAm hydrogel with aluminum foil and immediately degass for 6 min in a vacuum chamber.Note: Degassing removes any dissolved oxygen that reacts with radicals and inhibits gel polymerization; this process is critical for the reproducibility of the gelation.
-
a.
-
5.Preparation of hydrogels by local stiffening (30 min–2 h) using a custom-built UV illumination system (Figure 1D) (Irradiation intensity: 20 mW, irradiation times: Table 1).
-
a.Transfer the prepared acrylamide gel solution (25 μL) dropwise onto a DCDMS-treated glass slide (hydrophobic),
-
b.Cover the slide with an allylated cover glass.
-
c.Pre-UV illumination promotes the curing of the entire substrate.
-
d.Primary UV illumination via a photomask or aperture induces a local curing area.Note:Table 1 indicates the representative recipes for mechanically patterned hydrogels with optimized illumination conditions. Here the intensity of UV was ∼ 20 mW ( = 365 nm, measured by 3664 optical power meter, Hioki inc, Japan). The photo-illumination pattern is prepared using a photomask printed on acetyl cellulose films (Figure 1top). The films are covered with monochromatic ink using a laser color printer. Adobe Illustrator software controls the depth of the monochromatic color; however, conventional software such as Microsoft PowerPoint may also be used.
-
e.Stain the prepared PAAm Immediately after the illumination.
-
f.Transfer the glass slide and slip with the PAAm gel to a plastic Petri dish (ø = 10 cm).
-
g.The Petri dish is then filled with distilled water to stop the reaction.
-
h.Use tweezers to carefully move the cover glass to the edge of the glass slide; remove the cover glass carefully.
-
i.Stains the hydrogels with trypan blue (Figure 1E bottom) to determine the local stiffening of the hydrogels.Note: Conventional trypan blue is a positively charged stain; thus, the small molecules can interact with the hydrogels.Pause point: The prepared PAAm gel can be stored in distilled water at 4°C for one month. For long-term storage, the addition of a penicillin–streptomycin solution (x 1000 dilution) is recommended.
-
a.
-
6.Extracellular matrix (ECM) modification of PAAm hydrogel substrate (> 16 h) (Figure 1F).
-
a.Adjust the pH of a solution of 2-[4-(2-hydroxyethyl)piperazin-1-yl]ethanesulfonic acid (HEPES) in deionized water (20 mM) to pH 8.5 with a potassium hydroxide solution (1 M).
-
b.Filter the solution with a 0.45 μm cellulose acetate membrane (Advantec). The solution (100–200 mL) can be stored at 4°C for three months.
-
c.Transfer the gel substrates to a glass plate (24 well, Iwaki) and rinse several times with HEPES buffer.
-
d.Add 1 μL of (Sulfosuccinimidyl 6-(4′-azido-2′-nitrophenylamino) hexanoate) (sulfo-SANPAH) in dimethyl sulfoxide (DMSO) solution to 250 μL HEPES solution(250-fold),
-
e.Load the mixture (0.2 mg/mL in final) onto the gel substrate.
-
f.Irradiate the gel substrate with UV light (365 nm, Spectro LINE ENF-280C combined with voltage transmitter TI-28) for 20 min using a UV lamp (Sigma, Z169633-1EA).Note: Install the UV light so that the distance between the bottom of the UV light and the surface of the gel is 35 mm. Remove the top cover of the glass well plates at a clean bench, because the plastic absorbs UV light.
-
g.After 20 min, rinse the PA gel substrate with HEPES buffer until the orange color of the Sulfo-SANPAH disappears (approximately three rinses).
-
h.Add 4.4 μL of Matrigel to 1 mL of the HEPES buffer solution (4.4 μL/mL), then cover the gel substrate with the solution.
-
i.Incubate the mixture at 37°C for at least 16 h in the absence of CO2. Place a 10 cm dish filled with distilled water in the incubator to prevent the drying out of the gel substrate and Matrigel mixture.CRITICAL: When preparing the Matrigel-diluted HEPES solution, cool the Matrigel and HEPES buffer before mixing. After adding Matrigel, use a vortex mixer (< 1 min) to mix the solution. The cooled solution may be used as is. Warming the Matrigel-diluted HEPES solution accelerates crosslinking to form aggregates but the aggregates dissolve slowly during the cooling process.
-
j.Wash the Matrigel-coated gel substrate with the culture medium and use immediately.Note: Immediate usage is recommended because the Matrigel coating dissolves easily at the 4°C storage temperature (i.e., the adhesion of cells will be suppressed). If a longer storage period (one week) is required, the gel and the reaction solution of Matrigel (after procedure 6-g) must be stored at 4°C.
-
a.
Figure 1.

PAAm hydrogel synthesis with mechanical pattern (Day 1)
(A–C) (A) Reaction scheme for photoinitiated photo-crosslinking of PAAm hydrogel. Surface silane coupling of (B) glass slip (allyl) and (C) slide glass (hydrophobic dimethyl) (Inset: surface hydrophobicity).16
(D) Custom-built UV illumination devices of photo-illumination pattern.
(E) Design of various patterns of photomask and the prepared hydrogels stained with trypan blue. The degree of photo-crosslinking correlates with the depth of the blue. Thus, the local stiffening of the desired pattern was successful.
(F) Surface coating of a thin layer of Matrigel via photo-crosslinking of Sulfo-SANPAH. Photoactivated nitrophenylazide group in sulfo-SANPAH attack toward polyacry-lamide independently of pH. After incubation with the Matrigel solution (4.4 μL/mL, 1 mL), primary amine in matrigel proteins slowly interact with the N-Hydroxysuccinimide (NHS) ester of Sulfo-SANPAH at 37°C in the absence of CO2.
Table 1.
Representative recipes for mechanically patterned hydrogels with optimized illumination conditions
| Pre-illumination [s] | Main illumination [s] | Center [kPa] | Surroundings [kPa] |
|---|---|---|---|
| 60a | 80 | 123 | 16.0 |
| 45b | 75 | 142 | 20.0 |
| 40 | 75 | 146 | 4.00 |
| 45c | 55 | 64.0 ± 6.8 | 2.03 ± 0.678 |
Pre-illumination below 30 s does not complete the gelation at the surroundings.
A sufficient degassing time (6 min) leads to a faster reaction; an insufficient degassing time (1 min)∗ leads to a slower reaction. Therefore, an optimal degassing time should be established.
To achieve a milder mechanical gradient, the appropriate pre- or main- illumination times should be selected.
There are two reaction steps to complete the surface modification of ECM: (1) the photoactivation of nitrophenyl azide and its covalent binding to PAAm, and (2) the reaction between NHS esters and the extracellular matrix (ECM). Regarding the photochemical reaction of nitrophenyl azide in sulfo-SANPAH, two types of reactions are known: (i) ring insertion of nitrene followed by the formation of didehydroazepine and subsequent reaction with nucleophilic amines, and (ii) insertion into C-H bonds via nitrene’s intersystem crossing.14 The carbonyl oxygen of the amide group reduces the reactivity of the amine in PAAm leading to support scenario (2).
For the reaction of NHS esters and ECM, the pH of the sulfo-SANPAH-HEPES solution is critical for the reaction between NHS esters of sulf-SANPAH and primary amines in ECM. Thus, the pH of the HEPES buffer should be optimized and incubation should proceed in the absence of CO2 (CO2 easily dissolves in the solution to decrease the pH). It should be noted that higher pH levels accelerate the hydrolysis of NHS esters of sulfo-SANPAH, thus reducing the reaction efficiency with ECM (which is a potential limitation of the reaction system.). The conditions under which sulfo-SANPAH is stored is also important. Sulfo-SANPAH is easily hydrolyzed at ambient temperatures. Thus, DMSO solvent is used for the dissolution and the stock should be stored at − 80°C. The diluted stock for the ECM modification should be freshly prepared prior to use. Based on the previous reports,11 HEPES was chosen as a buffer agent, but the buffering capacity is typically 6.8–8.2. Thus, the careful tuning of pH was necessary, we recommend using other Good’s buffers.
Mechanical characterization of the hydrogel using atomic force microscopy, AFM
-
7.AFM cantilever calibration.Note: This step provides a summary of the protocol for the mechanical characterization of hydrogels using AFM. AFM applies force (F) to materials via a cantilever with a measured indentation (δ); the analysis of the force-indentation curves (F-δ curves), based on the Hertzian and its modified contact theory,15,16 provides the mechanical properties (Young's modulus, kPa) of the cell culture substrate. In our work, we used an AFM from JPK instruments (now Bruker) for the measurement and followed the supplied instructions for calibration, measurement, and analysis. For further details, please consult the instrument manual or our next coming paper summarizing the details of the AFM analysis.
-
a.Turn on the AFM systems (controller, PC, JPK software) and optical devices (Nikon-Ti2E with CMOS camera).
-
b.Adjust the cantilever position on a holder, then attach it to the AFM devices.
-
c.Place a glass-bottom dish (ø = 27 mm, Iwaki, No1S, Cat:3970-035) containing 2 mL of deionized water on the manual stage.
-
d.According to the manufactured instruction, warm-up operation of equipment (switching of laser, controller, AFM) for at least 30 min until they get stabilized.
-
e.Focus a laser beam onto the cantilever using a calibration camera.
-
f.Adjust the laser position to ensure that the vertical and lateral deflection becomes zero.
-
g.Position the cantilever near the surface of the glass substrate using the instrument software.Note: The following conditions should be used: Approaching speed for obtaining back or forward force curves = 0.5 s, P gain = 0.001, iGain = 50.0 Hz, SetPoint = 1 V
-
h.Calibrate the sensitivity using the calibration manager in the software.
-
i.Move the cantilever to a position 100 μm above the glass surface by tuning the stepping motors of the AFM device.
-
j.Calibrate the spring constant using the calibration manager in the software.
-
a.
-
8.AFM measurement and analysis.
-
a.Acquire the force curves of the PAAm gel in a phosphate buffer saline (PBS) solution.Note: Use the following conditions: Approaching speed = 5.0 μm/s, P gain = 0.001, iGain = 50.0 Hz, Setpoint ∼ 27 nN (∼ 1 V).
-
b.Check the quality of the force curves (plateau baseline and single-force curves without cracks). If the quality is poor, please reoptimize the parameters in Step 8 a.Note: Force maps with a defined area (xy, 100 × 100 μm) are restricted by the potential piezo movement inside the AFM device.
-
c.Obtain mechanical profiles.Note: Mechanical mapping can be acquired (between 0.5 mm pitch) for this experiment by moving the stage of the AFM using a vernier micrometer.
-
d.Use conventional analysis software (i.e., JPK data processing).Note: Theoretical background (Figure 2A). The force curve is obtained by bringing the needle of the cantilever into contact with the sample; initially the needle does not touch the sample; it is then inserted into the sample. Here, the vertical axis of the force curve represents the force [nN], and the horizontal axis represents the indentation [μm]. Several models are available for calculating the Young's modulus (E [kPa]) of a sample; in this study, we used the modified Hertz equation without relying on Sneddon’s model.17 The model is used to ascertain the relationship between the force applied to the sample and its displacement. As shown in Figure 2A, the probe tip is approximated as a cone, and it is assumed that the needle tip and sample are in surface contact. The following equation expresses the relationship between the force applied on a sample and its displacement: where F [N] is the force applied to the sample, α [°] is the half angle of the probe at the tip of the cantilever, ν is Poisson's ratio, E [Pa] is the Young's modulus of the sample, and δ is the indentation amount. Here, α is a constant term because it is probe-specific, and v is sample-specific. In other words, when the obtained force curve is fitted with the model, it becomes a quadratic function in the indentation range > 0; the Young's modulus (E) of the sample is the value that makes this quadratic function valid.15,16
-
e.If some representative force curves fit well with the Hertzian contact theory, proceed to the batch fitting procedures to obtain mechanical maps.Note: Representative force curves are shown in Figure 2B for different crosslinker concentrations (i.e., Young’s modulus, S1 (E ∼ 1.5 kPa), S2 (E ∼ 1.7 kPa), and S3 (E ∼ 105 kPa)). The force curves should first be analyzed to determine the fitting region. Figure 2C shows the Young’s modulus of PAAm hydrogels (without matrigel coating), which was calculated using different fitting regions (with different indentation depths). For a small indentation depth, the Young’s modulus sometimes increases owing to the adhesiveness of the hydrogels that breaks the model (point of contact); this occurs due to the strong adhesion of the hydrogel to the cantilevers tip (i.e., increase in the area of the adhesion region). Since the cantilever gradually distorts in the tip's height direction, it is typically challenging to apply the same models for deeper indentation depth. However, fitting at the region above 1 μm reaches equilibrium and smaller deviation between different batches (data not shown), thus the indentation depth (∼ 1 μm) would be valid for the analysis(which is also a comparable range of a previous report18) .
-
a.
Figure 2.

Evaluation of Young’s modulus of PAAm gel using AFM (Day 2)
(A) Illustration of cantilever tips (left) and representative force-indentation curves (i.e., F-δ curves, force curve) (right) with corresponding cantilever illustration with different δ. Here, the α [°] is the half angle of the probe at the tip of the cantilever. Further details of principles of obtaining force curves are described in main text.
(B) Representative force curves with different crosslinker concentrations, S1 (E ∼ 1.5 kPa), S2 (E ∼ 17 kPa), and S3 (E ∼ 54 kPa).17
(C) Representative analyzed Young’s modulus dependency on the fitting region (i.e., indentation depth).17
(D) Mechanical profiling of locally stiffened hydrogel with different experimental batches. Mapping with 0.5 mm pitches obtains the data point. The error bar shows the standard deviation of Young’s modulus (n = 16) of hydrogels (analysis area: 10 μm × 10 μm area).
AFM topological analysis revealed that there are thin layers of matrigels (order of several tens of nanometers, data not shown) on the hydrogels. Our previous reports indicated that matrigel coating does not influence the stiffness of PAAm hydrogels.2 Cells are capable of sensing the stiffness of objects that are more than 1 μm below the substrate surface.13 Combining these facts indicate that cells can sense and respond to the mechanical properties of the gels evaluated here. If the synthesis protocols are optimized in the laboratory, the deviation in stiffness should be as that displayed in Figure 2D. If the cell experiment is sensitive to the variations in stiffness, prepare the PAAm gel on the same day and store one PAAm hydrogel for the AFM measurements.
Time-lapse imaging of self-condensation of cells
-
9.Expansion of target cells (rat-skeletal muscle cells, L6 for this protocol) before time-lapse imaging (>1 week).Note: This step provides guidelines for the time-lapse imaging of the self-condensation of cells on the hydrogel with a mechanical pattern using fluorescence confocal microscopy. We optimized the use of a Nikon confocal microscope (Nikon C2 or A1) for multiple-point imaging and stacking; however, a Leica (SP5, SP8) may also be used.CRITICAL: It is necessary to optimize the mechanical gradient and Matrigel coating on the surface, depending on the types of targeted cells. To test the self-condensation of cells on the PAAm hydrogels, we first recommend using mesenchymal cell types, such as mesenchymal stem cells (MSC) and C2C12. We have previously shown that MSC are key in the self-condensation of liver organoids.2 Therefore, if mixing the mesenchymal cells to enhance condensation is acceptable, the density of mesenchymal stem cells to be mixed is ∼ 10% (recommendation).
-
a.Prepare the medium from Nissui RPMI approximately 30 min before seeding/dispensing and warm in a 37°C incubator.
-
b.Aspirate the medium with an aspirator and wash the cells once with PBS (4°C).
-
c.Add 2 mL of trypsin (4°C) and incubate at 37°C with CO2 for 3 min.
-
d.Dspese the clumps formed by the cells by tapping the wall of the dish, and ensure cell detachment by minimal pipetting (The trypsin action time is short).
-
e.After confirming the cell detachment under a microscope, add a minimum of 4 mL of medium to stop the action of trypsin.
-
f.Transfer the solution to a 15 mL tube and centrifuge at 4°C, 200 G for 3 min.
-
g.Remove the supernatant, add 1 mL of the culture medium to count the number of cells.
-
h.Wash the incubating gel substrate once with the warmed medium and seed the cells at a density of 2 × 10⁶ cells/well.
-
a.
-
10.Time-lapse fluorescence confocal imaging of multiple points of cells on the PAAm gel (Figures 3A–3C).
-
a.Replace the PAAm gel slides with another 24-well plate (if necessary; dark-colored wells are recommended). (a glass well plate is recommended e.g., Iwaki glass well plate).
-
b.Add warm culture medium (which matches targetted cells).
-
c.Place the glass well plate in a chamber attached to a 5% CO2 regulator (Tokai Hit). Set the air pressure to 50 mL/min (flow ratio).
-
d.Imaging by confocal and epifluorescence microscopy.Note: We recommend the use of confocal microscopy to obtain the axial structures of the obtained cell condensates; however, other stereomicroscopes (e.g., LED5000 SLI, Leica) may also be used. Note that a stereotypical microscope usually cannot provide fine axial information. Therefore, tiling of the wells and/or a lower magnification lens such as 1× (Plan) and another lens (4× plan apo numerical aperture, NA = 0.20), are recommended. In this protocol, we typically use a 4× plan apo lens.
-
e.Set up a glass well plate, seeded with cells, for transmission images and fluorescence microscopy with a 561 nm laser (acquired at 30 min intervals for 24 h).
-
f.After obtaining the microscopic images, we recommend obtaining the axial topography of the condensates.
-
g.Thereafter, fix the cells with 4% paraformaldehyde in PBS for 5 min for further immunostaining.CRITICAL: Note that the condensate spheroids are hydrophobic; thus, prolonged drying in air leads to their detachment from the gels.
-
a.
Figure 3.

Time-lapse imaging of self-condensation of mesenchymal cells (Day 3)
(A) Time-lapse of self-condensation of rat-skeletal myoblast (L6) expressing RFP-F-actin on PAAm hydrogels with the mechanical pattern. Stiffened regions in the center (Estiff ∼ 140 kPa), and the surrounding soft regions (Esoft ∼ 20 kPa).
(B and C) (B) Magnified images of condensates on the stiff and soft area on Day 1 and (C) Schematic illustration of self-condensation. The strong adhesion of cells on the stiff region directs the self-condensation of cells.3
(D) Time-lapse imaging of self-condensation of L6 on PAAm hydrogels with various locally stiffened patterns with star morphology.
(E) Magnified confocal images of condensates on the locally stiffened PAAm hydrogels with star pattern (Day 4).
Expected outcomes
The obtained results are shown in Figures 1, 2, and 3. Staining with trypan blue highlights the crosslinking of the PAAm hydrogel with the glass substrate (Day 1, Figure 1E). The darker blue color is associated with the successful local stiffening in the substrate (if the prepared PAAm gels on the glass slip are not homogeneous, please consult problem 1).
After successfully preparing homogeneous PAAm gels, AFM can be used to visualize the mechanical gradient, prepared on the PAAm hydrogels, using a photomask in Figure 1D (Day 2, Figure 2D) (If the mechanical pattern between different batches (same optical conditions) deviates substantially, please consult problem 2).
The spread of mesenchymal cell types on the prepared PAAm hydrogels results in self-condensation (Day 3 Figure 3) (if condensation does not occur, please consult problem 3). Local stiffening in the center of the PAAm gels induces self-condensation (Figure 3A). The condensates along the optical axis exhibit a concave morphology (Figure 3B). As discussed in previous papers,3 the strong mechanical interaction between cells comprising stiffened regions, induces cellular condensation on locally stiffened areas (Figure 3C). Under optimized conditions, locally stiffened PAAm hydrogels with different spatial morphologies can be prepared. For instance, local stiffening with star shapes induces star-like condensation on the substrate (Figures 3D and 3E).
Limitations
We developed preparation protocols for PAAm hydrogels, with mechanical patterns, to control the self-condensation of cells; the protocols were based on the well-established preparation protocols for homogeneous PAAm hydrogels.11 We presented three steps, namely, hydrogel synthesis (Figure 1), mechanical evaluation of the substrate (Figure 2), and visualization of the self-organized cells (Figure 3).
Our protocols have been simplified and should be accessible to novices in the biological field who are attempting chemical synthesis. However, there is a limitation of this study: repeated synthetic experiments may be necessary to obtain stable PAAm hydrogels in different batches in the laboratory. Moreover, beginners using AFM measurement should consult the manufacturer’s instructions (takes time to become proficient.), and the next coming paper that summarizes the detailed operation of the AFM instrument.
The combination of mesenchymal and targeted cells accelerates self-condensation. If it is not possible to combine mesenchymal cells, it is necessary to optimize the Matrigel concentration and the mechanical gradient for the targeted cells.
Troubleshooting
Problem 1
The hydrogel film failed to form on the glass substrate.
Potential solution
Irradiate the PAAm reaction solution without a photomask. If gelation does not begin within 2 min, increase the time to vacuum the reaction solution. If gelation still does not occur, please check whether the reaction solution is fresh (Step 1-procedure No. 4, Day 1) . Omnirad 2959 is sensitive to moisture and temperature; thus, it should be stored at 4°C in the refrigerator. In addition, the hydrophobicity of the glass (Figure 1B), illumination homogeneity (Figure 1D), and mask homogeneity (Figure 1E top) should be checked.
Problem 2
The mechanical patterns deviate markedly between different batches.
Potential solution
Optimize the hydrophobicity of the glass slide (Step 1-procedure No. 3, Day 1) or vacuum conditions (Step 1-procedure No. 4, Day 1). A longer vacuuming period reaches different concentrations of oxygen; thus, a deviation in the mechanical pattern could occur. After completing the radical reaction in distilled water, use tweezers to move the edge of the cover glass to the edge of the glass slide, and carefully remove the cover glass. Applying excessive force to the glass slip will damage the gel surface.
Problem 3
Condensation of cells on the mechanically-patterned hydrogels fails.
Potential solution
It would be best to optimize the mechanical gradient (redo the optimization that was performed on Day 1), check the culture conditions, such as Matrigel coating (Step 1-procedure No. 6, Day 1, Figure 1D), and the CO2 concentration and temperature, of the incubation chamber. A conventional CO2 incubator is recommended for initial use, followed by microscopic imaging. In our experience, the low temperature (< 20°C) required to cool the laser systems critically influences condensation. In addition, covering the microscope with sheets made of non-flammable materials is recommended to block airflow from the air conditioner.
Resource availability
Lead contact
Requests for further information regarding resources, measurement procedures, and data can be directed to Dr. Takahisa Matsuzaki (matsuzaki@ap.eng.osaka-u.ac.jp).
Materials availability
This study did not generate new unique reagents.
Acknowledgments
This work was partly supported by grants from the Japan Society for the Promotion of Science (JSPS) KAKENHI (JP21KK0195 to T.M.; JP22H00302, JP22H05423, and JP20K21117 to H.Y.Y.; JP21H03790 to T.M. and H.Y.Y.; JP18H02800 and JP19K22416 to T.T.), AMED (20bm0704025h0003 to T.T. and H.Y.Y.; 19fk0210037, 19bm0704025, 19fk0210060, and 19bm0404045 to T.T.), JST FOREST Program (JPMJFR205N, Japan to T.M.; JPMJFR205K to Y.F.), Naito Foundation (H.Y.Y.), Takeda Science Foundation (H.Y.Y.), Uehara Foundation (H.Y.Y. and T.M.), and Nakatani Foundation for Advancement of Measuring Technologies in Biomedical Engineering (T.M.). In addition, T.T. is a New York Stem Cell Foundation-Robertson Investigator and also a recipient of the Cincinnati Children’s Research Foundation grant, NIH grant UG3 DK119982, Dr. Ralph and Marian Falk Medical Research Trust Awards Program, Takeda Science Foundation award, Mitsubishi Foundation award. T.M. would like to thank the Department of Research Promotion, Osaka University, and Life-omics Research Division, Institute for Open and Transdisciplinary Research Initiative, Osaka University, for their support.
Author contributions
T.M. conceived the study, designed, and performed the experiments, collected and analyzed the data, and wrote the manuscript. Y.K., M.H., Y.S., H.K., M.K., Y.K., and N.O. performed the experiments, with the technical guidance and expertise of T.M., T.T., and H.Y.Y.; R.K., Y.Y., Y.F., F.H., S.-I.T., S.N., S.O., H.N., and H.T. reviewed the manuscript. T.T. and H.Y.Y. conceived the study, designed the experiments, obtained funding, and wrote and reviewed the manuscript.
Declaration of interests
The authors declare no competing interests.
Contributor Information
Takahisa Matsuzaki, Email: matsuzaki@ap.eng.osaka-u.ac.jps.
Takanori Takebe, Email: takanori.takebe@cchmc.org.
Hiroshi Y. Yoshikawa, Email: hiroshi@ap.eng.osaka-u.ac.jp.
Data and code availability
The lead contact, upon reasonable request, will share data reported in this paper. No original code was generated in this study. Any additional information required to reanalyze the data reported in this paper is available from the lead contact upon reasonable request.
References
- 1.Matsuzaki T., Sazaki G., Suganuma M., Watanabe T., Yamazaki T., Tanaka M., Nakabayashi S., Yoshikawa H.Y. High contrast visualization of cell–hydrogel contact by advanced interferometric optical microscopy. J. Phys. Chem. Lett. 2014;5:253–257. doi: 10.1021/jz402463u. [DOI] [PubMed] [Google Scholar]
- 2.Takebe T., Enomura M., Yoshizawa E., Kimura M., Koike H., Ueno Y., Matsuzaki T., Yamazaki T., Toyohara T., Osafune K., et al. Vascularized and complex organ buds from diverse tissues via mesenchymal cell-driven condensation. Cell Stem Cell. 2015;16:556–565. doi: 10.1016/j.stem.2015.03.004. [DOI] [PubMed] [Google Scholar]
- 3.Matsuzaki T., Shimokawa Y., Koike H., Kimura M., Kawano Y., Okuma N., Kawamura R., Yoneyama Y., Furuichi Y., Hakuno F., et al. Mechanical guidance of self-condensation patterns of differentiating progeny. iScience. 2022;25 doi: 10.1016/j.isci.2022.105109. [DOI] [PMC free article] [PubMed] [Google Scholar]
- 4.Engler A.J., Sen S., Sweeney H.L., Discher D.E. Matrix elasticity directs stem cell lineage specification. Cell. 2006;126:677–689. doi: 10.1016/j.cell.2006.06.044. [DOI] [PubMed] [Google Scholar]
- 5.Vogel V., Sheetz M. Local force and geometry sensing regulate cell functions. Nat. Rev. Mol. Cell Biol. 2006;7:265–275. doi: 10.1038/nrm1890. [DOI] [PubMed] [Google Scholar]
- 6.Romani P., Valcarcel-Jimenez L., Frezza C., Dupont S. Crosstalk between mechanotransduction and metabolism. Nat. Rev. Mol. Cell Biol. 2021;22:22–38. doi: 10.1038/s41580-020-00306-w. [DOI] [PubMed] [Google Scholar]
- 7.Butcher D.T., Alliston T., Weaver V.M. A tense situation: forcing tumour progression. Nat. Rev. Cancer. 2009;9:108–122. doi: 10.1038/nrc2544. [DOI] [PMC free article] [PubMed] [Google Scholar]
- 8.Panciera T., Azzolin L., Cordenonsi M., Piccolo S. Mechanobiology of YAP and TAZ in physiology and disease. Nat. Rev. Mol. Cell Biol. 2017;18:758–770. doi: 10.1038/nrm.2017.87. [DOI] [PMC free article] [PubMed] [Google Scholar]
- 9.Pérez-González C., Ceada G., Greco F., Matejčić M., Gómez-González M., Castro N., Menendez A., Kale S., Krndija D., Clark A.G., et al. Mechanical compartmentalization of the intestinal organoid enables crypt folding and collective cell migration. Nat. Cell Biol. 2021;23:745–757. doi: 10.1038/s41556-021-00699-6. [DOI] [PMC free article] [PubMed] [Google Scholar]
- 10.Yin X., Mead B.E., Safaee H., Langer R., Karp J.M., Levy O. Engineering stem cell organoids. Cell Stem Cell. 2016;18:25–38. doi: 10.1016/j.stem.2015.12.005. [DOI] [PMC free article] [PubMed] [Google Scholar]
- 11.Tse J.R., Engler A.J. Preparation of hydrogel substrates with tunable mechanical properties. Curr. Protoc. Cell Biol. 2010;47 doi: 10.1002/0471143030.cb1016s47. Unit 10.16. [DOI] [PubMed] [Google Scholar]
- 12.Kern W. Noyes Publication; New Jersey: 1993. Handbook of Semiconductor Wafer Cleaning Technology; pp. 111–196. [Google Scholar]
- 13.Buxboim A., Rajagopal K., Andre’EX B., Discher D.E. How deeply cells feel: methods for thin gels. J. Phys. Condens. Matter. 2010;22 doi: 10.1088/0953-8984/22/19/194116. [DOI] [PMC free article] [PubMed] [Google Scholar]
- 14.Kumar S., Kumar D., Ahirwar R., Nahar P. Exploring the flexible chemistry of 4-fluoro-3-nitrophenyl azide for biomolecule immobilization and bioconjugation. Anal. Bioanal. Chem. 2016;408:6945–6956. doi: 10.1007/s00216-016-9803-6. [DOI] [PubMed] [Google Scholar]
- 15.Hertz H. On contact between elastic bodies. J. Reine Angew. Math. 1882;1882:156–171. [Google Scholar]
- 16.Sneddon I.N. The relation between load and penetration in the axisymmetric Boussinesq problem for a punch of arbitrary profile. Int. J. Eng. Sci. 1965;3:47–57. [Google Scholar]
- 17.Wu H.W., Kuhn T., Moy V.T. Mechanical properties of L929 cells measured by atomic force microscopy: effects of anticytoskeletal drugs and membrane crosslinking. Scanning. 1998;20:389–397. doi: 10.1002/sca.1998.4950200504. [DOI] [PubMed] [Google Scholar]
- 18.Yoshikawa H.Y., Cui J., Kratz K., Matsuzaki T., Nakabayashi S., Marx A., Engel U., Lendlein A., Tanaka M. Quantitative evaluation of adhesion of osteosarcoma cells to hydrophobic polymer substrate with tunable elasticity. J. Phys. Chem. B. 2012;116:8024–8030. doi: 10.1021/jp212385p. [DOI] [PubMed] [Google Scholar]
Associated Data
This section collects any data citations, data availability statements, or supplementary materials included in this article.
Data Availability Statement
The lead contact, upon reasonable request, will share data reported in this paper. No original code was generated in this study. Any additional information required to reanalyze the data reported in this paper is available from the lead contact upon reasonable request.