Abstract
Objective
This study aims to show the usefulness of incorporating a community-based geographical information system (GIS) in recruiting research participants for the Asian Cohort for Alzheimer’s Disease (ACAD) study for using the subgroup of Korean American (KA) older adults. The ACAD study is the first large study in the USA and Canada focusing on the recruitment of Chinese, Korean and Vietnamese older adults to address the issues of under-representation of Asian Americans in clinical research.
Methods
To promote clinical research participation of racial/ethnic minority older adults with and without dementia, we used GIS by collaborating with community members to delineate boundaries for geographical clusters and enclaves of church and senior networks, and KA serving ethnic clinics. In addition, we used socioeconomic data identified as recruitment factors unique to KA older adults which was analysed for developing recruitment strategies.
Results
GIS maps show a visualisation of the heterogeneity of the sociodemographic characteristics and the resources of faith-based organisations and KA serving local clinics. We addressed these factors that disproportionately affect participation in clinical research and successfully recruited the intended participants (N=60) in the proposed period.
Discussion
Using GIS maps to locate KA provided innovative inroads to successful research outreach efforts for a pilot study that may be expanded to other underserved populations across the USA in the future. We will use this tool subsequently on a large-scale clinical genetic epidemiology study.
Policy implication
This approach responds to the call from the National Institute on Aging to develop strategies to improve the health status of older adults in diverse populations. Our study will offer a practical guidance to health researchers and policymakers in identifying understudied and hard-to-reach specific Asian American populations for clinical studies or initiatives. This would further contribute in reducing the health and research disparity gaps among older minority populations.
Keywords: Aged, Dementia, Health Equity, EPIDEMIOLOGIC STUDIES, Patient Participation
STRENGTHS AND LIMITATIONS OF THIS STUDY
This study responds to the call from the National Institute on Aging to build diverse community partnerships to improve the recruitment of minorities (Milestone 12.a). Community and academic partners were engaged to develop a community-based geographic information system (GIS) to identify and recruit hard-to-reach populations.
This study created novel community-based GIS maps which provide a comprehensive overview with a visual representation of the heterogeneities of social factors and physical clusters for the targeted population.
Our successful recruitment of Korean American (KA) older adults is due to multiple recruitment strategies including target population tailored GIS, detailed understanding of the target population as well as existing community capacity and respected relationships between the community and researchers.
Using publicly available social network data has inherent limitations related to completeness, correctness and timeliness reporting and there are limitations to using social networks observed in social datasets which may be different from the underlying (offline) networks.
Recruitment to clinical studies with Asian American older adults is complex, only Korean-speaking KA older adults are included.
Introduction
Alzheimer’s disease and related dementia (ADRD) affects 5.8 million people in the USA and 50 million worldwide.1 2 The annual global cost of dementia is now above US$1.3 trillion and is expected to rise to US$2.8 trillion by 2030.3 4 The literature on ADRD shows constant and adverse health disparities as well as research disparities across racial and ethnic groups.5 6 Though many AD variants are population-specific or have different frequencies across populations, like most complex diseases, the AD literature has a strong bias towards European ancestry,6 7 and there are substantial disparities in minority participation in AD studies. Despite the call from the National Institute of Health for the inclusion of more representative groups in clinical studies, racial/ethnic minorities, older adults, those with lower socioeconomic status and immigrant subpopulations remain underserved, understudied and under-represented.6 8–10
Older racial/ethnic minority populations are growing faster than their non-Hispanic white counterparts and will comprise 45% of the older adult population by 2060.11 The number of Asian Americans who are 65 years and older will increase by 352% by 2060 and comprise 21% of the total Asian American population by 2060.11 12 Participation of Asian Americans in the ADRD interventional trials is very low (ie, <1%)6 13 14 and investigations of ADRD in Asian American populations are woefully inadequate, so the generalisability of scientific findings for Asian Americans is questionable. The availability of reliable data is imperative to the attainment of the regional profiles of health equity in the USA.15 However, in Healthy People 2020, as in most other national health reports, ADRD data about Asian Americans is absent. The main reasons for the omission of Asian Americans in healthcare studies are the barriers present in Asian American communities that include mistrust of outsiders, lack of knowledge, language barriers, lack of health insurance and sociocultural barriers.9–12 16–19 It is difficult to gain access to Asian Americans because they are dispersed throughout the country and tend to have a low level of contact with the healthcare system. However, there are states where Asian Americans are concentrated such as California, New York and Texas, and ethnic enclaves in various metropolitan areas such as Chinatown, Koreatown and Little Saigon as well as based on social factors including churches.16–19
There is a need to develop sampling methods that are responsive to ethnicity and sociocultural diversity among study populations and to be able to generalise scientific findings for Asian Americans.9 10 18 As for older Asian American populations, they show specific characteristics that make them different from other ethnic groups and their younger counterparts, including language, health beliefs, health attitudes, lower economic status and social networks.17 19–22 These characteristics may act as facilitators or barriers to participation in clinical studies or clinical trials for communities, including ADRD.
The strategies to identify geographical and socioenvironmental trends among Asian Americans, particularly in the older population, may enhance the recruitment of the study participants. Geographical information system (GIS) would be an excellent tool for comparing spatial data on the relative concentrations of minority populations and identifying high-concentration areas or enclaves for the small-sized study population. GIS can quickly and accurately create visual representations of multiple complex data sets. This makes it a more effective tool for developing recruitment strategies than other methods, such as text, charts or tables. GIS could enhance the visual perception of physical and social environments by mapping layers of data information and its relationship to the location of the study population. The use of GIS techniques in public health studies has developed significantly in recent years.23–27 Many public health researchers have found that visualisation of the spatial distribution of health-related events of target populations and making informed public health decisions faster are the two primary applications of GIS data/methods in health-related studies.25 28 29 The applications of GIS methodologies in older adults’ care and research are growing,30–32 however, there is limited research on GIS in assessing recruitment strategies among older adults with and without dementia.33 34
The purpose of this paper is to show the usefulness of incorporating community-based GIS in recruiting research participants for the Asian Cohort for Alzheimer’s Disease (ACAD) study using the subgroup of Korean American (KA) older adults. Community-based GIS recruitment strategies can help researchers and community recruiters work together to develop recruitment strategies by creating and mapping the data and monitoring the recruitment process and outcomes. The ACAD study is the first large study in the USA and Canada focusing on the recruitment of Chinese, Korean and Vietnamese older adults to address the issue of under-representation of Asian Americans in research. The study’s long-term goal is to recruit over 5000 participants to identify genetic and non-generic/lifestyle AD risk factors and to establish blood biomarker levels for AD diagnosis.
This paper summarises only the strategies used to recruit KA older adults aged 60 years and older in New Jersey in the USA and discusses how the community-based participatory research method combined with GIS resulted in the successful recruitment of our target research participant. Our main objective is to show the effectiveness of using community-based GIS to recruit a hard-to-reach KA elderly population with and without dementia in New Jersey by (1) creating a few GIS maps to capture the physical and sociocultural characteristics of the sample population and (2) referencing the maps to effectively recruit the sample population.
Methods
We used holistic community-based participatory research combined with applying GIS to delineate boundaries for geographical clusters and church and senior networks, and KA serving ethnic clinics within identified clusters or enclaves to recruit participants from the community.35 We integrated local knowledge and resources of the social environment into GIS by collaborating with community leaders for developing recruitment strategies. Recruitment was derived from linking data from identified diverse sources of geographical and social enclaves of KA populations and visualised geographical and sociocultural trends in the study populations. A chain referral recruitment method within identified enclaves, such as other forms of respondent-driven sampling, was used.
Geographical context of KAs
Although there are concentrations of KAs in California and on the East Coast, KAs are widely scattered throughout the USA.16 35–37 According to data from the 2010 Census, New Jersey’s Asian population grew by more than 1400% since 1970. The counties with the largest Asian American populations are Middlesex (24% of the county’s residents), Bergen (16%) and Hudson (15%) in New Jersey. We choose New Jersey to carry out this pilot ACAD since the highest density of KAs (6.3%) resides in Bergen County, New Jersey.37 38
Sociocultural contexts of KAs
The history and sociodemographic characteristics of Korean immigration frame the sociocultural context of KAs, the majority of whom were not born in the USA.35–37 According to the 2010 census, roughly 10% of Asian American Pacific Islanders are KAs. There are two major paths for Korean immigration to the USA: to reunite with other family members already here or to offer professional and technical skills in demand in the USA.35 36 The majority of KA immigrants rated their English level as ‘minimum’ and do not speak English at home regardless of their length of residence in this country.21 22 35–39 KA older adults reported relatively high levels of education, but not comparable levels of professional jobs. Studies of KAs have revealed that 30%–40% are self-employed,30 38–41 which explains their relatively low rate of health insurance which is between 42% and 51%.35 42–44
We incorporated a grey literature search to include a diverse and heterogeneous body of material available outside of the traditional academic peer-review process.45–47 Data estimation of the study populations is mainly based on two sources: local KA community social data and statistical data produced by the US Census Bureau. Census data for the state of New Jersey were extracted at the county level using the American Community Survey (ACS). The ACS is a publicly available survey administered by the US Census Bureau annually. Our main sociodemographic data come from analysing the 2015–2019 ACS 5-year estimates48 from the Integrated Public Use Microdata Series.49 However, we also used aggregated data for the 2011, 2015 and 2019 ACS when presenting the general population distribution retrieved from the data.census.gov website.50
Data sources for GIS
While the census data contain various geographical and sociodemographic information about different racial/ethnic groups, the nature of the data set does not include community-specific information at a local level. Therefore, we used a community participatory mapping approach to harness existing community resources to develop target group-tailored GIS. This participatory GIS relies on the integration of local perspectives and knowledge about the community capacity of conducting this proposed study.51–53 We obtained expert consultation from community leaders, cultural navigators and key informants with knowledge about ADRD, patterns of residence, healthcare use and social activities of KA older adults. When searching for the geographical locations of Korean community facilities online, we used search keywords in both English and Korean such as KAs (재미한국인) or Korean church (한인교회). We tried to use compound nouns such as KA instead of Korean so that the search results did not include places in South Korea. We also traced the community list in a hard copy by working with community leaders.
Through the collaboration, we developed a list of local data sets comprised of ethnic churches (from the Korean Catholic Peace Times Weekly54 and Christian Daily,55 and ethnic clinics (from the Korean Daily Service).56 Regarding health services related to ADRD management, we searched websites for AD Research Centers in the New York and New Jersey regions and found that there were no institutions providing Korean-specific services. However, we have found a large number of Korean-serving medical clinics in New Jersey through our own community-based searches.56 We then mapped the locations of these ethnic community resources to create our own community maps and incorporated them into community outreach activities.
Prerecruitment analysis
In analysing the county-level data from the ACS, we compared different socioeconomic characteristics among selective race/ethnic groups (White, Asians, Koreans and Chinese) as well as between two age groups (ages 25 and up and 65 and up) within the KA population. In addition to illustrating demographic trends in the study area, we examined the levels of poverty, educational attainment and limited English proficiency given their crucial impact on one’s health condition, healthcare access and research participation. While the census data have large sample sizes to perform multiple between-group and within-group comparisons, data from some counties were automatically excluded from analyses (counties with no colour in figures). For our geospatial analyses, we used multiple GIS data sets including the distribution patterns of KA older adult populations, Korean preferred senior apartments and locations of churches and clinics to integrate spatial and non-spatial (tabular) data sources of US census demographic data.
Recruitment plan
Recruitment of Asian American research participants presents challenges, and one needs to develop innovative target-population tailored strategies instead of using methods developed by and for the mainstream population.50 57–59 Thus, we developed a decolonising recruitment approach to recruit participants from the community as a part of the ACAD cohort study to evaluate a novel community-based participatory research sampling method using GIS maps to visualise unique patterns and trends of distribution of the study population who are disproportionally understudied and underserved. The decolonising recruitment method is an approach challenging the Eurocentric research methods pertaining to the norms of methodological conceptualisation of conformity that undermine the local knowledge and experiences and disproportional sociocultural characteristics of the marginalised study population groups.5 51 59–61
This project represents an academic–practice–community collaboration. Before beginning recruitment, we advertised in ethnic media and social networks to increase awareness and encourage participation in the study. We used ‘Tell-A-Friend about Data is Power’ as an ad campaign to communicate the importance of having data from Koreans for Koreans. This recruitment strategy, using language and race matched recruiters and researchers,35 62–64 would promote access to hard-to-reach KAs, and help participants to feel ‘listened to’ and show the ‘value of their contribution to the study’. As most KAs are connected and have ties to Korean churches or senior associations, we used a chain referral sampling method, such as other forms of respondent-driven sampling.35 65–68 We asked the study participants to introduce us to other KA older adults and started with a small number of senior community leaders and cultural navigators who then recruited directly from their peers who go to the same churches or live in the same senior apartments. This approach leverages our well-established collaborations and coordination with a range of multilevel services and existing community capacity.
Results
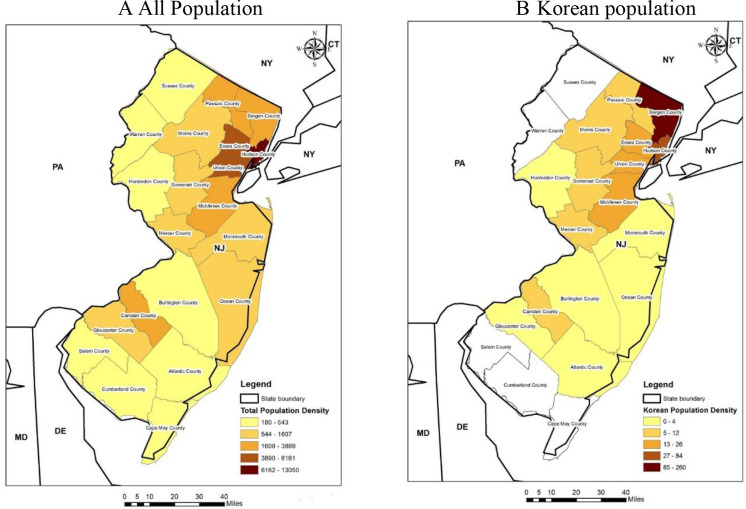
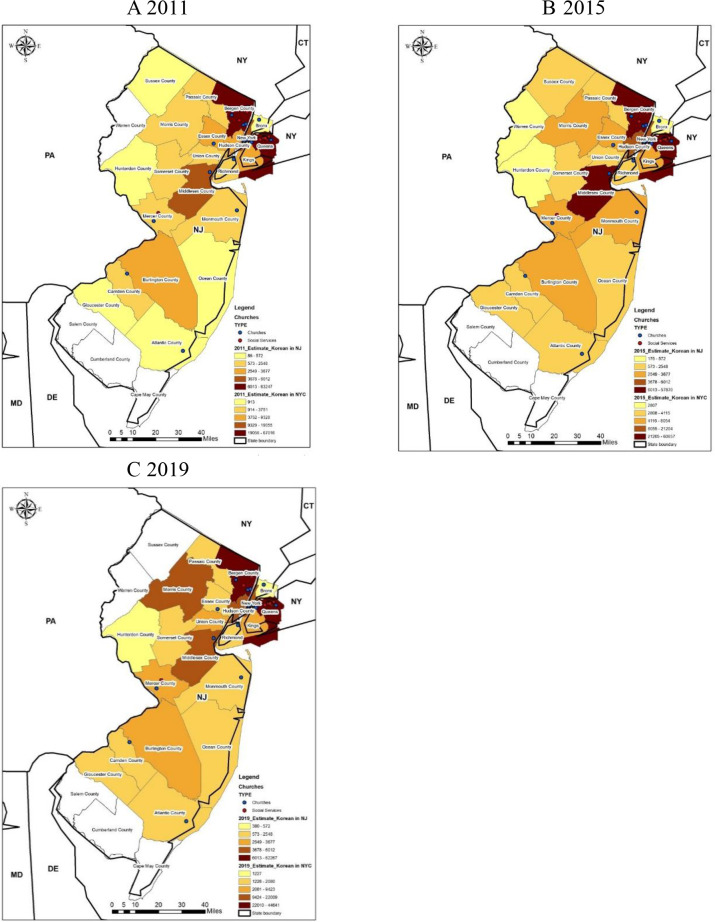
We created unique sociospatial and cultural landforms of KA older adults in New Jersey and the degree to which they are similar or different from other ethnic groups as well as the general adult population. The GIS maps shown in figure 1 through 8 are based on data from both government and local data sets to identify the target sample and improve recruitment. Bergen County in New Jersey is a growing hub and home to the top five municipalities by the percentage of the KA population.64 Compared with the total population in New Jersey as shown in figure 1A, KAs are mostly concentrated in three counties (Bergen, Hudson and Union) and the highest density is in Bergen County as illustrated in figure 1B. As indicated in figure 2, there is a trend towards an increasing KA population in Morris County and Middlesex County from 2011 to 2019.
Figure 1.
Population density in New Jersey by county in 2019. (A) All population (B) Korean population. Source: 2019 American Community Surveys 1-year estimates, Census Bureau.
Figure 2.
Changes in the Korean population in New Jersey by county in 2011, 2015 and 2019. (A) 2011 (B) 2015.(C) 2019. Sources: 2011, 2015 and 2019 American Community Surveys 1-year estimates, Census Bureau.
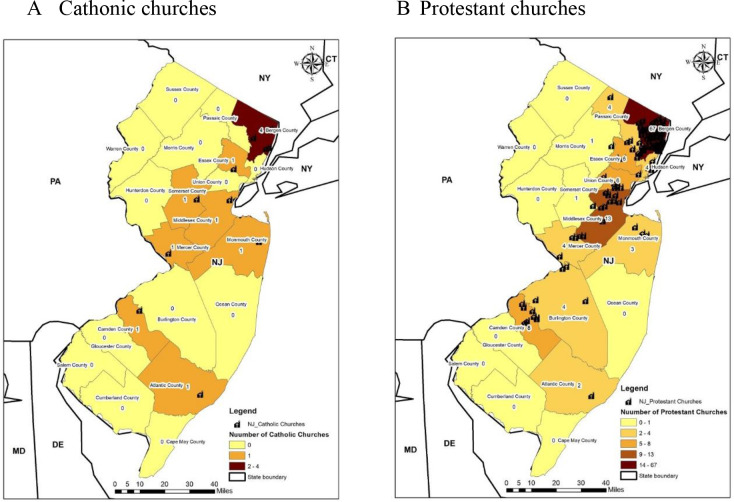
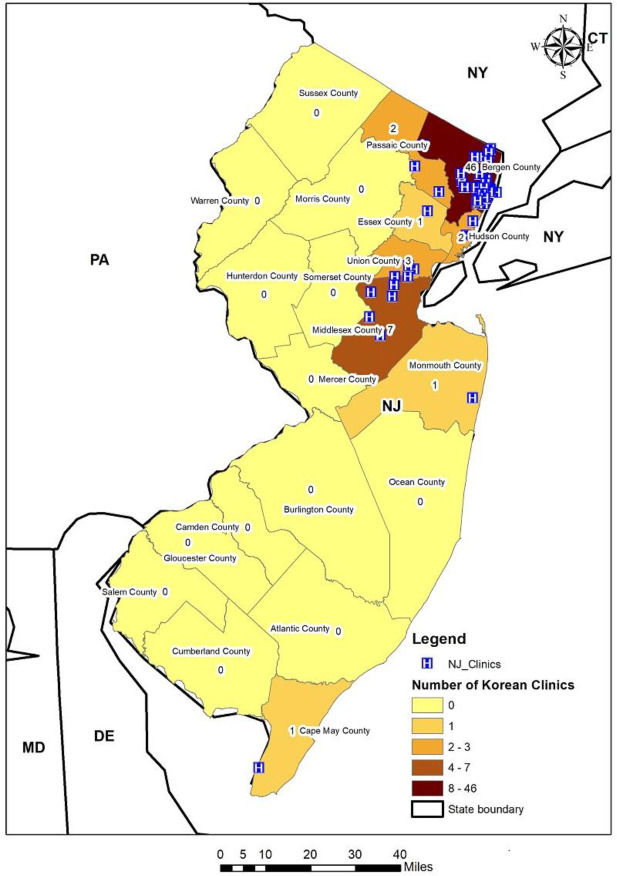
Moreover, we have found large numbers of Korean ethnic churches: specifically, 11 Catholic churches (figure 3A) and 124 protestant churches (figure 3B) and they are primarily located in Bergen County and Middlesex County in New Jersey. Furthermore, figure 4 illustrates the number of Korean-serving medical clinics and most of them are concentrated in Bergen County, New Jersey.
Figure 3.
Number of Korean Churches in New Jersey. Sources: Korean Community Social Networking Service in New Jersey.
Figure 4.
Number of clinics with Korean-serving providers in New Jersey. Sources: Korean Community Social Networking Service in New Jersey.
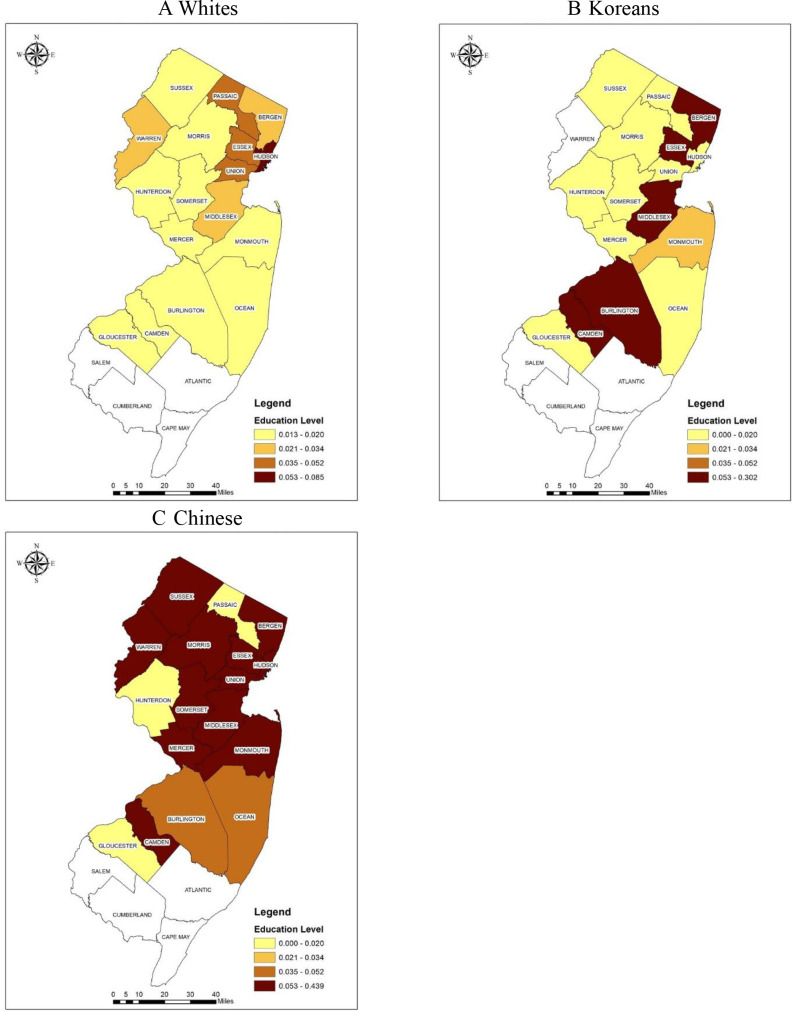
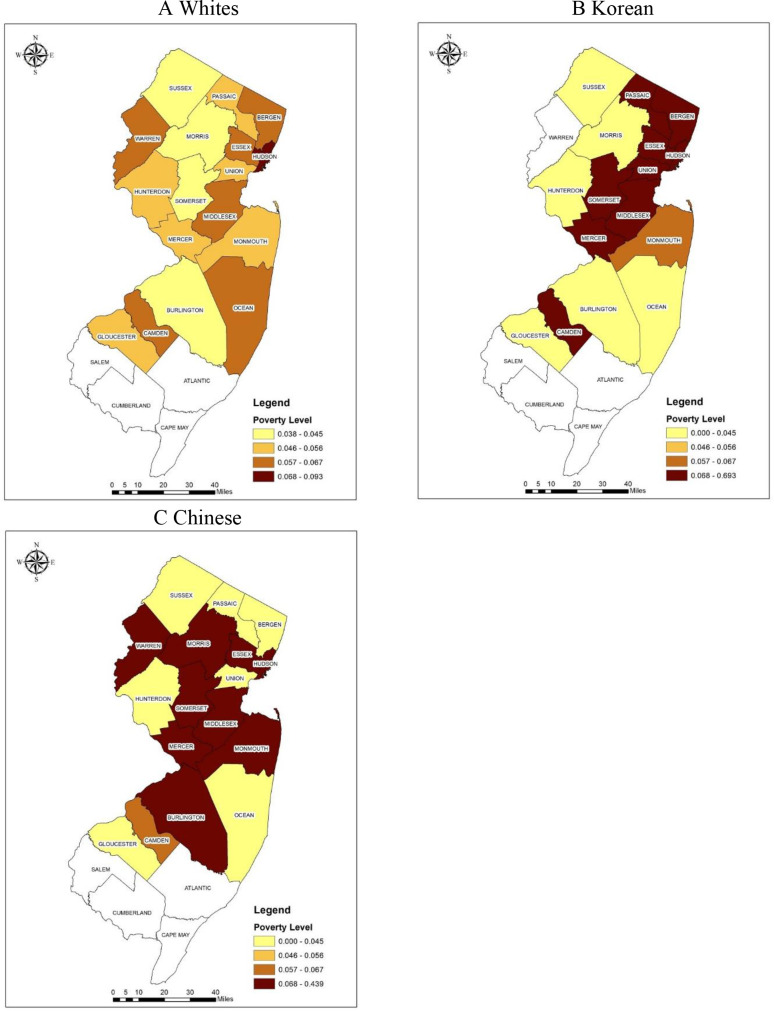
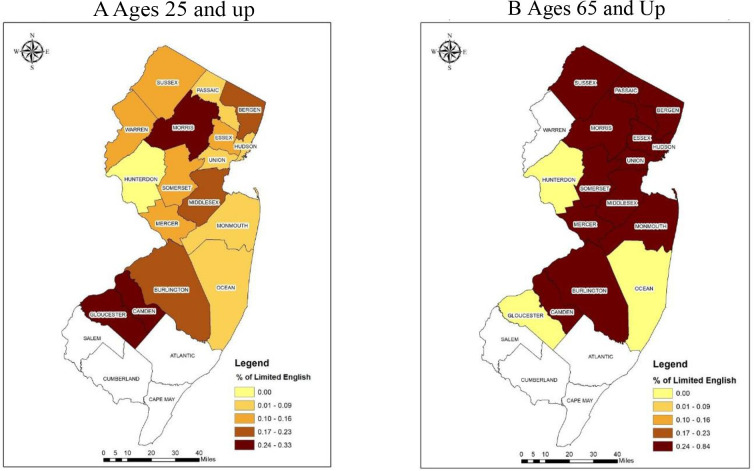
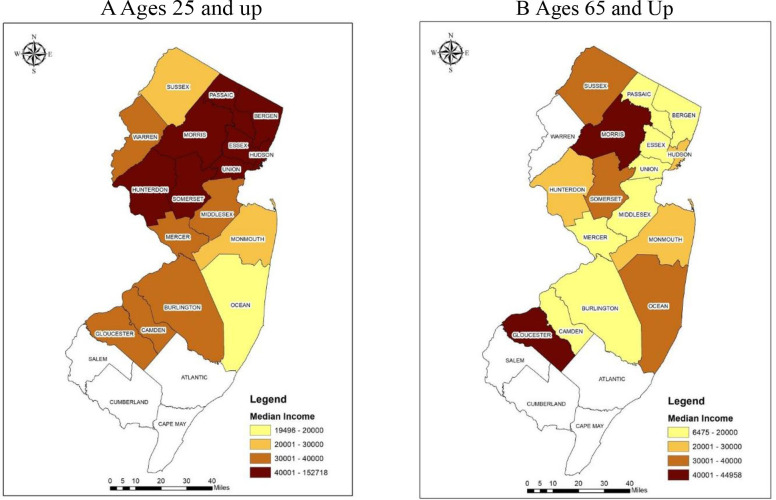
When analysed by age we learnt that KA older adults (65 years and up) had lower education levels, higher poverty rates and more limited English proficiency levels than their white and Chinese American as well as their younger KA counterparts (table 1 and figures 5–8). In detail, the proportion of the population with lower education and higher poverty rates were much higher for KA older adults compared with their white. A higher proportion of KA older adults’ population for both socioeconomic factors were found in portions of northeast (Bergen, Essex, Union, Hudson), central (Middlesex, Somerset, Mercer) and southern counties (Camden) (figures 5 and 6). For the maps in figures 7 and 8, limited English proficiency and median income were compared between young KA adults and old KA adults, respectively. A higher percentage of the KA Population with limited English proficiency and lower median income were found for KA older adults compared with KA younger adults in most of the counties in New Jersey. These findings of low income and linguistic barriers were concordant with our community assessments that there has been an increase in the presence of KA older adults residing in public senior apartments. We have learnt that KA older adults preferred to live where a critical mass of KA reside and close to Korean markets and there was a waitlist to be moved into them. This understanding of geospatial trends of KA older adults housing helped us to design more precise recruitment efforts.
Table 1.
Demographic and socioeconomic characteristics among selected age and race/ethnic groups in New Jersey (NJ)
| Total | White | All Asians | Korean | Chinese | |
| All counties in NJ | 8 878 503 | 4 915 451 | 826 767 | 97 127 | 157 323 |
| Bergen County, NJ | 930 133 | 526 094 | 148 977 | 59 117 | 21 870 |
| Ages 25+ | |||||
| Elementary education or less | 2.6% | 1.6% | 2.2% | 2.5% | 2.2% |
| Below poverty | 6.3% | 4.9% | 6.1% | 9.6% | 5.6% |
| Limited English | 6.5% | 2.2% | 14.8% | 24.3% | 13.2% |
| Ages 65+ | |||||
| Population | 17.1% | 22.0% | 12.9% | 13.5% | 16.3% |
| Elementary education or less | 5.1% | 3.4% | 7.2% | 9.1% | 6.4% |
| Below poverty | 7.7% | 6.1% | 13.0% | 25.1% | 4.5% |
| Limited English | 11.1% | 4.1% | 37.1% | 58.1% | 26.9% |
Sources: 2015–2019 American Community Surveys 5-year estimates, Census Bureau.
Figure 5.
Proportion of population ages 65 and up with elementary schooling or less among selected racial/ethnic groups in New Jersey. (A) Whites (B) Koreans (C) Chinese. Source: 2015–2019 American Community Surveys 5-year estimates, Census Bureau.
Figure 6.
Proportion of population ages 65 and up below the poverty level by selected race/ethnic groups in New Jersey. (A) Whites (B) Korean (C) Chinese. Source: 2015–2019 American Community Surveys 5-year estimates, Census Bureau.
Figure 7.
Per cent of Korean population with limited English proficiency by different age groups in New Jersey. (A) Ages 25 and up (B) Ages 65 and up. Source: 2015–2019 American Community Surveys 5-year estimates, Census Bureau.
Figure 8.
Median income of Korean population by different age groups in New Jersey. (A) Ages 25 and up (B) Ages 65 and up. Source: 2015–2019 American Community Surveys 5-year estimates, Census Bureau.
In particular, concerning education, only Hudson County had over 5% of residents reporting no education or only elementary education among White older adults, whereas several counties including Bergen County, Essex County, Middlesex County, Burlington County and Camden County had over 5% reporting no or only elementary education among KA older adults (figure 5A and B). We also investigated the different geographical distribution of poverty levels between ethnicities in New Jersey (figure 6). Only one county (Hudson County) has over 6.8% below the poverty level and all other counties have less than 6.8% poverty levels among white older adults (figure 6A). In contrast, a larger number of counties have over 6.8% of those living below the poverty level among KA and Chinese American older adults (figure 6B and C). Bergen County, Union County and parts of neighbouring counties represented the areas with the highest level of poverty among KA older adults (figure 6B), while Chinese American older adults living in the highest levels of poverty were primarily concentrated in Warren County and Somerset County (figure 6C). Especially in Bergen County, although income levels are generally higher among the KA population, the older group has a higher poverty rate (25.1%) compared with the poverty level of 9.6% among all KA adults ages 25 and up, and others of the same age group of whites (6.1%), Asian Americans (13.0%) and Chinese Americans (4.5%) (table 1).
Outcomes of recruitment
Based on findings of clusters, we focused our recruitment effort in Bergen County, New Jersey. The recruitment using the GIS strategy we developed based on sociodemographic characteristics of KA older adults who are undereducated, have high poverty rates and have limited English proficiency. We recruited participants from churches, senior apartments, and a Korean serving local neurologist clinic in Bergen County in order to find those without cognitive problems, with mild cognitive impairment or with dementia from the community. We proactively identified specific churches and senior apartments with a high density of KA older adults as well as a Korean-speaking neurologist and successfully recruited the aimed subjects earlier than the planned time frame. We found that most study participants resided within a defined recruitment priority area identified by GIS (table 2, figure 9). However, half of the participants recruited from clinical sites travelled a significant distance to Korean-speaking physicians, coming either from New York or suburban areas in New Jersey.
Table 2.
Geographical distribution of the participants
| Recruitment sources | N (%) | Geographical distribution |
| Ethnic Churches | 18 (30) | NY (n=1), Bergen County (n=17) |
| Senior apartment | 27 (45) | Bergen County (n=27) |
| Korean-speaking neurologist | 15 (25) | NY (n=4) and non-Bergen counties (n=3) Bergen County (n=8) |
NY, New York.
Figure 9.
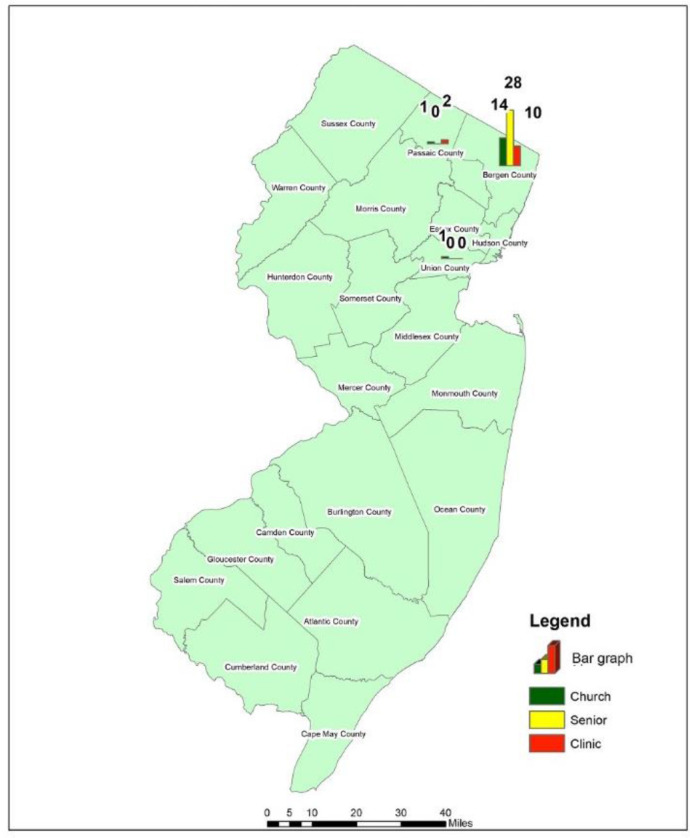
Geographical distribution of the participants by different recruitment sites.
Discussion
We reached our goal of recruiting 60 KA individuals within the proposed period. Our successful recruitment of KA older adults, a hard-to-reach population, benefited from our approach with multiple recruitment strategies including a target population tailored GIS, a detailed understanding of the target population as well as existing community capacity, and a respected relationship between community and researchers.35 69–72 Our pilot data suggest that the target population is interested in participating in clinical studies and our approach would contribute to greater awareness of the important role of the community-based GIS recruitment method so that knowledge generated from this study can be used to inform planning and implementation of future studies with other Asian American older adults or other immigrant populations.
We established a consensus-based diagnosis process for study participants to determine diagnostic categories. The consensus conference with more than two bilingual neurologists and bilingual registered nurse data collectors at the sites was completed. In addition, we used a randomised external review of the cases by two neurologists to assure harmonisation of diagnosis among all ACAD sites which are in progress. Diagnosis categories included probable/possible AD, mild cognitive impairment and normal control and the locations where the most AD cases were identified and recruited will be reported in the next report.
Over 15 million older adults aged 65 and older are economically insecure, with incomes below 200% of the federal poverty level.73 Our findings reveal that KA older adults have distinct socioeconomic characteristics such as higher levels of poverty, lower education levels and lower English proficiency levels compared with other racial/ethnic groups such as white and Chinese. These important differences make it more difficult for the KA older adults to access healthcare facilities compared with other ages and ethnic groups. Most KA older adults live in Bergen County, New Jersey, which borders New York City and is in the top five municipalities with KAs as a percentage of the overall population according to 2010 Census Data.74 The study findings show that a GIS is useful to: (1) conveniently identify and quantify as well as cluster potentially eligible participants in a targeted geographical area; (2) visualise sociodemographic characteristics of KAs including age, poverty, education and language and (3) visualise the resources of faith-based organisations and medical clinics. The geographical distribution of KAs is not evenly spread across the state, which is different from that of mainstream populations that might influence their access to healthcare and health research participation. Given the distinct sociocultural factors and a high degree of local heterogeneity within geographical regions as well as a lack of data sets for small-sized population, we have learnt that conducting participatory GIS to address local level data deficiency for recruitment of KA older adults in New Jersey could be one solution to increase minority recruitments.
Most participants were recruited from KA dense areas, but the participants recruited from the clinical site did not all reside in KA dense areas but travelled a long distance to see the Korean-speaking physician. With only a small number of Korean-speaking physicians, ADRD patients or family caregivers are willing to travel a long distance to see culture and language matched healthcare professionals. The findings that no AD and dementia treating institutions provide KA-specific services even in New York City and Bergen County, New Jersey with a dense KA population points to the challenges KA older adults face with getting a dementia diagnosis and ADRD management. In the same vein, KA older adults inequitably share risks and benefits of clinical research participation while it also makes it more difficult for researchers to recruit and study this under-served and under-represented group.
A GIS visual presentation of numeric sociodemographic data plays an essential role in assessing the varied distribution of the small-sized KA minority and is a powerful tool for recruitment strategies to increase understanding of the heterogeneity of minority population distribution, which may not be easily observed in typical numeric data presented in a tabular form. In addition to standard typical datasets, unique data from the community-based social network data based on geodemographics at the local level provides comprehensive data on KA older adults and neighbourhoods. The GIS-based information helps us to develop specific group-tailored recruitment strategies by allowing us to conveniently visualise and link demographic, socioeconomic and local community-level specific characteristics of the target population.
This study demonstrates the value of a community-based participatory research model combined with GIS in tailoring targeted outreach strategies by combining spatial and local resources to identify clusters or enclaves of a hard-to-reach population. When diagnostic data analysis is completed, GIS can define the magnitude of cognitive impairment, and the location of KA ADRD in populations for public health departments and ADRD researchers. We think that it is an excellent strategy that community leaders who provide local resource information continues to be involved in identifying and recruiting potential participants and that they work with senior community leaders at KA senior dense apartments rather than general community leaders as they have closer relationships with older adults. The benefit of providing a multitude of datasets for GIS development is that the application can be directly integrated with the recruitment plans. Based on our findings, we will continue to develop a community-based recruitment plan for Asian American older adults residing in the community in New Jersey and in the Northeast region of the USA to secure racially/ethnically diverse samples.
Limitations
There are several limitations. First, since we were only able to capture a snapshot of the specific socioeconomic characteristics of the Korean older population using the most recent available census data prior to the recruitment, our prerecruitment analysis did not reflect any long-term longitudinal changes and patterns of KA older population. Second, we only examined the sociodemographics of KA older adults in New Jersey and did not identify urban vs rural environments so that the findings must be cautiously applied to other geographical regions and other ethnic groups. Third, using publicly available online social network data has inherent limitations related to completeness, correctness and timeliness in reporting as well as that data might be different from offline data.
Implications
Our findings demonstrate the value of GIS for the recruitment of Asian American older adult immigrants through using community resources. GIS findings provide a detailed knowledge of the spatial distribution of targeted population attributes of density, income, education, language, churches and healthcare clinics for Korean-speaking older adults. Moreover, the detailed spatial datasets help us to strategically recruit our target population. Asian Americans have been often referred to as ‘model minorities’ based on their relatively higher median income and educational levels compared with other racial/ethnic groups in the USA.12 16 74 75 but within these groups, a huge variation in income and linguistics exists.30 76 We showed this heterogeneity by disaggregating demographic, socioeconomic and cultural characteristics of KAs who otherwise could have been overlooked. Healthcare and clinical studies for older adult immigrants are particularly challenged by difficulties in recruitment due to low education levels, low economic status and low English proficiency, and their impact on recruitment should be addressed and further studied. However, developing and implementing GIS by healthcare researchers is not possible if there are no existing spatial data on the targeted populations. But in reality, there is a lack of community-based social network data for Asian Americans, especially the dataset that disaggregates Asian American subgroups.77 Most population data tend to not collect relatively small-sized samples of Asian American subgroups; thus, it cannot be meaningfully used in GIS development. As a result, we created an innovative method of local community engagement to capture spatial data about the distribution of churches and KA serving healthcare clinics. These community-based participatory research approaches are based on respect for local knowledge and recognising that the communities can make a critical contribution by creating and changing things.18 35 60 69 70 78 This novel approach based on spatial and non-spatial data into one framework have far-reaching implication in researching currently understudied populations and this is important for both fair representation of all populations and the translatability of the findings.
This approach responds to the call from the National Institute on Aging to develop strategies to improve the health status of older adults in diverse populations. Results from the full-scale ACAD study will provide health researchers and policy-makers with practical evidence on how to identify and increase the participation of Asian American older adults in clinical studies that could be used as a national model for reducing health and research disparities among minority older adult populations. Moreover, this study highlights the importance of GIS application in public health studies and has major implications for our understanding of the heterogeneity of minority population distribution and community outreach efforts.
Supplementary Material
Footnotes
Contributors: HL: substantial contributions to the conception, design, data collection, analysis and interpretation. HH: conception and design of the work, analysis, writing, final approval and agreement to be accountable for all aspect of the work. SY: design, acquisition, data analysis, interpretation of data, final approval and agreement to be accountable for all aspect of the work. H-SY: design, acquisition and interpretation of data, final approval and agreement to be accountable for all aspect of the work. VL: design, acquisition, reviewing, final approval and agreement to be accountable for all aspect of the work. EH: design, acquisition, reviewing, final approval and agreement to be accountable for all aspect of the work. TC: conception and interpretation of data, final approval and agreement to be accountable for all aspect of the work. VTP: conception and interpretation of data, final approval and agreement to be accountable for all aspect of the work. L-SW: conception and interpretation of data, final approval and agreement to be accountable for all aspect of the work. GJ: conception and interpretation of data, final approval and agreement to be accountable for all aspect of the work. Y-BC: conception and design of the work, interpretation, analysis and interpretation of data conception and interpretation of data, final approval and agreement to be accountable for all aspect of the work.
Funding: The work is supported by NIA (R56AG069130), Asian Cohort for Alzheimer’s Disease (ACAD).
Map disclaimer: The inclusion of any map (including the depiction of any boundaries therein), or of any geographic or locational reference, does not imply the expression of any opinion whatsoever on the part of BMJ concerning the legal status of any country, territory, jurisdiction or area or of its authorities. Any such expression remains solely that of the relevant source and is not endorsed by BMJ. Maps are provided without any warranty of any kind, either express or implied.
Competing interests: None declared.
Provenance and peer review: Not commissioned; externally peer reviewed.
Ethics approval
The ACAD study is approved by the institutional review board of University of Pennsylvania, Philadelphia, Pennsylvania, USA.
References
- 1.Alzheimer’s Association . 2019 Alzheimer’s Disease facts and figures. Alzheimer’s & Dementia 2019;15:321–87. 10.1016/j.jalz.2019.01.010 [DOI] [Google Scholar]
- 2.Matthews KA, Xu W, Gaglioti AH, et al. Racial and ethnic estimates of Alzheimer's Disease and related dementias in the United States (2015-2060) in adults aged ≥65 years. Alzheimers & Dement 2019;15:17–24. 10.1016/j.jalz.2018.06.3063 [DOI] [PMC free article] [PubMed] [Google Scholar]
- 3.Shin J-H. Dementia epidemiology fact sheet 2022. Ann Rehabil Med 2022;46:53–9. 10.5535/arm.22027 [DOI] [PMC free article] [PubMed] [Google Scholar]
- 4.WHO . World health organization fact sheets of dementia. 2022. Available: https://www.who.int/news-room/fact-sheets/detail/dementia
- 5.Chin AL, Negash S, Hamilton R. Diversity and disparity in dementia: the impact of ethnoracial differences in Alzheimer Disease. Alzheimer Dis Assoc Disord 2011;25:187–95. 10.1097/WAD.0b013e318211c6c9 [DOI] [PMC free article] [PubMed] [Google Scholar]
- 6.Raman R, Quiroz YT, Langford O, et al. Disparities by race and ethnicity among adults recruited for a preclinical Alzheimer Disease trial. JAMA Netw Open 2021;4:e2114364. 10.1001/jamanetworkopen.2021.14364 [DOI] [PMC free article] [PubMed] [Google Scholar]
- 7.Kunkle BW, Grenier-Boley B, Sims R, et al. Author correction: genetic meta-analysis of diagnosed Alzheimer's Disease identifies new risk loci and implicates Aβ, tau, immunity and lipid processing. Nat Genet 2019;51:1423–4. 10.1038/s41588-019-0495-7 [DOI] [PMC free article] [PubMed] [Google Scholar]
- 8.Thornton LR, Amorrortu RP, Smith DW, et al. Exploring willingness of elder Chinese in Houston to participate in clinical research. Contemp Clin Trials Commun 2016;4:33–8. 10.1016/j.conctc.2016.06.006 [DOI] [PMC free article] [PubMed] [Google Scholar]
- 9.Ma GX, Seals B, Tan Y, et al. Increasing Asian American participation in clinical trials by addressing community concerns. Clin Trials 2014;11:328–35. 10.1177/1740774514522561 [DOI] [PMC free article] [PubMed] [Google Scholar]
- 10.George S, Duran N, Norris K. A systematic review of barriers and facilitators to minority research participation among African Americans, Latinos, Asian Americans, and Pacific Islanders. Am J Public Health 2014;104:e16–31. 10.2105/AJPH.2013.301706 [DOI] [PMC free article] [PubMed] [Google Scholar]
- 11.Colby S, Ortman J. Projections of the size and composition of the US population: 2014 to 2060 (current population reports, P25–1143). Washington, DC: US Census Bureau; 2017. [Google Scholar]
- 12.National Asian Pacific center of aging (NAPCA) . Asian Americans and Pacific Islanders in the United States aged 65 years and older: population, nativity, and language. Data Brief, 2013: 1–9. [Google Scholar]
- 13.Faison WE, Schultz SK, Aerssens J, et al. Potential ethnic modifiers in the assessment and treatment of Alzheimer’s Disease: challenges for the future. Int Psychogeriatr 2007;19:539–58. 10.1017/S104161020700511X [DOI] [PubMed] [Google Scholar]
- 14.Lim S, Mohaimin S, Min D, et al. Alzheimer's disease and its related dementias among Asian Americans, native Hawaiians, and Pacific Islanders: a scoping review. J Alzheimers Dis 2020;77:523–37. 10.3233/JAD-200509 [DOI] [PMC free article] [PubMed] [Google Scholar]
- 15.DHHS . Healthy people 2020: topics & objectives: dementia including AD. DIA-1 Data Details; 2018. Available: https://www.healthypeople.gov/node/3517/data-details [Google Scholar]
- 16.Hoeffel EM, Rastogi S, Kim MO, et al. The Asian population: 2010 2010 census Briefs. n.d. Available: https://www.census.gov/prod/cen2010/briefs/c2010br-11.pdf
- 17.Lee S, Martinez G, Ma GX, et al. Barriers to health care access in 13 Asian American communities. Am J Health Behav 2010;34:21–30. 10.5993/ajhb.34.1.3 [DOI] [PMC free article] [PubMed] [Google Scholar]
- 18.Lee H, Baik S-Y. Health disparities or data disparities: sampling issues in hepatitis B virus infection among Asian American Pacific Islander studies. Appl Nurs Res 2011;24:e9–15. 10.1016/j.apnr.2009.12.005 [DOI] [PubMed] [Google Scholar]
- 19.Quay TA, Frimer L, Janssen PA, et al. Barriers and facilitators to recruitment of South Asians to health research: a Scoping review. BMJ Open 2017;7:e014889. 10.1136/bmjopen-2016-014889 [DOI] [PMC free article] [PubMed] [Google Scholar]
- 20.HUGO Pan-Asian SNP Consortium, Abdulla MA, Ahmed I, et al. Mapping human genetic diversity in Asia. Science 2009;326:1541–5. 10.1126/science.1177074 [DOI] [PubMed] [Google Scholar]
- 21.Lee S, Kim D, Lee H. Examine race/ethnicity disparities in perception, intention, and screening of dementia in a community setting: scoping review. Int J Environ Res Public Health 2022;19:8865. 10.3390/ijerph19148865 [DOI] [PMC free article] [PubMed] [Google Scholar]
- 22.Lee H, Kim D, Jung A, et al. Ethnicity, social, and clinical risk factors to tooth loss among older adults in the U.S., NHANES 2011-2018. Int J Environ Res Public Health 2022;19:2382. 10.3390/ijerph19042382 [DOI] [PMC free article] [PubMed] [Google Scholar]
- 23.Disse E, Ledoux S, Bétry C, et al. An artificial neural network to predict resting energy expenditure in obesity. Clin Nutr 2018;37:1661–9. 10.1016/j.clnu.2017.07.017 [DOI] [PubMed] [Google Scholar]
- 24.Ha H. Using geographically weighted regression for social inequality analysis: association between mentally unhealthy days (Muds) and socioeconomic status (SES) in U.S. counties. Int J Environ Health Res 2019;29:140–53. 10.1080/09603123.2018.1521915 [DOI] [PubMed] [Google Scholar]
- 25.Ha H, Shao W. A spatial epidemiology case study of mentally unhealthy days (MUDs): air pollution, community resilience, and sunlight perspectives. Int J Environ Health Res 2021;31:491–506. 10.1080/09603123.2019.1669768 [DOI] [PubMed] [Google Scholar]
- 26.Rushton G. Public health, GIS, and spatial analytic tools. Annu Rev Public Health 2003;24:43–56. 10.1146/annurev.publhealth.24.012902.140843 [DOI] [PubMed] [Google Scholar]
- 27.Solis-Paredes M, Estrada-Gutierrez G, Perichart-Perera O, et al. Key clinical factors predicting Adipokine and oxidative stress marker concentrations among normal, overweight and obese pregnant women using artificial neural networks. Int J Mol Sci 2017;19:86. 10.3390/ijms19010086 [DOI] [PMC free article] [PubMed] [Google Scholar]
- 28.Cain KL, Salmon J, Conway TL, et al. International physical activity and built environment study of adolescents: IPEN adolescent design, protocol and measures. BMJ Open 2021;11:e046636. 10.1136/bmjopen-2020-046636 [DOI] [PMC free article] [PubMed] [Google Scholar]
- 29.Wang F. Why public health needs GIS: a methodological overview. Ann GIS 2020;26:1–12. 10.1080/19475683.2019.1702099 [DOI] [PMC free article] [PubMed] [Google Scholar]
- 30.Hirshorn BA, Stewart JE. Geographic information systems in community-based gerontological research and practice. J Appl Gerontol 2003;22:134–51. 10.1177/073346402250476 [DOI] [Google Scholar]
- 31.Ho E-E, Zhou G, Liew JA, et al. Webs of care: qualitative GIS research on aging, mobility, and care relations in Singapore. Ann Am Assoc Geogr 2021;111:1462–82. 10.1080/24694452.2020.1807900 [DOI] [Google Scholar]
- 32.Li Y, Xu B, Ewing R, et al. Measuring spatial accessibility to adult day services for older adults using GIS. Pap Appl Geogr 2023:1–11. 10.1080/23754931.2023.2195869 [DOI] [Google Scholar]
- 33.Scerpella DL, Adam A, Marx K, et al. Implications of geographic information systems (GIS) for targeted recruitment of older adults with dementia and their caregivers in the community: a retrospective analysis. Contemp Clin Trials Commun 2019;14:100338. 10.1016/j.conctc.2019.100338 [DOI] [PMC free article] [PubMed] [Google Scholar]
- 34.Firouraghi N, Kiani B, Jafari HT, et al. The role of geographic information system and global positioning system in dementia care and research: a scoping review. Int J Health Geogr 2022;21:8.:8. 10.1186/s12942-022-00308-1 [DOI] [PMC free article] [PubMed] [Google Scholar]
- 35.Lee H-O, Lee O-J, Kim S, et al. Differences in knowledge of hepatitis B among Korean immigrants in two cities in the rocky mountain region. Asian Nurs Res (Korean Soc Nurs Sci) 2007;1:165–75. 10.1016/S1976-1317(08)60019-5 [DOI] [PubMed] [Google Scholar]
- 36.Min P. Caught in the middle: Korean communities in NY and LA. University of CA Press, 1996. [Google Scholar]
- 37.Pew Research Center . Korean in the U.S fact sheet; 2021. Available: https://www.pewresearch.org/social-trends/fact-sheet/asian-americans-koreans-in-the-u-s/
- 38.Wu SY. NJ labor market views: New Jersey’s Asian population by Asian group: 2010. New Jersey Labor Market & Demographic Research (N.J. LMDR); 2012. Available: https://nj.gov/labor/lpa/pub/lmv/lmv_18.pdf [Google Scholar]
- 39.Li J, Maxwell AE, Glenn BA, et al. Healthcare access and utilization among Korean Americans: the mediating role of english use and proficiency. Int J Soc Sci Res 2016;4:83–97. 10.5296/ijssr.v4i1.8678 [DOI] [PMC free article] [PubMed] [Google Scholar]
- 40.Min PG, Andrew K. The middleman minority characteristics of Korea immigrants in the United States. Korean Popul Devel 1994;23:179–202. [PubMed] [Google Scholar]
- 41.Min PG, Kim C. The changing effect of education on Asian immigrants’ self-employment. Sociol Inq 2018;88:435–66. 10.1111/soin.12212 [DOI] [Google Scholar]
- 42.Brown ER, Ojeda VD, Wyn R, et al. Racial and ethnic disparities in access to health insurance and health care. Los Angeles: UCLA Center for Health Policy Research; 2000. Available: http://escholarship.org/uc/item/4sf0p1st [Google Scholar]
- 43.Shin H, Song H, Kim J, et al. Insurance, acculturation, and health service utilization among Korean-Americans. J Immigr Health 2005;7:65–74. 10.1007/s10903-005-2638-4 [DOI] [PubMed] [Google Scholar]
- 44.Yoo G. Kim B. Korean immigrants and health care access: implications for the uninsured and underinsured. Res Soci Heal Care 2007;25:77–94. [Google Scholar]
- 45.Adams RJ, Smart P, Huff AS. Shades of grey: guidelines for working with the grey literature in systematic reviews for management and organizational studies. Int J Manag Rev 2017;19:432–54. 10.1111/ijmr.12102 [DOI] [Google Scholar]
- 46.Benzies KM, Premji S, Hayden KA, et al. State-of-the-evidence reviews: advantages and challenges of including grey literature. Worldviews Evid Based Nurs 2006;3:55–61. 10.1111/j.1741-6787.2006.00051.x [DOI] [PubMed] [Google Scholar]
- 47.Piggott-McKellar AE, McNamara KE, Nunn PD, et al. What are the barriers to successful community-based climate change adaptation? A review of grey literature. Local Environment 2019;24:374–90. 10.1080/13549839.2019.1580688 [DOI] [Google Scholar]
- 48.U.S. Census Bureau . Selected demographic characteristics, 2015-2019 American community survey 5-year estimates. 2021. Available: https://data.census.gov/cedsci/
- 49.Ruggle S, Flood S, Foster S, et al. IPUMS USA: version 11.0. dataset. Minneapolis, MN: IPUMS; 2021. Available: 10.18128/D010.V11.0 [DOI] [Google Scholar]
- 50.U.S. Census Bureau . 2011, 2015, 2019 American community survey 1 year estimates. 2021. Available: https://data.census.gov/cedsci/
- 51.Büyüm AM, Kenney C, Koris A, et al. Decolonising global health: if not now, when? BMJ Glob Health 2020;5:e003394. 10.1136/bmjgh-2020-003394 [DOI] [PMC free article] [PubMed] [Google Scholar]
- 52.McGill E, Egan M, Petticrew M, et al. Trading quality for relevance: non-health decision-makers' use of evidence on the social determinants of health. BMJ Open 2015;5:e007053. 10.1136/bmjopen-2014-007053 [DOI] [PMC free article] [PubMed] [Google Scholar]
- 53.Hutton NS, McLeod G, Allen TR, et al. Participatory mapping to address neighborhood level data deficiencies for food security assessment in southeastern Virginia, USA. Int J Health Geogr 2022;21:17. 10.1186/s12942-022-00314-3 [DOI] [PMC free article] [PubMed] [Google Scholar]
- 54.The Catholic peace time weekly . The Catholic peace time weekly incorporation. 2022. Available: https://peacetimesweekly.org/ny/main
- 55.Christian daily: American Korean church address; 2022. Available: https://kr.christianitydaily.com/address/list.htm?org_type=C&ch_state=NJ
- 56.Korean daily service: Korean business Directory of NY & NJ. 2022. Available: https://haninyp.com/bbs/board.php?bo_table=9001&wr_id=46
- 57.Shaghaghi A, Bhopal RS, Sheikh A. “Approaches to recruiting 'hard-to-reach' populations into re-search: a review of the literature”. Health Promot Persp 2011;1:86–94. [DOI] [PMC free article] [PubMed] [Google Scholar]
- 58.Hwang DA, Lee A, Song JM, et al. Recruitment and retention strategies among racial and ethnic minorities in web-based intervention trials: retrospective qualitative analysis. J Med Internet Res 2021;23:e23959. 10.2196/23959 [DOI] [PMC free article] [PubMed] [Google Scholar]
- 59.Islam NS, Khan S, Kwon S, et al. Methodological issues in the collection, analysis, and reporting of granular data in Asian American populations: historical challenges and potential solutions. J Health Care Poor Underserved 2010;21:1354–81. 10.1353/hpu.2010.0939 [DOI] [PMC free article] [PubMed] [Google Scholar]
- 60.Datta R. Decolonizing both researcher and research and its effectiveness in indigenous research. Research Ethics 2018;14:1–24. 10.1177/1747016117733296 [DOI] [Google Scholar]
- 61.Zavala M. What do we mean by decolonizing research strategies? Lessons from decolonizing, indigenous research projects in New Zealand and Latin America. Decolon: Indigen Edu Socie 2013;2:55–71. [Google Scholar]
- 62.Sadler RC, Hippensteel C, Nelson V, et al. Community-engaged development of a GIS-based healthfulness index to shape health equity solutions. Soc Sci Med 2019;227:63–75. 10.1016/j.socscimed.2018.07.030 [DOI] [PMC free article] [PubMed] [Google Scholar]
- 63.Sharma M, Koh D. Korean Americans in Los Angeles: decentralized concentration and socio‐spatial disparity. Geographical Review 2019;109:356–81. 10.1111/gere.12358 [DOI] [Google Scholar]
- 64.Chao SZ, Lai NB, Tse MM, et al. Recruitment of Chinese American elders into dementia research: the UCSF ADRC experience. Gerontologist 2011;51 Suppl 1(Suppl 1):S125–33. 10.1093/geront/gnr033 [DOI] [PMC free article] [PubMed] [Google Scholar]
- 65.Park C, Jang M, Nam S, et al. Church-based recruitment to reach Korean immigrants: an integrative review. West J Nurs Res 2018;40:1396–421. 10.1177/0193945917703938 [DOI] [PubMed] [Google Scholar]
- 66.Heckathorn DD. Respondent-driven sampling: a new approach to the study of hidden populations. Social Problems 1997;44:174–99. 10.1525/sp.1997.44.2.03x0221m [DOI] [Google Scholar]
- 67.Badowski G, Somera LP, Simsiman B, et al. The efficacy of respondent-driven sampling for the health assessment of minority populations. Cancer Epidemiol 2017;50(Pt B):214–20. 10.1016/j.canep.2017.07.006 [DOI] [PMC free article] [PubMed] [Google Scholar]
- 68.Heckathorn DD. Respondent-driven sampling II: deriving valid population estimates from chain-referral samples of hidden populations. Social Problems 2002;49:11–34. 10.1525/sp.2002.49.1.11 [DOI] [Google Scholar]
- 69.Shaghaghi A, Bhopal RS, Sheikh A. “Approaches to recruiting 'hard-to-reach' populations into re-search: a review of the literature”. Health Prom Persp 2011;20:86–94. [DOI] [PMC free article] [PubMed] [Google Scholar]
- 70.Field B, Mountain G, Burgess J, et al. Recruiting hard to reach populations to studies: breaking the silence: an example from a study that recruited people with dementia. BMJ Open 2019;9:e030829. 10.1136/bmjopen-2019-030829 [DOI] [PMC free article] [PubMed] [Google Scholar]
- 71.Freire P. Creating alternative research methods: learning to do it by doing it by doing it. In: Hall B, Gillette A, Tandon R, eds. Creating knowledge: A monopoly. New Delhi: Socie Particip Res in Asia, 1982: 29–37. [Google Scholar]
- 72.Ta Park VM, Meyer OL, Tsoh JY, et al. The Collaborative Approach for Asian Americans and Pacific Islanders research and education (CARE): a recruitment registry for Alzheimer's Disease and related dementias, aging, and caregiver-related research. ADs & Demen 2022. 10.1002/alz.12667 [DOI] [PMC free article] [PubMed] [Google Scholar]
- 73.Cubanski J, Koma W, Damico A, et al. How many seniors live in poverty? Henry J Kaiser Family Foundation; 2018. Available: https://files.kff.org/attachment/Issue-Brief-How-Many-Seniors-Live-in-Poverty [Google Scholar]
- 74.U.S. Census Bureau . Quickfacts Bergen County, NJ. 2022. Available: https://www.census.gov/quickfacts/fact/table/bergencountynewjersey/PST045221
- 75.Kawai Y. Stereotyping Asian Americans: the dialectic of the model minority and the yellow peril. Howard J Commun 2005;16:109–30. 10.1080/10646170590948974 [DOI] [Google Scholar]
- 76.Gordon NP, Lin TY, Rau J, et al. Aggregation of Asian-American subgroups masks meaningful differences in health and health risks among Asian ethnicities: an electronic health record-based cohort study. BMC Public Health 2019;19:1551. 10.1186/s12889-019-7683-3 [DOI] [PMC free article] [PubMed] [Google Scholar]
- 77.Yom S, Lor M. Advancing health disparities research: the need to include Asian American subgroup populations. J Racial Ethn Health Disparities 2022;9:2248–82. 10.1007/s40615-021-01164-8 [DOI] [PMC free article] [PubMed] [Google Scholar]
- 78.Lin CY, Loyola-Sanchez A, Boyling E, et al. Community engagement approaches for indigenous health research: recommendations based on an integrative review. BMJ Open 2020;10:e039736. 10.1136/bmjopen-2020-039736 [DOI] [PMC free article] [PubMed] [Google Scholar]
Associated Data
This section collects any data citations, data availability statements, or supplementary materials included in this article.


