

Abstract
Background
Past studies have identified determinants of growth failure (GF) such as socio-economic, nutritional, parenting, and inequality factors. However, few studies investigate the numerous causes of GF across multiple countries. By analysing the data of children under five in 25 low and middle-income countries, this study aims to examine the correlations of determinants with GF to identify the strongest modifiable risk factors.
Methods
Cross-sectional study design was used, and data were collected across 25 LMICs by the United Nations Children's Fund in 2019. Regions and households were randomly selected in participating LMICs. The four outcome measures were stunting, wasting, underweight and low body mass index (BMI).
Results
Multilevel analysis was performed to identify the impact of country, suburb, and household levels on the variance of outcome variables. GF measures were significantly correlated with low gross domestic product (GDP) per capita (odds ratio (OR) = 2.482), rural areas (OR = 1.223), lack of health insurance (OR = 1.474), low maternal education (OR = 2.260), lack of plain water (OR = 1.402), poor maternal physical caregiving ability (OR = 1.112), low carbohydrate consumption (OR = 1.470), and continued breastfeeding in children >12 months old (OR = 0.802).
Conclusions
By identifying key GF risk factors, this study may provide valuable insights for policymaking and interventions. This may allow the prioritisation of resources within countries for preventative measures to be developed.
Despite improvements in rates of growth failure (GF) since 2000, one in four children under five in low- and middle-income countries (LMICs) still suffered from at least one dimension of GF in 2020 [1]. Global estimates of GF rates determined that 22% of children were stunted and 7% were wasted in 2020, with 85% of GF occurring in LMICs [2-6]. GF manifests as anthropometric failures characterised by insufficient height or weight in reference to age-specific growth standards [1]. Assessment of anthropometric failure is traditionally done with the indicators of stunting, wasting, and underweight, which are defined as height-for-age, weight-for-height, and weight-for-age respectively that are more than two standard deviations below the World Health Organisation's (WHO) median child growth reference standards [1]. Children living in LMICs have faced many grave challenges due to socioeconomic disadvantages, including extreme poverty, inadequate access to health care services, food insecurity and poor nutrition [7-11]. Furthermore, household factors such as maternal education and caregiving ability can impact feeding practices, rates of breastfeeding, and the overall burden of child anthropometric failure, which will also be addressed in this study [12,13].
A major gap in current research is the lack of studies that examine multiple determinants across various LMICs. Prior research on GF tends to focus on and assess a single factor or a small subset of factors, while other studies only investigated one country such as Ethiopia or Bangladesh [13-20]. Consequently, there is a lack of studies that assess cross-country heterogeneity and the relative significance of different determinants at the household, region, and country levels [13]. It is hypothesized determinants in all three of these levels will demonstrate a correlation with the burden of GF amongst children under five. This study aims to determine the prevalence of GF measures across multiple LMICs to identify countries that are most severely affected and examine the correlations of determinants with GF to identify the strongest modifiable risk factors.
METHODS
This multivariable secondary data analysis study investigated 25 different LMICs and the correlations of various socioeconomic and household factors with GF in children under five.
Data source
The data was collected through Multiple Indicator Cluster Surveys (MICS) by UNICEF. MICS is an international household survey program developed by UNICEF in the 1990s to obtain statistically sound and internationally comparable data on a wide range of indicators regarding the situation of men and women [21]. This study analysed the 2019 surveys of mothers with children under five of both sexes from 25 LMICs. This included Mongolia, Bangladesh, Nepal, Iraq, Kiribati, Zimbabwe, Serbia, Algeria, Central African Republic, Chad, Costa Rica, Cuba, Georgia, Guinea Bissau, Kosovo, Kyrgyzstan, Lesotho, Montenegro, Republic of North Macedonia, Palestine, Suriname, Gambia, Tonga, Tunisia, and Turkmenistan. The sampling frame was based on postcode address files and cluster sampling was used. The data was collected via face-to-face interviews from randomly selected households in randomly selected suburbs for each country for a total of 173 365 participants. All MICS surveys are based on representative samples, selected by using probabilistic, random samples. The provinces within each country were identified. The principal strata for sampling were determined to be the urban and rural areas within each province. A predetermined number of suburbs within each stratum were deliberately chosen at the first sampling step with probability proportionate to size. Within the chosen suburbs, a household listing was done to determine which families had and did not have children under the age of five. Through a computer-based systematic random selection procedure, households with children under the age of five were chosen in each sample enumeration region. If an interview was refused in a selected household, the supervisor of the team returned to that household to explain the importance of the survey and to encourage the respondent to participate. If the household still refused to be interviewed, the result of the household interview was marked as “refused”.
Permission from the UNICEF office was provided to the principal supervisor and all collaborators to use the data, so no ethics application was required. All data were de-identified when provided, allowing confidentiality to be maintained. Approval forms were signed to receive permission from each country to access the participant information.
Outcome variables
The outcome variables were used to determine GF and included body mass index (BMI) for age, height for age, weight for height, and weight for age. The age and sex were recorded to assist in assessing the number of standard deviations from the mean for each child with reference to the WHO growth charts Z score tables “Birth to 2 years” and “2 to 5 years” [22].
Predictors
The three levels of data were country, region, and individual / household. The individual-level independent variables were nutrition, breastfeeding, caregiving ability and inequalities (wealth index, health insurance, fluid intake and mother's education). Region-level factors included area (urban, rural), and suburb. Country-level factors included GDP per capita and continent.
Nutrition
Mothers were asked whether their children ate certain types of food yesterday such as mangoes and papayas. Vegetables included pumpkin, carrots, squash etc. that are yellow or orange inside, as well as green leafy vegetables. Carbohydrates included foods made from grains and those made from roots such as white potatoes, white yams, manioc, cassava etc. The eight protein variables included eggs, animal milk, yoghurt, meat, organ meat such as liver, fish or shellfish, beans, and cheese.
Breastfeeding
Breastfeeding status was determined by asking if the child is currently being breastfed and if the child has ever been breastfed in the past. To further examine the effects of breastfeeding in different age groups and the impacts of extended breastfeeding, separate logistic regression analyses have been performed for breastfeeding in children above and below the age of 12 months.
Caregiving ability
Both the physical and emotional caregiving data of mothers were collected, which were merged to create physical and emotional caregiving scores. The Cronbach's alpha values for physical and emotional caregiving variables were 0.665 and 0.506 respectively. Physical caregiving ability was determined by the level of physical abuse / punishment and emotional caregiving ability was determined by levels of shouting and verbal abuse. Emotional caregiving includes factors such as whether mothers yelled at children or called them stupid, while physical caregiving describes the body part and mechanism by which children were hit by their mothers.
Inequalities
Inequalities included wealth index, health insurance status, liquid and supplement intake, mother’s education level, and whether the household was in a rural or urban area. Wealth index tercile measurement produced three groups ranging from lowest wealth to highest. Liquid intake included whether children drank various types of liquids yesterday such as oral rehydration solution (ORS), supplements, and plain water. Mother’s education was recorded as three groups: First is attended primary school or no education, second is attended secondary school and third is attended high school or above.
Statistical analysis
Data from the 25 countries were merged into one SPSS file while ensuring that the variables obtained in different countries are comparable. Only variables that were present in the data files of all 25 countries were kept in this study. G*Power software was used to calculate the required sample size for the study. A priori power analysis was utilised with 5% type 1 error and power of 80%. The minimum two-tailed sample size required was calculated to be 22521 participants after adjusting for non-response rate, observational study design, and cluster sampling.
χ2 analyses were performed to compare the BMI distribution of children under five across the 25 low-income countries. The percentages of people in various BMI categories were obtained for each country. This allowed the identification of countries that are suffering the most from GF.
As all independent and dependent variables are categorical, χ2 analyses were performed to investigate the correlation of nutrition, breastfeeding, caregiving ability, and inequalities with GF.
Logistic regression analysis evaluated the prediction of growth failure by determinants when gender and age were controlled in the analysis. Outcome measures were recoded into dichotomous variables (stunted, wasted, underweight, BMI less than -2 standard deviation (SD)).
Given that the sample size is large and that there are three levels of data, multilevel analysis was performed to identify the impact that country, suburb, and household levels have on the variance of outcome variables. Multilevel models (MLM) can account for the inherent hierarchal structure of the data and contextual influences. STATA version 16.0 (StataCorp, College Station, TX) was purchased and used to conduct the multilevel analysis. A significance level of 0.05 was used and all analyses were performed on SPSS.
RESULTS
Overall, data was collected from 173 365 participants from 25 countries, with sample sizes per country ranging from 1329 in Montenegro to 24 686 in Bangladesh.
Prevalence of growth failure measures across countries
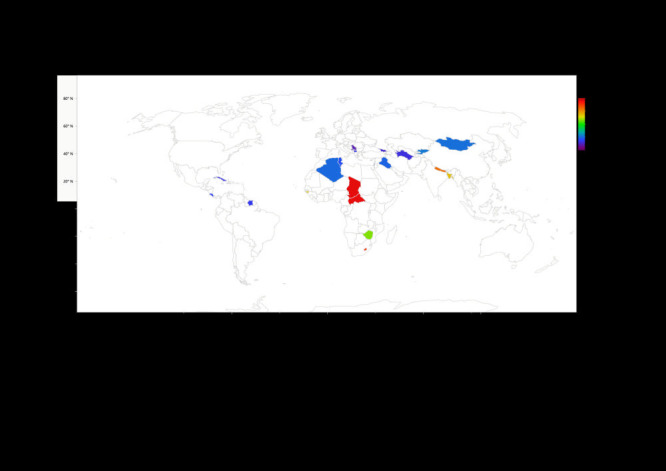
Table 1 shows the prevalence of the GF measures under consideration across the various countries. Overall, compared with low-income countries, upper-middle-income countries experienced significantly less (P < 0.001) stunting (6.47% vs. 31.8%), wasting (2.73% vs. 8.45%), underweight (2.72% vs. 20.98%) and low BMI (2.84% vs. 7.38%). Chad had the highest prevalence of all four GF factors studied in this paper. Chad had the highest prevalence of stunting (8253, 38.6%), closely followed by the Central African Republic (3309, 38.5%), and Lesotho (1113, 35.5%). The three countries with the highest prevalence of stunting are all from Africa. Apart from stunting, the two countries following Chad in all three of the other GF measures being studied were Nepal and Bangladesh in that order. This indicates a high prevalence of GF in the low-income countries of Asia. Tonga, Georgia, and Serbia had some of the lowest values for prevalence across the four measures being studied. Figure 1, Figure 2, Figure 3 and Figure 4 provide visual maps showcasing the distribution of GF measures across the 25 LMICs.
Table 1.
Prevalence of growth failure measures across countries
| Country / income category | Stunted n (%) |
Country / income category | Wasted n (%) |
Country / income category | Underweight n (%) |
Country / income category | BMI<-2 SD n (%) |
||||
|---|---|---|---|---|---|---|---|---|---|---|---|
| Low |
15 622 |
(31.80%) |
Low |
5013 |
(8.45%) |
Low |
11 420 |
(20.98%) |
Low |
4413 |
(7.38%) |
| Low middle |
14 386 |
(18.50%) |
Low middle |
4050 |
(4.09%) |
Low middle |
8689 |
(8.56%) |
Low middle |
3691 |
(3.74%) |
| Upper middle |
3258 |
(6.47%) |
Upper middle |
1186 |
(2.73%) |
Upper middle |
1291 |
(2.72%) |
Upper middle |
1242 |
(2.84%) |
|
Low-income countries
| |||||||||||
| Chad |
8253 |
(38.6%) |
Chad |
3505 |
(16.5%) |
Chad |
6917 |
(32.0%) |
Chad |
3118 |
(14.7%) |
| Central African Republic |
3309 |
(38.5%) |
The Gambia |
661 |
(6.8%) |
Central African Republic |
1836 |
(21.0%) |
The Gambia |
568 |
(5.8%) |
| Guinea Bissau |
2013 |
(27.3%) |
Central African Republic |
486 |
(5.6%) |
The Gambia |
1520 |
(15.5%) |
Central African Republic |
407 |
(4.7%) |
| The Gambia |
2047 |
(21.1%) |
Guinea Bissau |
361 |
(4.9%) |
Guinea Bissau |
1147 |
(15.4%) |
Guinea Bissau |
320 |
(4.3%) |
|
Low middle-income countries
| |||||||||||
| Lesotho |
1113 |
(35.5%) |
Nepal |
792 |
(12.2%) |
Nepal |
1639 |
(24.8%) |
Nepal |
672 |
(10.3%) |
| Nepal |
2112 |
(32.6%) |
Bangladesh |
2219 |
(10.1%) |
Bangladesh |
5185 |
(23.1%) |
Bangladesh |
1992 |
(9.0%) |
| Bangladesh |
6174 |
(27.9%) |
Kiribati |
76 |
(3.5%) |
Lesotho |
329 |
(10.4%) |
Kiribati |
74 |
(3.5%) |
| Zimbabwe |
1401 |
(23.5%) |
Algeria |
418 |
(3.0%) |
Zimbabwe |
581 |
(9.7%) |
Algeria |
443 |
(3.2%) |
| Kiribati |
334 |
(15.7%) |
Zimbabwe |
176 |
(3.0%) |
Kiribati |
153 |
(7.1%) |
Tunisia |
75 |
(2.3%) |
| Kyrgyz Republic |
384 |
(11.2%) |
Lesotho |
68 |
(2.2%) |
Algeria |
441 |
(3.1%) |
Zimbabwe |
140 |
(2.3%) |
| Mongolia |
633 |
(10.7%) |
Tunisia |
68 |
(2.1%) |
State of Palestine |
127 |
(2.2%) |
Kyrgyz Republic |
72 |
(2.1%) |
| Algeria |
1441 |
(10.3%) |
Kyrgyz Republic |
70 |
(2.0%) |
Mongolia |
126 |
(2.1%) |
Lesotho |
57 |
(1.8%) |
| State of Palestine |
503 |
(8.8%) |
State of Palestine |
85 |
(1.5%) |
Tunisia |
55 |
(1.6%) |
State of Palestine |
95 |
(1.7%) |
| Tunisia |
291 |
(8.8%) |
Mongolia |
78 |
(1.3%) |
Kyrgyz Republic |
53 |
(1.5%) |
Mongolia |
71 |
(1.2%) |
|
Upper middle-income countries
| |||||||||||
| Iraq |
1640 |
(10.0%) |
Suriname |
207 |
(6.1%) |
Suriname |
235 |
(6.7%) |
Suriname |
202 |
(6.0%) |
| Costa Rica |
252 |
(7.9%) |
Turkmenistan |
145 |
(4.0%) |
Kosovo |
72 |
(3.7%) |
Turkmenistan |
182 |
(5.0%) |
| Kosovo |
139 |
(7.4%) |
Republic of North Macedonia |
58 |
(3.1%) |
Costa Rica |
103 |
(3.2%) |
Republic of North Macedonia |
60 |
(3.2%) |
| Suriname |
247 |
(7.3%) |
Iraq |
457 |
(2.8%) |
Iraq |
529 |
(3.2%) |
Serbia |
34 |
(2.9%) |
| Cuba |
366 |
(7.0%) |
Montenegro |
20 |
(2.6%) |
Turkmenistan |
103 |
(2.8%) |
Iraq |
479 |
(2.9%) |
| Republic of North Macedonia |
127 |
(6.8%) |
Kosovo |
48 |
(2.6%) |
Republic of North Macedonia |
48 |
(2.5%) |
Kosovo |
50 |
(2.7%) |
| Turkmenistan |
236 |
(6.5%) |
Serbia |
29 |
(2.5%) |
Cuba |
123 |
(2.3%) |
Cuba |
137 |
(2.6%) |
| Georgia |
118 |
(5.8%) |
Cuba |
130 |
(2.5%) |
Georgia |
38 |
(1.8%) |
Montenegro |
17 |
(2.2%) |
| Montenegro |
38 |
(4.8%) |
Costa Rica |
66 |
(2.1%) |
Montenegro |
13 |
(1.6%) |
Tonga |
20 |
(1.6%) |
| Serbia |
55 |
(4.6%) |
Tonga |
16 |
(1.2%) |
Tonga |
16 |
(1.2%) |
Costa Rica |
50 |
(1.6%) |
| Tonga |
40 |
(3.1%) |
Georgia |
10 |
(0.5%) |
Serbia |
11 |
(0.9%) |
Georgia |
11 |
(0.5%) |
|
Total
|
33266 |
(20.8%) |
Total |
10249 |
(6.4%) |
Total |
21400 |
(13.2%) |
Total |
9346 |
(5.9%) |
| Chi Square (χ2) | 14072.871* |
Chi Square (χ2) | 6627.020* |
Chi Square (χ2) | 17104.816* | Chi Square (χ2) |
5378.702* |
||||
BMI – body mass index, SD – standard deviation
*P < 0.001
Figure 1.
Percentage of stunted children across 25 low- and middle-income countries (LMICs).
Figure 2.

Percentage of wasted children across 25 low- and middle-income countries (LMICs).
Figure 3.

Percentage of underweight children across 25 low- and middle-income countries (LMICs).
Figure 4.

Percentage of children with low body mass index (BMI) (below -2 standard deviation (SD)) across 25 low- and middle-income countries (LMICs).
Prevalence of key growth failure determinants across countries
Table 2 shows the prevalence of low maternal education, no health insurance, no carbohydrate consumption, and no plain water consumption across the various countries. Overall, compared with upper-middle-income countries, low-income countries had more mothers with only primary or no education (86.3% vs. 46.6%), more households with no health insurance (99.5% vs. 57.7%), and more children who did not consume carbohydrates (49.2% vs. 29.3%) and plain water (23.2% vs. 16.0%) yesterday. These results were all statistically significant with a P < 0.001. Chad, Central African Republic, and Guinea Bissau had the highest prevalence of unfavourable determinants. Overall, these results indicate that countries with higher incomes generally had better determinant measures which can potentially improve the health of children.
Table 2.
Prevalence of key growth failure determinants across countries
| Country / income category | Mother’s education – primary or none n (%) |
Country / income category | Without health insurance n (%) |
Country / income category | No carbohydrate consumption yesterday n (%) |
Country / income category | No plain water consumption yesterday n (%) |
||||
|---|---|---|---|---|---|---|---|---|---|---|---|
| Low |
41 658 |
(86.3%) |
Low |
47 791 |
(99.5%) |
Low |
9371 |
(49.2%) |
Low |
4682 |
(23.2%) |
| Low middle |
20 255 |
(33.1%) |
Low middle |
22 304 |
(59.8%) |
Low middle |
9506 |
(29.6%) |
Low middle |
8220 |
(28.2%) |
| Upper middle |
19 431 |
(46.6%) |
Upper middle |
22 124 |
(57.7%) |
Upper middle |
4890 |
(29.3%) |
Upper middle |
2663 |
(16.0%) |
|
Low-income countries
| |||||||||||
| Guinea Bissau |
7058 |
(94.3%) |
Chad |
21 730 |
(99.8%) |
Chad |
6917 |
(32.0%) |
Chad |
3118 |
(14.7%) |
| Chad |
19 705 |
(90.1%) |
Central African Republic |
8849 |
(99.4%) |
Central African Republic |
18 36 |
(21.0%) |
The Gambia |
568 |
(5.8%) |
| Central African Republic |
7262 |
(80.4%) |
Guinea Bissau |
7412 |
(99.3%) |
The Gambia |
1520 |
(15.5%) |
Central African Republic |
407 |
(4.7%) |
| The Gambia |
7633 |
(77.2%) |
The Gambia |
9800 |
(99.0%) |
Guinea Bissau |
1147 |
(15.4%) |
Guinea Bissau |
320 |
(4.3%) |
|
Low middle-income countries
| |||||||||||
| Lesotho |
1659 |
(51.0%) |
Nepal |
6361 |
(95.6%) |
Nepal |
1639 |
(24.8%) |
Nepal |
672 |
(10.3%) |
| Tunisia |
1105 |
(44.6%) |
Zimbabwe |
5739 |
(94.1%) |
Bangladesh |
5185 |
(23.1%) |
Bangladesh |
1992 |
(9.0%) |
| Algeria |
4823 |
(37.7%) |
Algeria |
7803 |
(52.6%) |
Lesotho |
329 |
(10.4%) |
Kiribati |
74 |
(3.5%) |
| Bangladesh |
8543 |
(34.6%) |
Palestine |
1825 |
(28.8%) |
Zimbabwe |
581 |
(9.7%) |
Algeria |
443 |
(3.2%) |
| Zimbabwe |
2063 |
(33.8%) |
Tunisia |
576 |
(16.9%) |
Kiribati |
153 |
(7.1%) |
Tunisia |
75 |
(2.3%) |
| Mongolia |
337 |
(20.9%) |
|
|
|
Algeria |
441 |
(3.1%) |
Zimbabwe |
140 |
(2.3%) |
| Kiribati |
448 |
(20.5%) |
|
|
|
State of Palestine |
127 |
(2.2%) |
Kyrgyz Republic |
72 |
(2.1%) |
| State of Palestine |
1269 |
(19.8%) |
|
|
|
Mongolia |
126 |
(2.1%) |
Lesotho |
57 |
(1.8%) |
| Kyrgyz Republic |
8 |
(0.5%) |
|
|
|
Tunisia |
55 |
(1.6%) |
State of Palestine |
95 |
(1.7%) |
|
|
|
|
|
|
|
Kyrgyz Republic |
53 |
(1.5%) |
Mongolia |
71 |
(1.2%) |
|
Upper middle-income countries
| |||||||||||
| Turkmenistan |
2989 |
(85.2%) |
Iraq |
16 522 |
(99.4%) |
Suriname |
235 |
(6.7%) |
Suriname |
202 |
(6.0%) |
| Iraq |
10 952 |
(65.9%) |
Kosovo |
2182 |
(96.0%) |
Kosovo |
72 |
(3.7%) |
Turkmenistan |
182 |
(5.0%) |
| Montenegro |
741 |
(64.9%) |
Turkmenistan |
2099 |
(57.0%) |
Costa Rica |
103 |
(3.2%) |
Republic of North Macedonia |
60 |
(3.2%) |
| Kosovo |
1324 |
(64.8%) |
Tonga |
248 |
(18.4%) |
Iraq |
529 |
(3.2%) |
Serbia |
34 |
(2.9%) |
| Republic of North Macedonia |
904 |
(39.9%) |
Suriname |
495 |
(11.7%) |
Turkmenistan |
103 |
(2.8%) |
Iraq |
479 |
(2.9%) |
| Suriname |
1011 |
(27.3%) |
Costa Rica |
351 |
(9.7%) |
Republic of North Macedonia |
48 |
(2.5%) |
Kosovo |
50 |
(2.7%) |
| Costa Rica |
943 |
(26.1%) |
Republic of North Macedonia |
114 |
(5.2%) |
Cuba |
123 |
(2.3%) |
Cuba |
137 |
(2.6%) |
| Georgia |
287 |
(18.5%) |
Georgia |
89 |
(3.5%) |
Georgia |
38 |
(1.8%) |
Montenegro |
17 |
(2.2%) |
| Serbia |
175 |
(8.9%) |
Serbia |
24 |
(1.3%) |
Montenegro |
13 |
(1.6%) |
Tonga |
20 |
(1.6%) |
| Tonga |
36 |
(2.6%) |
|
|
|
Tonga |
16 |
(1.2%) |
Costa Rica |
50 |
(1.6%) |
| Cuba |
69 |
(1.8%) |
|
|
|
Serbia |
11 |
(0.9%) |
Georgia |
11 |
(0.5%) |
|
Total
|
81 344 |
(53.8%) |
Total |
92 219 |
(74.6%) |
Total |
21 400 |
(13.2%) |
Total |
9346 |
(5.9%) |
| Chi Square (χ2) | 68187.371* |
Chi Square (χ2) | 78318.305* |
Chi Square (χ2) | 17104.816* | Chi Square (χ2) |
5378.702* |
||||
*P < 0.001.
Correlations of determinants with growth failure
Table 3 presents correlations of child and family characteristics with stunting, wasting, underweight, and BMI less than 2SD. All GF measures were significantly (P < 0.05) more prevalent for boys, the poorest wealth quintile, no health insurance, and rural areas. Overall, most GF measures were increased in groups that consumed less food, including those who on the previous day did not eat grains or roots, protein, yellow or orange vegetables and vitamin A-rich fruits. However, those who ate green leafy vegetables yesterday had significantly (P < 0.05) increased levels of stunting, wasting, and being underweight. Children who have ever been breastfed in the past were significantly (P < 0.05) less stunted and underweight, while those older than 12 months who are still currently being breastfed had significantly (P < 0.05) higher rates of wasting, underweight, and low BMI. The age group with the most stunted and underweight children was the 2-3 years old group, while the 0-1 group had the most wasted and low BMI children. Mothers who had the lowest education (primary or none), poor physical caregiving ability and did not explain to the children why their behaviour was wrong had significantly (P < 0.05) increased levels of all GF measures.
Table 3.
Associations of determinants with growth failure
| Variable | Stunted n (%) | Not stunted n (%) | Wasted n (%) | Not wasted n (%) | Underweight n (%) | Not underweight n (%) | BMI≤-2 SD n (%) | -1.99 SD to normal BMI n (%) |
|---|---|---|---|---|---|---|---|---|
|
Sex
| ||||||||
| Male |
17 654* (21.6%) |
64 185 (78.4%) |
5680* (7.0%) |
76 038 (93.0%) |
11 397* (13.7%) |
71 563 (86.3%) |
5023* (6.2%) |
76 613 (93.8%) |
| Female |
15 612 (20.0%) |
62 626 (80.0%) |
4569 (5.9%) |
73 501 (94.1%) |
10 003 (12.6%) |
69 192 (87.4%) |
4323 (5.5%) |
73 737 (94.5%) |
|
Age of child
| ||||||||
| 0-1 |
3751* (12.5%) |
26 171 (87.5%) |
2581* (8.6%) |
27 268 (91.4%) |
3347* (11.0%) |
27 217 (89.0%) |
2811* (9.4%) |
27 233 (90.6%) |
| 1-2 |
6978 (22.9%) |
23 528 (77.1%) |
2177 (7.1%) |
28 402 (92.9%) |
4178 (13.5%) |
26 882 (86.5%) |
1789 (5.9%) |
28 696 (94.1%) |
| 2-3 |
8422 (26.4%) |
23426 (73.6%) |
1865 (5.9%) |
29910 (94.1%) |
4857 (15.0%) |
27 514 (85.0%) |
1574 (5.0%) |
30 114 (95.0%) |
| 3-4 |
7870 (23.0%) |
26366 (77.0%) |
1739 (5.1%) |
32398 (94.9%) |
4633 (13.4%) |
29 834 (86.6%) |
1516 (4.5%) |
32 517 (95.5%) |
| 4-5 |
6245 (18.6%) |
27320 (81.4%) |
1887 (5.6%) |
31561 (94.4%) |
4385 (13.0%) |
29 308 (87.0%) |
1656 (5.0%) |
31 790 (95.0%) |
|
Wealth index tercile
| ||||||||
| Poorest |
18 324* (23.9%) |
58 191 (76.1%) |
5246* (6.9%) |
71 191 (93.1%) |
5492* (10.4%) |
47 408 (89.6%) |
2907* (5.6%) |
49 087 (94.4%) |
| Middle |
6358 (20.2%) |
25 060 (79.8%) |
1932 (6.2%) |
29 416 (93.8%) |
4095 (12.9%) |
27 714 (87.1%) |
1763 (5.6%) |
29 576 (94.4%) |
| Richest |
8584 (16.5%) |
43 560 (83.5%) |
3071 (5.9%) |
48 932 (94.1%) |
11 823 (15.3%) |
65 633 (84.7%) |
4676 (6.1%) |
71 687 (93.9%) |
|
Health insurance
| ||||||||
| Without |
22 019* (24.7%) |
67 296 (75.3%) |
6802* (7.6%) |
82 429 (92.4%) |
14 526* (16.1%) |
75 806 (83.9%) |
6089* (6.8%) |
83 073 (93.2%) |
| With |
2168 (7.8%) |
25 678 (92.2%) |
775 (2.8%) |
26 960 (97.2%) |
864 (3.0%) |
27 519 (97.0%) |
827 (3.0%) |
26 867 (97.0%) |
|
Mother’s education
| ||||||||
| Primary or none |
20 988* (27.0%) |
56 692 (73.0%) |
6295* (8.1%) |
71 303 (91.9%) |
14 164* (18.0%) |
64 327 (82.0%) |
5629* (7.3%) |
71 888 (92.7%) |
| Secondary |
6753 (17.7%) |
31 344 (82.3%) |
2086 (5.5%) |
35 937 (94.5%) |
4253 (11.0%) |
34 429 (89.0%) |
1930 (5.1%) |
36 078 (94.9%) |
| Higher |
2471 (9.7%) |
23 043 (90.3%) |
824 (3.2%) |
24 593 (96.8%) |
1092 (4.2%) |
24 797 (95.8%) |
854 (3.4%) |
24 564 (96.6%) |
|
Area
| ||||||||
| Rural |
23 997* (25.5%) |
69 960 (74.5%) |
7111* (7.6%) |
86 753 (92.4%) |
16 040* (16.9%) |
79 043 (83.1%) |
6327* (6.7%) |
87 488 (93.3%) |
| Urban |
9143 (14.1%) |
55 622 (85.9%) |
3115 (4.8%) |
61 468 (95.2%) |
5317 (8.1%) |
60 378 (91.9%) |
2992 (4.6%) |
61 550 (95.4%) |
|
Child drank plain water yesterday
| ||||||||
| No |
2640* (17.9%) |
12 116 (82.1%) |
1371* (9.3%) |
13 319 (90.7%) |
2093* (13.9%) |
12 996 (86.1%) |
1376* (9.3%) |
13 439 (90.7%) |
| Yes |
9094 (18.9%) |
38 914 (81.1%) |
3636 (7.6%) |
44 442 (92.4%) |
6091 (12.5%) |
42 795 (87.5%) |
3416 (7.1%) |
44 636 (92.9%) |
|
Child drank any other liquid yesterday
| ||||||||
| No |
10 124* (18.5%) |
44 597 (81.5%) |
4371 (8.0%) |
50 350 (92.0%) |
7100 (12.7%) |
48 691 (87.3%) |
4191 (7.6%) |
50 641 (92.4%) |
| Yes |
1593 (20.1%) |
6336 (79.9%) |
624 (7.9%) |
7304 (92.1%) |
1072 (13.3%) |
6994 (86.7%) |
584 (7.4%) |
7330 (92.6%) |
|
Physical caregiving
| ||||||||
| Poor (score 3 and below) |
7688* (25.6%) |
22 293 (74.4%) |
1903* (6.4%) |
27 993 (93.6%) |
4883* (16.2%) |
25 342 (83.8%) |
1598* (5.4%) |
28 256 (94.6%) |
| Middle (score 4 to 5) |
11 949* (22.5%) |
41 130 (77.5%) |
3014 (5.7%) |
49 955 (94.3%) |
7278 (13.6%) |
46 302 (86.4%) |
2598 (4.9%) |
50 249 (95.1%) |
| Good (score 6) |
9657* (20.9%) |
36 600(79.1%) |
2694 (5.8%) |
43 542 (94.2%) |
5750 (12.2%) |
41 190 (87.8%) |
2289 (5.0%) |
43 824 (95.0%) |
|
Explained why behaviour was wrong
| ||||||||
| No |
10 119* (27.3%) |
26 883 (72.7%) |
2777* (7.5%) |
34 220 (92.5%) |
6451 *(17.2%) |
31 043 (82.8%) |
2284* (6.2%) |
34 622 (93.8%) |
| Yes |
19 355 (20.8%) |
73 644 (79.2%) |
4877 (5.3%) |
87 912 (94.7%) |
11 578 (12.3%) |
82 363 (87.7%) |
4237 (4.6%) |
88 356 (95.4%) |
|
Carbohydrate consumption yesterday
| ||||||||
| Ate none |
3860* (17.2%) |
18 633 (82.8%) |
2249* (10.1%) |
20 112 (89.9%) |
3242* (14.1%) |
19 736 (85.9%) |
2333* (10.3%) |
20 216 (89.7%) |
| Ate one of grains or roots |
4714 (19.9%) |
18 992 (80.1%) |
1680 (7.1%) |
22 095 (92.9%) |
2986 (12.4%) |
21 104 (87.6%) |
1489 (6.3%) |
22 221 (93.7%) |
| Ate both grains and roots |
2920 (16.1%) |
15 229 (83.9%) |
940 (5.2%) |
17 267 (94.8%) |
1607 (8.7%) |
16 915 (91.3%) |
887 (4.9%) |
17 288 (95.1%) |
|
Child ate green leafy vegetables yesterday
| ||||||||
| No |
8555* (16.6%) |
42 872 (83.4%) |
3826* (7.4%) |
47 550 (92.6%) |
5926* (11.3%) |
46 507 (88.7%) |
3771 (7.3%) |
47 732 (92.7%) |
| Yes |
2949 (22.7%) |
10 026 (77.3%) |
1049 (8.1%) |
11 973 (91.9%) |
1921 (14.5%) |
11 292 (85.5%) |
942 (7.3%) |
12 044 (92.7%) |
|
Child ever been breastfed
| ||||||||
| No |
1756* (23.7%) |
5652 (76.3%) |
510 (6.9%) |
6892 (93.1%) |
1079* (14.3%) |
6479 (85.7%) |
459 (6.2%) |
6930 (93.8%) |
| Yes |
17 367 (20.5%) |
67 326 (79.5%) |
6107 (7.2%) |
78 521 (92.8%) |
11 292 (13.1%) |
74 969 (86.9%) |
5710 (6.7%) |
78 947 (93.3%) |
|
Child still being breastfed
| ||||||||
| No |
7370 (20.7%) |
28 212 (79.3%) |
1612* (4.5%) |
33 920 (95.5%) |
3658* (10.1%) |
32 511 (89.9%) |
1472* (4.2%) |
33 977 (95.8%) |
| Yes | 9991 (20.4%) | 39 088 (79.6%) | 4491 (9.2%) | 44 573 (90.8%) | 7630 (15.2%) | 42 429 (84.8%) | 4234 (8.6%) | 44 942 (91.4%) |
BMI – body mass index, SD – standard deviation
*Indicates significant χ2 result (P < 0.05) for the variable.
We also investigated several variables which were not significantly correlated with any GF outcomes in the Table 4 logistic regression analysis and were not displayed in both Table 3 and Table 4 to ensure clarity. These variables included the consumption of ORS, vitamin or mineral supplements, proteins such as eggs, meat and dairy, vegetables such as pumpkin, carrots squash etc. that are yellow or orange inside yesterday, ripe mangoes, papayas etc. any other vitamin A-rich fruits, infant formula, fortified baby food and mother's emotional caregiving ability.
Table 4.
Prediction of growth failure by determinants when gender and age are controlled in the analysis
| Variables | OR (95% CI) stunting (HAZ<-2 SD) |
OR (95% CI) wasting (WHZ<-2 SD) |
OR (95% CI) underweight (WAZ<-2 SD) |
OR (95% CI) BMI<-2 SD |
||||
|---|---|---|---|---|---|---|---|---|
|
GDP per capita
| ||||||||
| 4391.34 and above |
1 |
|
1 |
|
1 |
|
1 |
|
| 1855.75 to 4391.33 |
1.472* |
(1.171-1.851) |
0.736 |
(0.419-1.292) |
1.181 |
(0.725-1.925) |
0.671 |
(0.406-1.106) |
| 777.82 to 1855.74 |
4.217* |
(3.080-5.773) |
1.321 |
(0.642-2.719) |
7.534* |
(3.995-14.209) |
0.942 |
(0.468-1.898) |
| 777.81 and below |
4.376* |
(3.316-5.775) |
3.084* |
(1.602-5.939) |
13.391* |
(7.324-24.484) |
2.482† |
(1.365-4.513) |
|
Continent
| ||||||||
| Asia |
1 |
|
1 |
|
1 |
|
1 |
|
| Europe |
0.725‡ |
(0.542-0.970) |
1.167 |
(0.644-2.114) |
1.104 |
(0.637-1.912) |
0.919 |
(0.535-1.577) |
| Americas |
1.272 |
(0.964-1.679) |
3.584* |
(2.279-5.636) |
3.803* |
(2.480-5.832) |
1.816† |
(1.163-2.837) |
| Africa |
0.806 |
(0.630-1.032) |
1.705 |
(0.922-3.153) |
0.791 |
(0.447-1.397) |
1.230 |
(0.707-2.138) |
|
Area
| ||||||||
| Urban |
1 |
|
1 |
|
1 |
|
1 |
|
| Rural |
1.253* |
(1.136-1.383) |
1.270† |
(1.074-1.502) |
1.475* |
(1.289-1.688) |
1.223‡ |
(1.025-1.459) |
|
Wealth tercile
| ||||||||
| Richest |
1 |
|
1 |
|
1 |
|
1 |
|
| Middle |
1.124‡ |
(1.003-1.259) |
0.863 |
(0.696-1.005) |
0.942 |
(0.800-1.067) |
0.881 |
(0.725-1.071) |
| Poorest |
1.182† |
(1.068-1.307) |
0.923 |
(0.787-1.082) |
1.057 |
(0.932-1.199) |
0.896 |
(0.755-1.063) |
|
Health insurance
| ||||||||
| Yes |
1 |
|
1 |
|
1 |
|
1 |
|
| No |
1.213† |
(1.028-1.430) |
1.264 |
(0.906-1.763) |
1.474‡ |
(1.077-2.016) |
0.959 |
(0.699-1.317) |
|
Mother's education
| ||||||||
| Higher |
1 |
|
1 |
|
1 |
|
1 |
|
| Secondary |
1.152 |
(0.964-1.378) |
0.976 |
(0.705-1.350) |
1.540† |
(1.107-2.141) |
0.968 |
(0.705-1.328) |
| Primary or none |
1.598* |
(1.343-1.902) |
1.421‡ |
(1.036-1.951) |
2.260* |
(1.633-3.129) |
1.358 |
(1.000-1.844) |
|
Child drank plain water yesterday
| ||||||||
| Yes |
1 |
|
1 |
|
1 |
|
1 |
|
| No |
1.113 |
(0.986-1.257) |
1.297† |
(1.089-1.545) |
1.313* |
(1.144-1.507) |
1.402* |
(1.163-1.690) |
|
Child drank any other liquid yesterday
| ||||||||
| Yes |
1 |
|
1 |
|
1 |
|
1 |
|
| No |
0.957 |
(0.867-1.057) |
0.829‡ |
(0.710-0.967) |
0.824† |
(0.730-0.929) |
0.886 |
(0.749-1.047) |
|
Physical caregiving
|
1.004 |
(0.970-1.040) |
1.086† |
(1.024-1.151) |
1.104* |
(1.056-1.154) |
1.110† |
(1.040-1.184) |
|
Explained why behaviour was wrong
| ||||||||
| Yes |
1 |
|
1 |
|
1 |
|
1 |
|
| No |
1.132† |
(1.044-1.228) |
1.164‡ |
(1.023-1.324) |
1.204* |
(1.089-1.330) |
1.143 |
(0.994-1.314) |
|
Carbohydrate consumption
| ||||||||
| Ate both grains and roots |
1 |
|
1 |
|
1 |
|
1 |
|
| Ate one |
1.037 |
(0.940-1.144) |
0.994 |
(0.838-1.179) |
1.057 |
(0.926-1.208) |
0.955 |
(0.797-1.144) |
| Ate none |
1.320* |
(1.164-1.497) |
1.334† |
(1.092-1.630) |
1.401* |
(1.197-1.640) |
1.470* |
(1.187-1.821) |
|
Child ate green leafy vegetables yesterday
| ||||||||
| Yes |
1 |
|
1 |
|
1 |
|
1 |
|
| No |
0.849* |
(0.780-0.924) |
0.961 |
(0.841-1.098) |
0.910 |
(0.821-1.009) |
0.938 |
(0.811-1.085) |
|
Child still being breastfed (age over 12 months)
| ||||||||
| Yes |
1 |
|
1 |
|
1 |
|
1 |
|
| No |
0.908‡ |
(0.832-0.992) |
0.777* |
(0.669-0.903) |
0.784* |
(0.698-0.880) |
0.802† |
(0.684-0.941) |
|
Child still being breastfed (age under 12 months)
| ||||||||
| Yes |
1 |
|
1 |
|
1 |
|
1 |
|
| No |
0.704 |
(0.431-1.150) |
1.142 |
(0.620-2.104) |
0.964 |
(0.526-1.767) |
0.892 |
(0.489-1.625) |
|
Sex
| ||||||||
| Female |
1 |
|
1 |
|
1 |
|
1 |
|
| Male |
1.340* |
(1.245-1.442) |
1.372* |
(1.218-1.545) |
1.455* |
(1.328-1.594) |
1.358* |
(1.193-1.545) |
|
Increasing age of child
|
1.216‡ |
(1.045-1.415) |
0.510* |
(0.378-0.689) |
0.923 |
(0.766-1.112) |
0.529* |
(0.377-0.742) |
|
ICC
| ||||||||
| Country |
14.0%* |
(8.5%-22.1%) |
|
|
20.7%* |
(13.0%-31.2%) |
11.6%* |
(6.9%-18.9%) |
| Region |
18.8%* |
(13.3%-26.0%) |
|
|
25.3%* |
(17.7%-34.8%) |
20.0%* |
(15.1%-25.9%) |
| Household |
29.2%* |
(24.0%-35.0%) |
|
|
36.7%* |
(29.8%-44.3%) |
32.7%* |
(27.9%-37.9%) |
|
Χ2
|
2061.705* |
945.983* |
2664.153* |
613.569* |
||||
| R2 | 16.3% |
12.9% |
24.6% |
9.4% |
||||
OR – odds ratio, CI – confidence interval, HAZ – height-for-age-z score, SD – standard deviation, WHZ – weight-for-length / height z-score, WAZ – weight-for-age-z score, BMI – body mass index, GDP – gross domestic product
*P < 0.001.
†P < 0.01.
‡P < 0.05.
Figure 5, panel A, panel B and panel C, showcases the proportion of low BMI (less than -2 SD) among subgroups of key determinants. It demonstrates that children of mothers with primary or no education, children who consumed fewer carbohydrates and those living in rural areas had a higher prevalence of low BMI.
Figure 5.

Panel A. Proportion of low body mass index (BMI) (below -2 standard deviation (SD)) among children with varying levels of carbohydrate consumption yesterday. Panel B. Proportion of low BMI (below -2 SD) among children of mothers with varying levels of education. Panel C. Proportion of low BMI (below -2 SD) among rural and urban residence.
Prediction of growth failure by determinants when gender and age are controlled in the analysis
Logistic regression analysis in Table 4 demonstrated that GDP per capita was the strongest determinant of GF. Compared to the group with a GDP of 4391.34 and above per capita, stunting, wasting, underweight and BMI<-2 SD were 4.376, 3.084, 13.391 and 2.482 times respectively as likely to occur in the group with a GDP of 777.81 and below per capita (P < 0.001). All GF measures were more likely to occur in rural children compared to their urban counterparts with P < 0.05. Children who did not eat grains or roots yesterday were 1.320, 1.334, 1.401 and 1.470 times as likely to be stunted, wasted, underweight and have BMI<-2 SD respectively. Compared to children whose mothers attained higher education, children whose mothers attained primary or no education were significantly more likely to be underweight (P < 0.001), wasted (P < 0.05) and stunted (P < 0.001). All GF measures were significantly more likely to occur in boys (P < 0.001). Children who did not drink plain water yesterday and poor maternal physical caregiving ability were correlated with more wasting, being underweight, and BMI<-2 SD. Additionally, children without health insurance were significantly more likely to be stunted (P < 0.01) and underweight (P < 0.05).
All GF measures were significantly more likely to occur in children over 12 months old who were still being breastfed (P < 0.05), while there were insignificant results for children under 12 months. Children who ate green leafy vegetables yesterday were also more likely to be stunted (P < 0.001). Wealth tercile was not correlated with GF except children from middle-income (P < 0.05) and the poorest households (P < 0.01) were significantly more likely to be stunted than those from the wealthiest tercile within the same country. Increasing age was correlated with more stunting (P < 0.05) but decreased wasting (P < 0.001) and low BMI (P < 0.001). Meanwhile, protein consumption, ORS consumption, vitamin or mineral supplementation, maternal emotional caregiving ability, vegetable and fruit intake, infant formula, and fortified baby food all had little to no impact on GF.
As it is shown in Table 4, children in American countries (including Costa Rica and Cuba from North America, and Suriname from South America) were significantly more likely to be wasted (P < 0.001), underweight (P < 0.001), and have BMI<-2 SD (P < 0.01). Overall, the variables explained 16.3%, 9.4%, 24.6% and 12.9% of the total variance in stunting, BMI<-2 SD, underweight and wasting respectively.
DISCUSSION
The four GF measures, including stunting, wasting, underweight, and BMI less than 2SD, were positively correlated with several determinants in this study. GDP per capita showed an inverse relationship with all GF measures, consistent with the impact of socioeconomic status on health [23]. Poverty can limit access to health care, contributing to increased morbidity and mortality [23]. Notably, our results show that children within the lowest GDP per capita subcategory are 13.39 times more likely to be underweight than those in the highest subcategory. This is supported by Table 1, which demonstrates substantially decreased GF measures in upper-middle and low-middle-income countries compared to low-income countries. Moreover, Table 2 demonstrates that countries with higher incomes had better determinant measures, which may contribute to the decreased GF seen. However, more evidence is needed to confirm these findings due to limited representation from North and South America in this study, with only three countries in total.
In terms of regional variables, the incidence of all GF constituents was higher in rural children. Living in rural areas has been linked to limited access to health care services, a higher burden of preventable conditions, poorer financial status, lower health literacy, as well as unhealthy lifestyles such as lower levels of physical exercise and less balanced, nutritious diets [24]. Whether from their physical environment, socioeconomic status, or other social factors, rural residents are at an increased risk of adverse health outcomes [24].
Unlike factors at the country and region level, individual household factors can exert direct effects on the health and growth of children. Malnutrition is a well-established cause of GF [25]. In this study, carbohydrate consumption reduced all measures of GF. Depletion of energy stores due to a lack of sufficient carbohydrate intake can lead to GF [26]. Carbohydrate intake has been strongly linked to the growth of children, whereas the role of protein supplements in growth was shown to be inconsistent in some studies [27], which may account for the insignificant relationship between protein consumption and GF outcomes in our study. More evidence is needed to conclude the relative effectiveness of proteins and carbohydrates in preventing growth failure.
Parental factors contribute significantly to the development of GF [28]. Our study demonstrated that low maternal education levels and increased physical punishment of children were significantly correlated with GF. Higher maternal education contributed to better socioeconomic status [28] and adherence to feeding guidelines [29]. Inadequate care and family violence are increasingly recognized problems in LMICs [30]. Children from these families are more sensitive to detriments to nutrition as well as future unhealthy behaviours [30].
Our analyses also showed that breastfeeding beyond 12 months was associated with higher GF rates. Breastfeeding is correlated with numerous benefits and is therefore encouraged for newborns [31,32]. However, studies have underlined the importance of optimal breastfeeding duration and a timely introduction of a solid foods diet, as an overreliance on breastfeeding may compete with dietary diversity and lead to GF [33]. Plain water intake significantly reduced the rate of wasting, being underweight, and having low BMI. Lack of clean water access reflects lower socioeconomic status and health outcomes [34,35].
Surprisingly, the wealth index demonstrated no significant correlation with GF, except for stunting, where the poorest children are 1.18 times more likely to have stunting than the richest. Previous multi-country studies suggested moderate relationships between household wealth and GF, which may be partially explained by the differences in macroeconomic and health care systems across countries and the existence of local and national programs [36]. For example, the relationship between wealth and GF is relatively weaker in Kyrgyzstan due to investments in primary health care facilities and hospitals in disadvantaged areas [36]. Such differences may neutralize the impact of the wealth index on GF, as seen in our results. Health insurance was correlated with reduced stunting and underweight, likely due to improved access to treatment [37,38].
Data about the age and sex of children were included in the analysis as confounding factors. Boys were shown to have a significantly higher rate in all four components of GF than girls. Traditionally, social pressure focuses more on growth in boys than girls, and boys with growth abnormalities are more likely to be noticed by parents and evaluated by medical professionals [39]. A lower rate of GF would thus be expected in boys, as there is a tendency to provide more for boys in some countries [39]. However, the opposite relationship seen in our results may be explained by the differences in physiology between males and females. Males tend to have higher energy requirements than females [40,41], which can make them more prone to GF where there is limited food security and accessibility. In terms of age, older children have higher rates of stunting but lower rates of wasting and low BMI. The rate of height increase is positively correlated with age, peaking during puberty, where the velocity of height growth is around 9.5 cm (cm) per year for boys and 8.3 cm per year for girls [42]. As a result of the increasing growth speed, stunting can become prominent in older children [42]. Given that older children are more likely to develop stunting (low height for age), they are thus less likely to have wasting and low BMI since both measures are affected by height as the denominator.
Strengths of the study include a large sample size (173 365 children under five) across 25 LMICs and standardized data collection by UNICEF in 2019. Nevertheless, limitations exist in this study. First, as a cross-sectional study, inference can only be drawn on correlations instead of causality and change over time was not measured. Further studies using cohort study design or randomized controlled studies incorporating temporal data can be performed to track the progression of GF in various countries. Second, the independent variables in this study only account for about 16%, 13%, 25%, and 9% of the total variance in stunting, wasting, underweight, and low BMI, respectively. Other determinants of GF, such as father factors and the details of other siblings, can be included.
Data regarding the consumption of vegetables and fruits such as green leafy vegetables, pumpkins, and mangos, revealed little correlation with the development of GF. Despite the existence of some country-level heterogeneity, dietary diversity is shown by previous studies to have a protective effect against GF [43,44]. This is not in concordance with our results, which may be because the questions asked in this study only relate to the day before. Questionnaires can be modified to ask for long-term nutritional status instead of whether children consumed certain foods yesterday. Equally, statistics on breastfeeding duration for children are important to the scope of this study. Mothers were only asked whether their children had been breastfed before and are still breastfeeding, which limits the ability to examine relationships between breastfeeding duration and GF. There were also no objective physical and psychological examinations performed on the children, which can limit the ability to establish the adequacy of maternal caregiving. Finally, differences exist in the included countries regarding access to food and water, conflicts, and poverty. This may make it difficult to make direct comparisons between countries.
CONCLUSIONS
Identifying key GF determinants may provide valuable insights for policymaking and interventions. This may allow the prioritization of resources within countries for preventative measures to be developed such as promoting sufficient carbohydrate intake and plain water consumption, improving access to health insurance, and enhancing maternal caregiving ability through education and health literacy. By focusing on these areas, policymakers and health care professionals can effectively address the risks of GF in children and work towards reducing the global burden of GF.
Acknowledgements
We acknowledge the generosity of UNICEF and each participating country in allowing access to their data.
Ethics statement: Permission from the UNICEF office was provided to the principal supervisor and all collaborators to use the data, so no ethics application was required. Informed consent to participate in the study has been obtained from the parents or legal guardians of the children.
Data availability: The datasets generated during and / or analysed during the current study are available from the corresponding author upon reasonable request.
Footnotes
Funding: No funding was obtained for this study.
Authorship contributions: Stephen Jiang: conceptualization, data curation, formal analysis, investigation, methodology, project administration, writing original draft, writing review and editing; Jerry Sung: data curation, methodology, writing original draft, writing review and editing; Rakshat Sawhney: data curation, methodology, writing original draft, writing review and editing; Jinxuan Cai: data curation, methodology, writing original draft; Huaying Xu: data curation, methodology, writing original draft; Shu Kay Ng: review and editing; Jing Sun: conceptualization, data curation, formal analysis, investigation, methodology, project administration, supervision, validation and visualization. All authors reviewed and agreed on the manuscript prior to final submission.
Disclosure of interest: The authors completed the ICMJE Disclosure of Interest Form (available upon request from the corresponding author) and disclose no relevant interests.
REFERENCES
- 1.Local Burden of Disease Child Growth Failure Collaborators Mapping child growth failure across low- and middle-income countries. Nature. 2020;577:231-4. 10.1038/s41586-019-1878-8 [DOI] [PMC free article] [PubMed] [Google Scholar]
- 2.Spencer N, Raman S, O'Hare B, Tamburlini G.Addressing inequities in child health and development: Towards social justice. BMJ Paediatr Open. 2019;3:e000503-e. 10.1136/bmjpo-2019-000503 [DOI] [PMC free article] [PubMed] [Google Scholar]
- 3.United Nations Children’s Fund (UNICEF), World Health Organization, International Bank for Reconstruction and Development/The World Bank. Levels and trends in child malnutrition: Key findings of the 2021 edition of the joint child malnutrition estimates. 2021.
- 4.Banks LM, Kuper H, Polack S.Poverty and disability in low- and middle-income countries: A systematic review. PLoS One. 2017;12:e0189996. 10.1371/journal.pone.0189996 [DOI] [PMC free article] [PubMed] [Google Scholar]
- 5.Acharya KP, Pathak S.Applied research in low-income countries: Why and how? Front Res Metr Anal. 2019;4:3. 10.3389/frma.2019.00003 [DOI] [PMC free article] [PubMed] [Google Scholar]
- 6.Osgood-Zimmerman A, Millear AI, Stubbs RW, Shields C, Pickering BV, Earl L, et al. Mapping child growth failure in Africa between 2000 and 2015. Nature. 2018;555:41-7. 10.1038/nature25760 [DOI] [PMC free article] [PubMed] [Google Scholar]
- 7.Bhutta ZA, Black RE.Current and future challenges for children across the world. JAMA. 2019;321:1251-2. 10.1001/jama.2019.1840 [DOI] [PubMed] [Google Scholar]
- 8.United Nations Development Programme Human Development Report Office, Oxford Poverty and Human Development Initiative. Global multidimensional poverty index 2019: Illuminating inequalities. Oxf Poverty Hum Dev Initiat (OPHI); 2019.
- 9.Yaya S, Uthman OA, Kunnuji M, Navaneetham K, Akinyemi JO, Kananura RM, et al. Does economic growth reduce childhood stunting? A multicountry analysis of 89 demographic and health surveys in sub-Saharan Africa. BMJ Glob Health. 2020;5:e002042. 10.1136/bmjgh-2019-002042 [DOI] [PMC free article] [PubMed] [Google Scholar]
- 10.Li Z, Kim R, Vollmer S, Subramanian SV.Factors correlated with child stunting, wasting, and underweight in 35 low- and middle-income countries. JAMA Netw Open. 2020;3:e203386-e. 10.1001/jamanetworkopen.2020.3386 [DOI] [PMC free article] [PubMed] [Google Scholar]
- 11.Ijarotimi OS.Determinants of childhood malnutrition and consequences in developing countries. Curr Nutr Rep. 2013;2:129-33. 10.1007/s13668-013-0051-5 [DOI] [Google Scholar]
- 12.Nankumbi J, Muliira JK.Barriers to infant and child-feeding practices: A qualitative study of primary caregivers in rural Uganda. J Health Popul Nutr. 2015;33:106-16. [PMC free article] [PubMed] [Google Scholar]
- 13.Marriott BP, White A, Hadden L, Davies JC, Wallingford JC.World Health Organization (WHO) infant and young child feeding indicators: Correlations with growth measures in 14 low-income countries. Matern Child Nutr. 2012;8:354-70. 10.1111/j.1740-8709.2011.00380.x [DOI] [PMC free article] [PubMed] [Google Scholar]
- 14.Prado EL, Dewey KG.Nutrition and brain development in early life. Nutr Rev. 2014;72:267-84. 10.1111/nure.12102 [DOI] [PubMed] [Google Scholar]
- 15.De Silva I, Sumarto S.Child malnutrition in Indonesia: Can education, sanitation and healthcare augment the role of income? J Int Dev. 2018;30:837-64. 10.1002/jid.3365 [DOI] [Google Scholar]
- 16.Siddiqui F, Salam RA, Lassi ZS, Das JK.The intertwined relationship between malnutrition and poverty. Front Public Health. 2020;8:453. 10.3389/fpubh.2020.00453 [DOI] [PMC free article] [PubMed] [Google Scholar]
- 17.Chowdhury MRK, Rahman MS, Khan MMH, Mondal MNI, Rahman MM, Billah B.Risk factors for child malnutrition in Bangladesh: A multilevel analysis of a nationwide population-based survey. J Pediatr. 2016;172:194-201.e1. 10.1016/j.jpeds.2016.01.023 [DOI] [PubMed] [Google Scholar]
- 18.Rachmi CN, Agho KE, Li M, Baur LA.Stunting, underweight and overweight in children aged 2.0–4.9 years in Indonesia: Prevalence trends and correlated risk factors. PLoS One. 2016;11:e0154756. 10.1371/journal.pone.0154756 [DOI] [PMC free article] [PubMed] [Google Scholar]
- 19.Tosheno D, Mehretie Adinew Y, Thangavel T, Bitew Workie S.Risk factors of underweight in children aged 6–59 months in Ethiopia. J Nutr Metab. 2017;2017:6368746. 10.1155/2017/6368746 [DOI] [PMC free article] [PubMed] [Google Scholar]
- 20.Bekele T, Rawstorne P, Rahman B.Trends in child growth failure among children under five years of age in Ethiopia: Evidence from the 2000 to 2016 demographic and health surveys. PLoS One. 2021;16:e0254768. 10.1371/journal.pone.0254768 [DOI] [PMC free article] [PubMed] [Google Scholar]
- 21.Jeong J, Kim R, Subramanian SV.How consistent are correlations between maternal and paternal education and child growth and development outcomes across 39 low-income and middle-income countries? J Epidemiol Community Health. 2018;72:434-41. 10.1136/jech-2017-210102 [DOI] [PubMed] [Google Scholar]
- 22.World Health Organization. Body mass index-for-age (BMI-for-age) (no date) Available: https://www.who.int/toolkits/child-growth-standards/standards/body-mass-index-for-age-bmi-for-age. Accessed: 24 July 2022.
- 23.Cree RA, Bitsko RH, Robinson LR, Holbrook JR, Danielson ML, Smith C, et al. Health care, family, and community factors correlated with mental, behavioral, and developmental disorders and poverty among children aged 2-8 years - United States, 2016. MMWR Morb Mortal Wkly Rep. 2018;67:1377-83. 10.15585/mmwr.mm6750a1 [DOI] [PMC free article] [PubMed] [Google Scholar]
- 24.Richman L, Pearson J, Beasley C, Stanifer J.Addressing health inequalities in diverse, rural communities: An unmet need. SSM Popul Health. 2019;7:100398. 10.1016/j.ssmph.2019.100398 [DOI] [PMC free article] [PubMed] [Google Scholar]
- 25.Black MM.Impact of nutrition on growth, brain, and cognition. Nestle Nutr Inst Workshop Ser. 2018;89:185-95. 10.1159/000486502 [DOI] [PubMed] [Google Scholar]
- 26.Kyle UG, Shekerdemian LS, Coss-Bu JA.Growth failure and nutrition considerations in chronic childhood wasting diseases. Nutr Clin Pract. 2015;30:227-38. 10.1177/0884533614555234 [DOI] [PubMed] [Google Scholar]
- 27.Arsenault JE, Brown KH.Effects of protein or amino-acid supplementation on the physical growth of young children in low-income countries. Nutr Rev. 2017;75:699-717. 10.1093/nutrit/nux027 [DOI] [PMC free article] [PubMed] [Google Scholar]
- 28.Iftikhar A, Bari A, Bano I, Masood Q.Impact of maternal education, employment and family size on nutritional status of children. Pak J Med Sci. 2017;33:1401-5. 10.12669/pjms.336.13689 [DOI] [PMC free article] [PubMed] [Google Scholar]
- 29.Mensch BS, Chuang EK, Melnikas AJ, Psaki SR.Evidence for causal links between education and maternal and child health: Systematic review. Trop Med Int Health. 2019;24:504-22. 10.1111/tmi.13218 [DOI] [PMC free article] [PubMed] [Google Scholar]
- 30.Britto PR, Lye SJ, Proulx K, Yousafzai AK, Matthews SG, Vaivada T, et al. Nurturing care: Promoting early childhood development. Lancet. 2017;389:91-102. 10.1016/S0140-6736(16)31390-3 [DOI] [PubMed] [Google Scholar]
- 31.Bellù R, Condò M.Breastfeeding promotion: Evidence and problems. Pediatr Med Chir. 2017;39:156. 10.4081/pmc.2017.156 [DOI] [PubMed] [Google Scholar]
- 32.Binns C, Lee M, Low WY.The long-term public health benefits of breastfeeding. Asia Pac J Public Health. 2016;28:7-14. 10.1177/1010539515624964 [DOI] [PubMed] [Google Scholar]
- 33.Patro-Gołąb B, Zalewski BM, Polaczek A, Szajewska H.Duration of breastfeeding and early growth: A systematic review of current evidence. Breastfeed Med. 2019;14:218-29. 10.1089/bfm.2018.0187 [DOI] [PubMed] [Google Scholar]
- 34.Shrestha A, Six J, Dahal D, Marks S, Meierhofer R.Correlation of nutrition, water, sanitation and hygiene practices with children’s nutritional status, intestinal parasitic infections and diarrhea in rural Nepal: A cross-sectional study. BMC Public Health. 2020;20:1241. 10.1186/s12889-020-09302-3 [DOI] [PMC free article] [PubMed] [Google Scholar]
- 35.Bailey RL, West KP, Jr, Black RE.The epidemiology of global micronutrient deficiencies. Ann Nutr Metab. 2015;66:22-33. 10.1159/000371618 [DOI] [PubMed] [Google Scholar]
- 36.UNICEF. Health and child survival. Available: https://www.unicef.org/kyrgyzstan/health-and-child-survival. Accessed: 6 March 2022.
- 37.Novignon J, Aboagye E, Agyemang OS, Aryeetey G.Socioeconomic-related inequalities in child malnutrition: Evidence from the Ghana multiple indicator cluster survey. Health Econ Rev. 2015;5:34. 10.1186/s13561-015-0072-4 [DOI] [PMC free article] [PubMed] [Google Scholar]
- 38.Flores G, Lin H, Walker C, Lee M, Currie JM, Allgeyer R, et al. The health and healthcare impact of providing insurance coverage to uninsured children: A prospective observational study. BMC Public Health. 2017;17:553. 10.1186/s12889-017-4363-z [DOI] [PMC free article] [PubMed] [Google Scholar]
- 39.Grimberg A, Kutikov JK, Cucchiara AJ.Sex differences in patients referred for evaluation of poor growth. J Pediatr. 2005;146:212-6. 10.1016/j.jpeds.2004.09.009 [DOI] [PMC free article] [PubMed] [Google Scholar]
- 40.Drolz A, Wewalka M, Horvatits T, Fuhrmann V, Schneeweiss B, Trauner M, et al. Gender-specific differences in energy metabolism during the initial phase of critical illness. Eur J Clin Nutr. 2014;68:707-11. 10.1038/ejcn.2013.287 [DOI] [PubMed] [Google Scholar]
- 41.Wu BN, O’Sullivan AJ.Sex differences in energy metabolism need to be considered with lifestyle modifications in humans. J Nutr Metab. 2011;2011:391809. 10.1155/2011/391809 [DOI] [PMC free article] [PubMed] [Google Scholar]
- 42.Abbassi V.Growth and normal puberty. Pediatrics. 1998;102:507-11. 10.1542/peds.102.S3.507 [DOI] [PubMed] [Google Scholar]
- 43.Hatløy A, Hallund J, Diarra MM, Oshaug A.Food variety, socioeconomic status and nutritional status in urban and rural areas in Koutiala (Mali). Public Health Nutr. 2000;3:57-65. 10.1017/S1368980000000628 [DOI] [PubMed] [Google Scholar]
- 44.Rah JH, Akhter N, Semba RD, de Pee S, Bloem MW, Campbell AA, et al. Low dietary diversity is a predictor of child stunting in rural Bangladesh. Eur J Clin Nutr. 2010;64:1393-8. 10.1038/ejcn.2010.171 [DOI] [PubMed] [Google Scholar]