
Fig. 5.
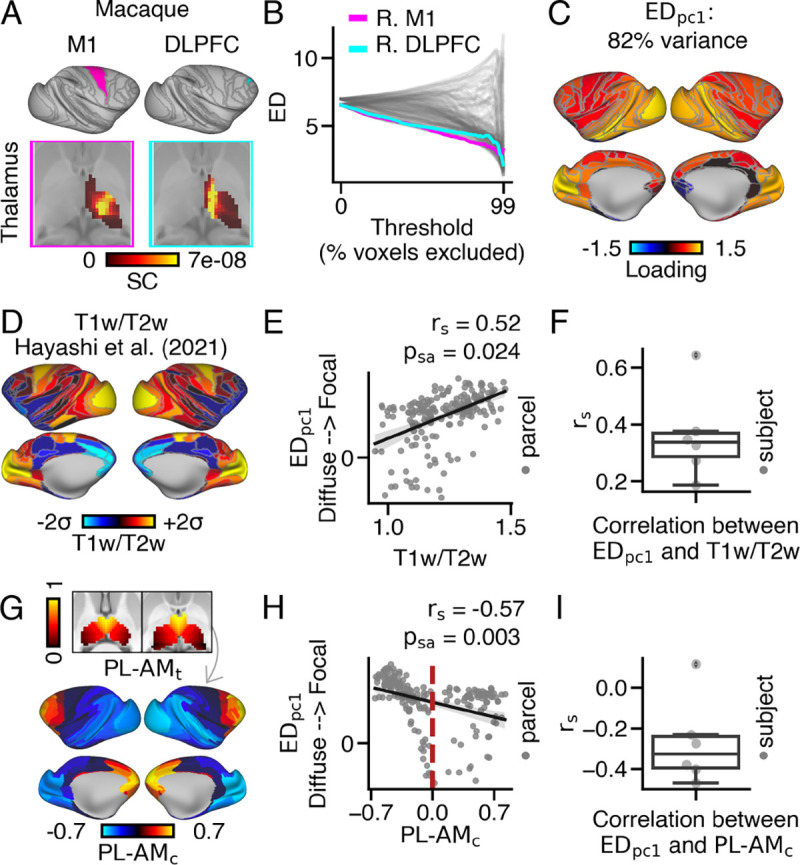
Generalized pattern of cortical variation in the extent of cortical connections within the thalamus observed in macaques. (A) Parcellation of macaque cortex based on the Markov Atlas (67). Exemplar thalamic connectivity patterns for M1 (area F1) and DLPFC (area 9/46d) are displayed in the magenta and cyan panels, respectively. (B) ED matrix. (C) Cortical map showing loadings. (D) Cortical myelin map, calculated by averaging T1w/T2w values across 30 macaque monkeys (68). (E) Across cortex, loadings positively correlated with T1w/T2w values at the group level and (F) at the subject level. (G) Cortical map depicting anatomical coupling with the anteromedial-posterolateral thalamic spatial gradient . Higher values indicate cortical parcels that preferentially couple with anteromedial thalamus . (H) Cortical parcels with higher loadings preferentially coupled with posterolateral thalamus. The red dashed line represents parcels with balanced coupling along the gradient. (I) On average, loadings and value negatively corresponded.