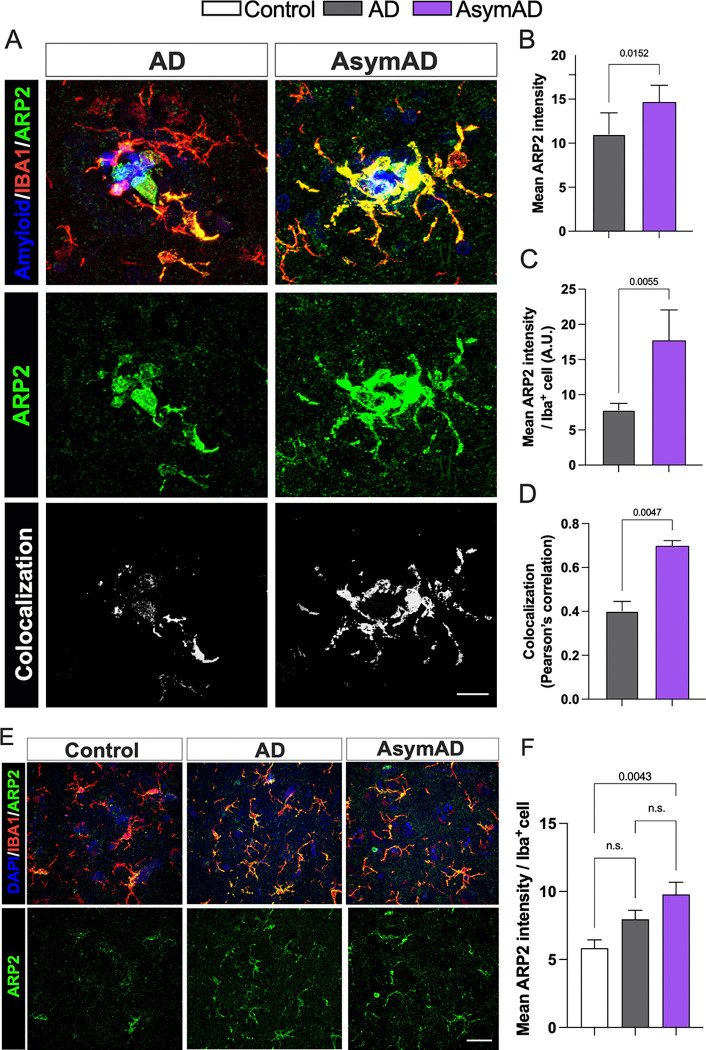
Figure 6: ARP2 levels are enriched in the plaque microenvironment of AsymAD cases.
A. Staining against ARP2 (green), IBA1 (red) and DAPI, to identify amyloid-plaques and cell nuclei, respectively in control, AsymAD, and AD cases. Colocalization between ARP2 and IBA1 pixels are shown in white B-D. Quantification of overall mean ARP2 intensity within 50 μm of the core plaque (B) Mean ARP2 intensity per IBA1 cell (C) and Pearson correlation of ARP2 and IBA intensity (D) E. ARP2 and IBA1 immunostaining in areas free of amyloid-plaques F. Quantification of mean ARP2 intensity per IBA1 cell. Data is shown as mean ± SEM. In A, B and C, 50–60 plaques were analyzed per condition, n=6 cases per condition. Significance was determined by Mann-Whitney test. In F, a total of 90–170 microglia cells were analyzed per condition, n=6 cases per condition. Data is shown as ±SEM, One-way ANOVA, following Tukey’s multiple comparisons test (n.s.; 0.2037 and n.s.; 0.1875).

