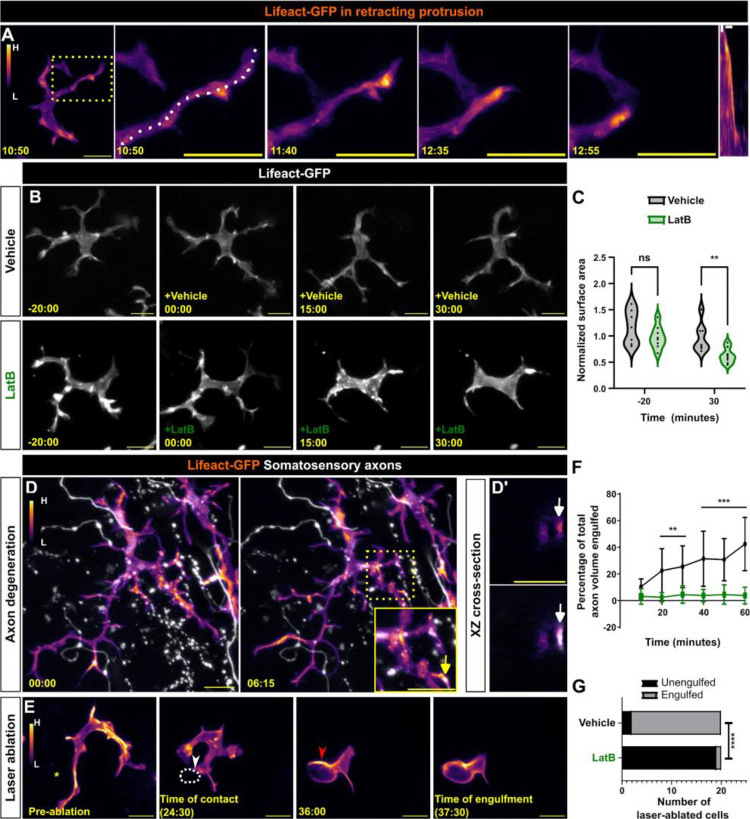
Figure 3. Actin localization and requirements in Langerhans cells during debris engulfment.
A. Stills of Tg(mpeg1:Lifeact-GFP)-positive Langerhans cell depicting Lifeact-GFP localization in a retracting dendrite. Lifeact signal intensity color-coded from low (L) to high (H). Dotted box indicates dendrite of interest that is magnified in panels at right. Dotted line depicts area traced for kymograph (right-most panel). B. Stills of Tg(mpeg1:Lifeact-GFP)-positive Langerhans cells depicting loss of surface area coverage after Latrunculin B (LatB) treatment, but not after vehicle (ethanol) control. C. Violin plots of surface area coverage before and after LatB treatment. n = 7 cells from N = 3 scales for vehicle control, n = 8 cells from N = 3 scales for LatB. D. Stills of Tg(mpeg1:Lifeact-GFP)-positive Langerhans cell depicting Lifeact-GFP localization at sites of axonal debris engulfment. Dotted box surrounds region of interest and is magnified in inset. Arrows in (D, inset) point to the same debris in XZ cross-sections as in (D’). D’ (top) shows Lifeact-GFP only, D’ (bottom) shows merge. E. Stills of Tg(mpeg1:Lifeact-GFP)-positive Langerhans cell depicting Lifeact-GFP localization during engulfment of large cellular debris. Asterisk denotes site of laser ablation, yellow arrowhead denotes site of cell-debris contact, dotted white line denotes cellular debris, red arrowhead denotes actin enrichment during engulfment. F. Quantification of axonal debris engulfment in vehicle-treated controls or LatB-treated scales. n = 9 cells from N = 4 scales for control and n = 9 cells from N = 6 scales for LatB. G. Quantification of large debris engulfment by vehicle-treated controls or LatB-treated scales, n = 20 ablated cells from N = 2 scales for vehicle and LatB. * = p < 0.05, ** = p < 0.01, *** = p < 0.001, **** = p < 0.0001. Mann-Whitney U test was used to determine significance in (C). Two-way ANOVA followed by Bonferroni post-tests was used to determine significance between groups at each time point in (F). Fisher’s exact test was used to determine significance in (G). In (F), data points represent averages, error bars represent standard deviation. Timestamps denote mm:ss. Scale bars in (A, B, D, E) denote 10 microns, scale bars in (D, inset, D’) denote 5 microns, scale bars in (A, kymograph) denote 60s (horizontal) and 2 microns (vertical).

