Abstract
As tissues develop, cells divide and differentiate concurrently. Conflicting evidence shows that cell division is either dispensable or required for formation of cell types. To determine the role of cell division in differentiation, we arrested the cell cycle in zebrafish embryos using two independent approaches and profiled them at single-cell resolution. We show that cell division is dispensable for differentiation of all embryonic tissues during initial cell type differentiation from early gastrulation to the end of segmentation. In the absence of cell division, differentiation slows down in some cell types, and cells exhibit global stress responses. While differentiation is robust to blocking cell division, the proportions of cells across cell states are not. This work simplifies our understanding of the role of cell division in development and showcases the utility of combining embryo-wide perturbations with single-cell RNA sequencing to uncover the role of common biological processes across multiple tissues.
During organismal development, cell-division rates vary continuously within and between tissues to generate the correct abundance and organization of cell types (1–4). Cell differentiation results in changes in expression and activity of cell cycle machinery and division rate, but whether cell division reciprocally regulates cell differentiation is less clear. Studies focusing on a few specific cell state transitions have identified molecular mechanisms coupling cell cycle to signaling and transcription activity which in turn regulates cellular differentiation. These span examples where differentiation is dependent on: (1) binding of a transcription factor (TF) to its target locus during S phase, such as GATA1 to globin in erythropoiesis (5); (2) cell-cycle lengthening to enable accumulation of lineage-specific TFs, such as PU.1 in myeloid cells (6, 7); and (3) the activity of cyclin dependent kinases that phosphorylate signaling molecules and TFs to control differentiation, such as in ES cells and neurons (8–12).
By contrast, prior studies in whole embryos have shown that embryos under conditions of cell cycle arrest undergo morphogenesis and give rise to cells expressing markers of some differentiated cell types including neurons and muscle (13–17). We do not however know whether some – or even all – cell types require cell division to correctly differentiate, as these studies necessarily focused on differentiation of a few cell types, and they only examined a few markers to evaluate differentiation for the cell types examined.
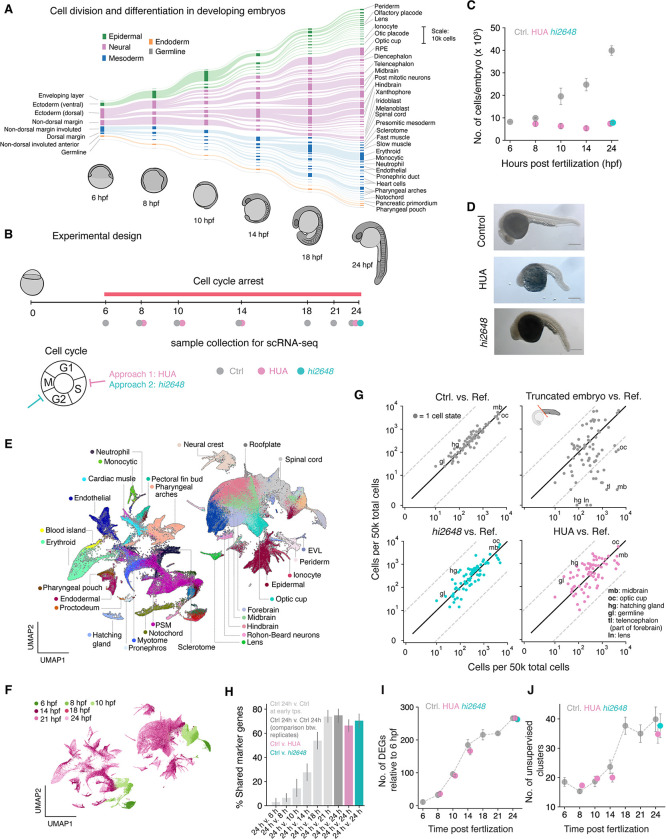
We investigated the requirement of cell division in cellular differentiation of embryos using single cell transcriptome-wide measurements as they allow unbiased and quantitative evaluation of perturbation responses in all cell types in a developing organism (18–20). We used zebrafish as a model of vertebrate development, focusing on a critical period between early gastrulation and late somitogenesis (6 to 24 hours post-fertilization) during which embryonic cells increase about 5-fold in number and simultaneously undergo extensive differentiation from germ layers to the formation of tens of tissues including the developing brain and spinal cord, a beating heart, skin, endothelium, and circulating blood (18, 20–22) (Fig. 1A). This time period therefore allows critical evaluation of the requirement for cell cycle progression in the differentiation of multiple tissues from all germ layers and across several cell divisions.
Fig. 1. All major cell types form after cell cycle arrest.
(A) Developmental hierarchy from 6 to 24 hours post fertilization (hpf) adapted from (20); flowline thickness indicates changes in cell numbers as measured by scRNA-seq. (B) Experimental design for cell cycle arrest: embryos developed until 6 hpf and were then arrested in cell cycle. Data was collected at specified time points between 6 and 24 hpf for control and HUA arrest and at 24 hpf for emi1mutant fish (hi6248). (C) Number of dissociated cells per embryo for different time points for control and arrested embryos. (D) Whole embryo images of control (top), HUA (middle) and emi1 mutant (bottom) embryos at 24 hpf. Scale bar: 200 μm (E, F) UMAP representation of control data shown in (B) colored by (E) cell states and by (F) time points. (G) From left to right: proportion of cells of each cell type compared to reference (Wagner et. al. 2018) for control, truncated, emi1 mutant, and HUA treated embryos. Solid black line represents unchanged proportions (slope=1), dashed grey lines represent 20-fold depletion/enrichment. Selected cell states are annotated; for full data see Table S2. (H) Mean percentage shared “marker” genes across each annotated cell state between different specified conditions (I) Number of differentially expressed genes between 6 hpf and further times: 8, 10, 14 and 24 hpf. (J) Number of unsupervised Leiden clusters at different time points. For all figures: Grey: unperturbed control embryos. Teal: emi1 mutant. Purple: HUA treatment.
Differentiation of all early embryonic tissues occurs in the absence of cell division
We arrested cell cycle at early gastrulation (6 hpf) using two independent approaches: a cocktail of DNA replication inhibitors HUA (hydroxyurea and aphidicolin) and a loss-of-function mutation in emi1 (allele hi2648) which has been reported to arrest cell cycle at 6 hpf at the G2/M transition (23, 24) (Fig. 1B). For HUA-treated and control embryos, we closely tracked differentiation dynamics by single-cell RNA-sequencing (scRNA-seq) between 6 and 24 hpf (Fig. 1B) and studied the emi1 mutants at 24 hpf (Fig. 1B), for a total of 248,998 cell transcriptomes across all experiments (Fig. S1A). We confirmed that arrested embryos had constant cell numbers (Fig 1C), an increased cell size (Fig. S1B,C), and no DNA replication as measured by EdU incorporation (Fig. S1D,E). The arrested embryos continued to undergo major morphological changes as previously reported (13–17), including completion of epiboly, formation of anterior-posterior and dorsal-ventral axes, somitogenesis and neural tube formation. However tail elongation was severely affected (Fig. 1D, S2), as were cellular packing and orientation in the anterior body and head (Fig. S1F).
We used the time-resolved scRNA-seq data from unperturbed, HUA-treated, and emi1 embryos to determine which cell types required cell division for their formation. To do this, we assigned all single-cell transcriptomes to annotated cell states using a classifier trained on our previously published scRNA-seq atlas of zebrafish development for all time points (20) (Fig. 1E, F and Figs. S3A–F). In control embryos, all annotated cell types were represented, and their abundances agreed quantitatively with those of the reference (Fig. 1G). Strikingly, we found that every one of the annotated cell states at 24 hpf were also found to be present after cell cycle arrest. This result indicates that cell cycle progression is not required for the formation of any of the cell types during the embryonic period examined.
To build confidence in this result, we carried out several controls. First, we repeated the analyses on data collected from truncated embryos whose head was removed to ensure complete loss of some cell states. We observed depletion of anterior cell states in truncated embryos as expected, establishing that we can dependably detect the presence or absence of specific cell states (Fig. 1G). Second, we confirmed that cells were correctly classified by examining the expression of genes specifically enriched in each cell state (defined as marker genes) in control and arrested embryos. We observed a large overlap of marker genes between cell states in control and arrested embryos at 24 hpf but not when comparing 24 hpf control cell states with earlier developmental stages (Fig. 1H). Third, we independently evaluated the increasing complexity of these embryos over time using both the number of genes increasing or decreasing in expression compared to the mid-gastrula (6 hpf) embryo (Fig. 1I) and the number of unsupervised clusters in scRNA-seq data (Fig, 1J). Each of these two additional metrics showed similar complexity of the wildtype and arrested embryos across the differentiation time course, without need for assignment of cell types or comparison to the reference data. These multiple metrics indicate that progression through the cell cycle is not required for differentiation during early embryogenesis.
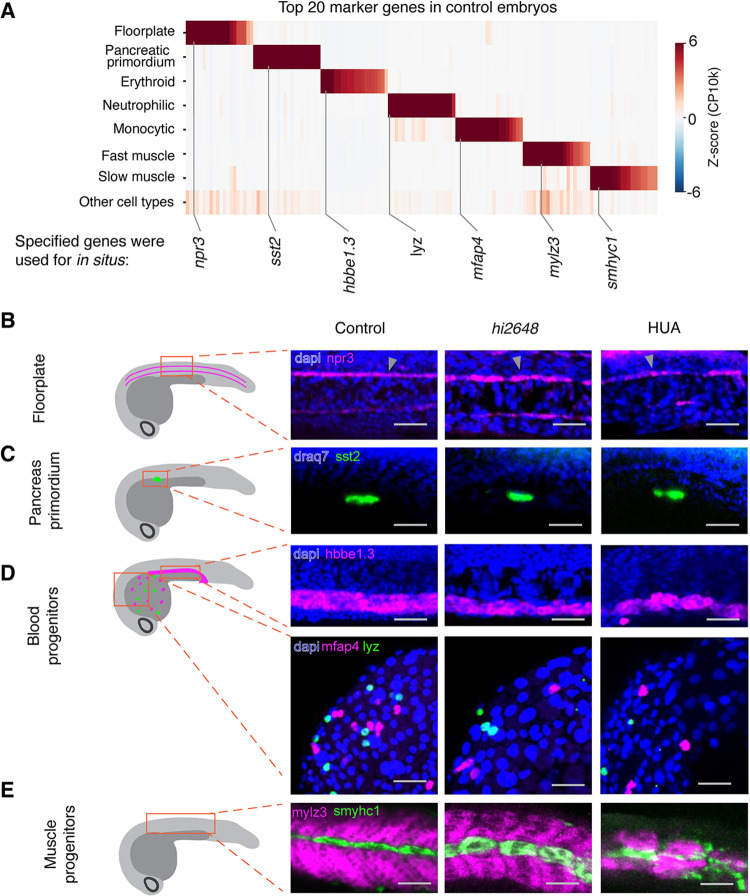
These observations suggested that arrested embryos, which exhibit macroscopic aberrations in their morphology, are nevertheless composed of the same repertoire of cell types and states as that of normal embryos. These results were further supported by staining for specific cell types at 24 hpf using RNA fluorescent in situ hybridization (FISH) against cell type specific genes revealed in the data (Fig. 2A). The perturbed embryos contained rare cell types such as the neural tube floorplate and the pancreatic primordium, which first form during the period of cell cycle arrest and represent only 0.28% and 0.15% of cells in the 24 hpf embryo respectively as measured by scRNA-seq (20) (Fig. 2B,C). They also contained cells corresponding to progressive stages of differentiation including three blood cell types (erythroid, neutrophil precursors and monocytic cells), and two muscle types (slow and fast muscle) (Fig. 2D,E). Together, these data independently corroborate the presence of rare and specific cell types within the perturbed embryo, and further support that all annotated cell states identified in control embryos form in the absence of cell division.
Fig. 2. Validation of formation of cell types in situ.
(A) Top 20 marker genes for select cell types (B-E) In situ hybridization of cell type specific marker genes: (B) npr3 for floorplate (magenta), (C) sst2 for pancreatic primordium (green), (D) top: hbbe1.3 (magenta) for erythroid progenitors, bottom: mfap4 for neutrophilic (magenta) and lyz for monocytic cells (green), (E) mylz3 for fast muscle (magenta) and smylc1 for slow muscle fibers (green). Scale bar: 50 μm
Differentiation rates variably depend on cell division
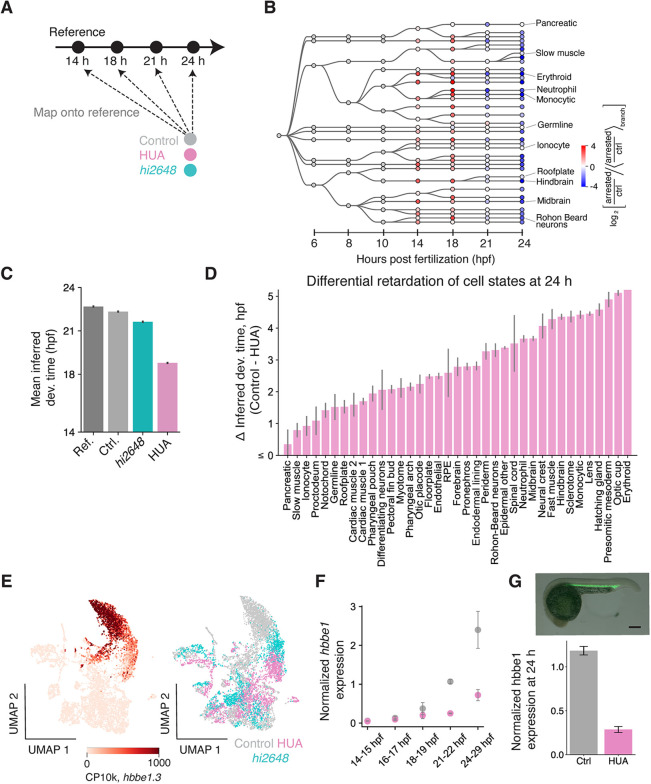
Beyond formation of all major cell types, normal development establishes these cells in the right proportions and at the right time. Having found that all cell states can form without cell division, we next examined how differentiation timing of these cell states depend on cell division. We tested for changes in timing of differentiation by comparing single-cell transcriptomes from arrested embryos to unperturbed controls (Fig. 3A,B). Upon mapping each cell from 24 hpf perturbed embryos to its most similar wildtype reference (Fig. S1A) at any time point, we observed a delay in differentiation for both cell-cycle perturbations, with mean lags of 3.16 ± 0.02 hours in HUA-treated and 0.71 ± 0.02 hours in emi1 mutants at 24 hpf (Fig. 3C), which was reproducible in all replicate experiments. Of note, this delay varies for different cell states. Erythroid cells appeared the most retarded (Fig. 3D,E 5.18 hours), recapitulating the influence of cell cycle in mammalian erythropoiesis (5, 25). The optic cup, monocytic cells, presomitic mesoderm, hatching gland and other tissues showed comparable delay and the degree of lag was broadly distributed across cell types (Fig. 3D). We further confirmed the delay in differentiation of blood cells by quantitative PCR, and by RNA FISH: as predicted from the scRNA-seq, the erythroid globin genes hbae3 and hbbe1.3 accumulated more slowly upon cell-cycle arrest (Fig. 3F,G, S4), as did the myeloid cell markers lyz and srgn (Fig. S4). Therefore, although progression through the cell cycle was not required for differentiation of any cell types, its absence slowed down cell differentiation, in a tissue-specific manner.
Fig. 3. Embryonic cell types are non-uniformly retarded in differentiation upon cell cycle arrest.
(A) Schematic for inferring developmental time of cells in the 24 hpf embryos. (B) Enrichment (red)/depletion (blue) of cell states across time points. It is the ratio (HUA/control) of fraction of cells in a state (shown as a circle) normalized by the geometric mean of the ratio for all cell states in the branch of the plotted developmental tree to which that state belongs. (C) Mean inferred developmental time across all cells for different conditions. Error bar represents SEM across cells in that condition. (D) Inferred delay in developmental time (Control – HUA) for all annotated cell types at 24 hpf. Error bar represents SEM across all cells in that cell type. (E) UMAP of all blood and endothelial cells colored by hbbe1.3 counts per 10k total counts (CP10k) (left) and by conditions – control, HUA and emi1 mutant cells (right) at 24 hpf. (F) Expression of hbbe1.3 normalized by gata1a measured using whole embryo RT-qPCR at time points between 14 and 29 hpf (G) in situ hybridization of hbbe1.3 (top) quantified in control and HUA embryos (bottom). Normalized by gata1a expression.
Cell cycle arrest induces pan-embryonic transcriptional responses
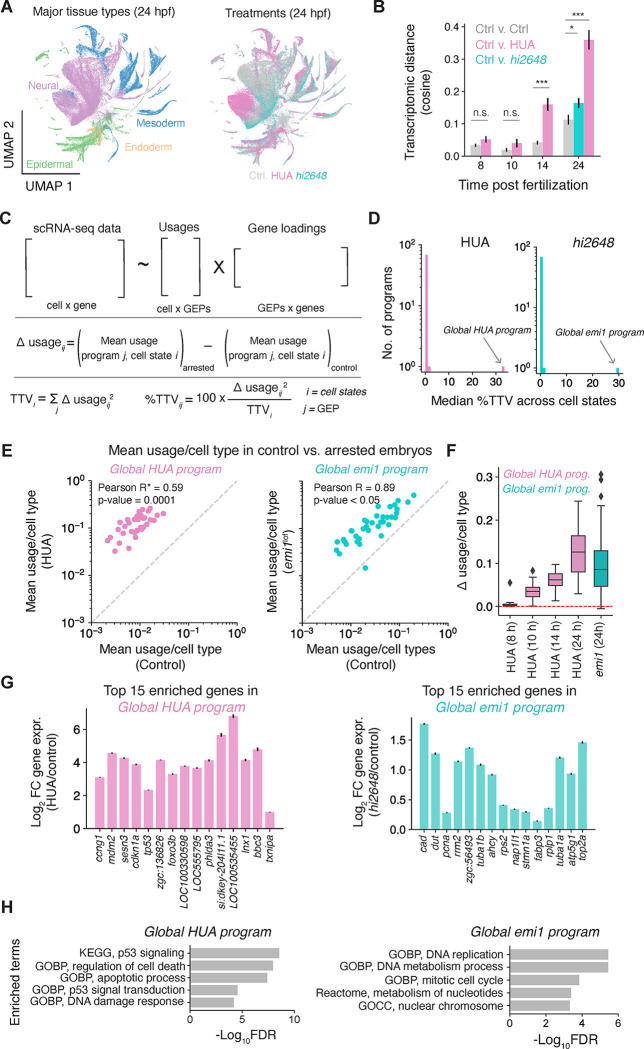
Along with a delay in differentiation, we observed differences in the transcriptomes of arrested cells, which grew progressively from 14 to 24 hpf (Fig. 4A, B, S3G). To assess the nature of these differences, we inferred gene expression programs (GEPs) by consensus non-negative matrix factorization (cNMF)(26) and evaluated their contribution to total transcriptomic variation (TTV, defined in Fig. 4C as the magnitude of gene expression change) between control and perturbed cells in matched states (Fig. 4C, Tables S3, 4). Strikingly, just one GEP contributed to a median 33.6% of TTV across all cell types following HUA treatment (range 0.5 – 74.3% of TTV across cell types) (Fig. 4D, left). This program was progressively upregulated in all cell types beyond 8 hpf (Fig 4E, F). Another single program explained 30% of the median TTV between 24 hpf emi1 mutant and control embryos (range 0.1 – 75.9%) (Fig. 4D, right). All other programs individually explained less than 2.5% TTV (Fig. 4D). The presence of these single global responses suggests that transcriptomic differences are driven by universal cellular responses to each form of cell cycle arrest. Many of the top genes induced by HUA were p53 target genes (cdkn1a, bbc3, ccng1, sesn1, ddit4, tp53inp1, btg2, mdm2, plk3, sesn3 and prdx1), as expected from a response to blocking DNA replication (Fig. 4G, H, Table S5). Other genes enriched in this program have not been previously associated with p53 response and and could have a role in responding to replicative stress across multiple tissues (Table S5). The universal response to arrest in emi1 mutants identified a distinct program enriched in DNA replication-related genes (mcm4, pcna, rrm2, mcm2, lig1, top2a, dut, nap1l1, dnmt1 and kpna2) (Fig. 4G, H, Table S5). This program is consistent with emi1 loss trapping cells at a G2 checkpoint (23, 24). Interestingly, both global programs were deployed at low levels across cell types in wildtype embryos, and their induction upon arrest scaled with baseline expression in each cell type (Fig. 4E). This suggests that different cell types might be variably primed to respond to replicative stresses.
Fig. 4. Global cell cycle arrest response across cell types.
(A) UMAP representation of reference data colored by cell types (left) and treatment (right). (B) Average transcriptomic distance across cell types between different conditions and time points. Grey: control vs. control (across replicates), purple: HUA vs. control, teal: emi1 mutant vs. control. (C) Schematic for finding gene expression programs (GEP) and their usages, and calculating differential (Δ) usage, total transcriptional variation (TTV) per cell type, and %TTV contributed per program (D) Distribution of median %TTV across cell types of all GEPs in HUA (left) and emi1 mutant (right) embryos at 24 hpf. (E) Usage of HUA enriched and emi1 enriched global programs in HUA vs. control (left) and emi1 mutants vs. control embryos (right) respectively. (F) Δ usage of HUA-enriched and emi1-enriched program for cell states at different time points. (G) Fold change expression of top 15 genes of HUA enriched program (left) and emi1 enriched program (right) between control and HUA (purple) and control and emi1 mutants (teal) respectively. (H) Gene set enrichment analysis for global HUA and emi1 mutant specific program genes. GOBP: Gene ontology biological processes; GOCC: Gene ontology cellular component.
Cell type proportions are not robust to loss of cell division
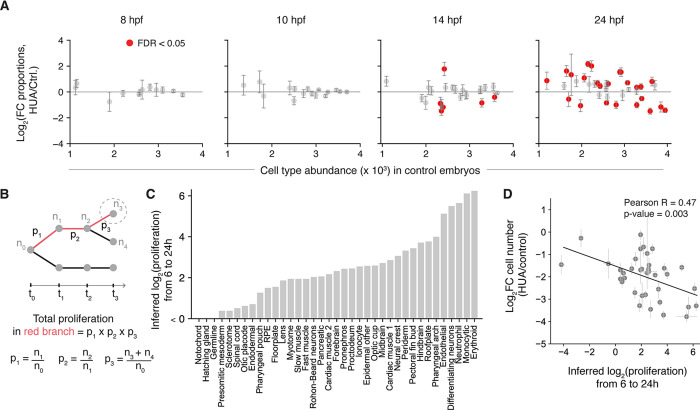
Finally, we asked whether the proportions of different cell types in an embryo are sensitive to cell cycle arrest. Within eight hours of arrest (14 hpf), 6 out of 24 annotated cell states already showed significant changes in proportion, and by 24 hpf the number had increased to 24 out of 37 cell states (Fig. 5A, Table S6). These changes occurred reproducibly between the two methods of cell cycle arrest (Fig. S5A). These differences in proportions could be due to non-uniform proliferation rates across the embryo, because cell types emerging from highly-proliferative progenitors should be underrepresented after cell cycle arrest while those that differentiate from less-proliferative progenitors should be relatively enriched. To test this hypothesis, we estimated the expected proliferation of cells giving rise to each cell state from 6 hours to 24 hours using changes in measured cell abundances over time in a closely resolved scRNA-seq time series of untreated embryos from (20) (Fig. 5B, Table S7). The inferred rates indeed correlate with observed changes in cell-type abundance (Fig. 5C, Fig. S5B) (Pearson r = −0.47, p-value = 0.003), consistent with changes in cell type proportion resulting from loss of proliferation. However, these predicted changes over-estimate the actual changes observed by more than five-fold (Fig. 5C), so it is possible that some compensatory changes occur to maintain embryonic patterning upon cell cycle arrest.
Fig. 5. Cell type proportions are not robust to cell cycle arrest.
(A) Fold change in proportions of cells for each annotated cell state across different time points (8, 10, 14 and 24 hpf) in HUA treated versus control samples. Significant changes are marked in red (FDR < 0.05). using beta binomial test and Benjamini Hochberg correction (B) Schematic for calculating the expected cumulative number of cell divisions of cells over time. p1, p2 and p3 represent proliferation between adjoining states and n0 to n4 are number of cells in labeled states calculated from the fraction of cells occupying each state as seen by scRNA-seq, and the total embryo cell counts from Ref. (20) (C) Inferred log2(proliferation) of different cell types from 6 to 24 hpf (D) Comparison between log2 fold change in numbers of cells in each annotated cell type versus their proliferation from 6 to 24 hpf. Black line is the trendline with slope = −0.22 Pearson correlation = −0.47.
Taken together, our results indicate that cell differentiation is not dependent on cell cycle progression, but that the proportions and total numbers of different cell types may be tuned by differential rates of cell cycle progression. We speculate that decoupling of control of cell state transitions from cell division may be a general principle that allows developmental systems to more easily evolve either changes in cell type proportion or emergence of new cell types. In light of these results, we interpret prior findings supporting the molecular control of differentiation by the cell cycle as likely reflecting specialized tissue adaptations rather than a general mechanism of development. Some of these results may reflect weak interplay between cell cycle and differentiation that quantitatively tune development processes, including affecting the rate of cell differentiation as seen here in response to cell cycle arrest. Our analytical framework makes use of an annotated, wild-type embryonic developmental atlas to quantitatively and systematically evaluate perturbations simultaneously across multiple tissues and should prove useful for studying multi-tissue responses to other perturbations.
Supplementary Material
Acknowledgments:
This work was funded by NIH grant 1R01HD096755. We thank members of the Klein lab - Sean E. McGeary, Tal Scully, James C. Taggart, Hailey M. Cambra, Laura E. Bagamery and of Megason lab - Nagarajan Nandagopal for their critical reading of the manuscript; Anna Philpott, Andrew Murray and Connie Cepko for suggestions on experimental design and analyses. We would also like to acknowledge Lexie O’Brien for helping with zebrafish maintenance and in situ hybridization experiments and Andrew Ross Murphy for animal care.
Footnotes
Data and materials availability: Raw RNA sequencing data is being made available on GEO, accession number to be provided shortly.
References
- 1.Cremisi F., Philpott A., Ohnuma S. I., Cell cycle and cell fate interactions in neural development. Curr Opin Neurobiol. 13, 26–33 (2003). [DOI] [PubMed] [Google Scholar]
- 2.Budirahardja Y., Gonczy P., Coupling the cell cycle to development. Development (2009), doi: 10.1242/dev.021931. [DOI] [PubMed] [Google Scholar]
- 3.Ohnuma S. I., Philpott A., Harris W. A., Cell cycle and cell fate in the nervous system. Curr Opin Neurobiol. 11, 66–73 (2001). [DOI] [PubMed] [Google Scholar]
- 4.Dalton S., Linking the Cell Cycle to Cell Fate Decisions. Trends Cell Biol. 25, 592–600 (2015). [DOI] [PMC free article] [PubMed] [Google Scholar]
- 5.Pop R., Shearstone J. R., Shen Q., Liu Y., Hallstrom K., Koulnis M., Gribnau J., Socolovsky M., A Key Commitment Step in Erythropoiesis Is Synchronized with the Cell Cycle Clock through Mutual Inhibition between PU.1 and S-Phase Progression. PLoS Biol. 8 (2010), doi: 10.1371/journal.pbio.1000484. [DOI] [PMC free article] [PubMed] [Google Scholar]
- 6.Kueh H. Y., Positive feedback between PU.1 and the cell cycle controls myeloid differentiation. Science. 342, 311 (2013). [DOI] [PMC free article] [PubMed] [Google Scholar]
- 7.Ali F., Hindley C., McDowell G., Deibler R., Jones A., Kirschner M., Guillemot F., Philpott A., Cell cycle-regulated multi-site phosphorylation of Neurogenin 2 coordinates cell cycling with differentiation during neurogenesis. Development. 138, 4267–4277 (2011). [DOI] [PMC free article] [PubMed] [Google Scholar]
- 8.Vernon A. E., Philpott A., A single cdk inhibitor, p27Xic1, functions beyond cell cycle regulation to promote muscle differentiation in Xenopus. Development. 130, 71–83 (2003). [DOI] [PubMed] [Google Scholar]
- 9.Walsh K., Perlman H., Cell cycle exit upon myogenic differentiation. Curr Opin Genet Dev. 7, 597–602 (1997). [DOI] [PubMed] [Google Scholar]
- 10.Kadri Z., Shimizu R., Ohneda O., Maouche-Chretien L., Gisselbrecht S., Yamamoto M., Romeo P. H., Leboulch P., Chretien S., Direct binding of pRb/E2F-2 to GATA-1 regulates maturation and terminal cell division during erythropoiesis. PLoS Biol. 7 (2009), doi: 10.1371/journal.pbio.1000123. [DOI] [PMC free article] [PubMed] [Google Scholar]
- 11.Buttitta L. A., Edgar B. A., Mechanisms controlling cell cycle exit upon terminal differentiation. Curr Opin Cell Biol. 19, 697–704 (2007). [DOI] [PMC free article] [PubMed] [Google Scholar]
- 12.Edgar P. H., Bruce A, Lehman, Dara A. and O’Farrell, Transcriptional regulation of string(cdc25): a link between developmental programming and the cell cycle. Development. 120, 3131–3143 (1994) (1994). [DOI] [PMC free article] [PubMed] [Google Scholar]
- 13.Satoh N., On the clock mechanism determining the time of tissue-specific enzyme development during ascidian embryogenesis. J Embryol Exp Morphol. 54, 131–139 (1979). [PubMed] [Google Scholar]
- 14.Hartenstein V., Posakony J. W., Sensillum Development in the Absence of Cell Division: The Sensillum Phenotype of the Drosophila Mutant string . Dev Biol. 138, 147–158 (1989). [DOI] [PubMed] [Google Scholar]
- 15.Harris W. A., Hartenstein V., Neuronal Determination in Xenopus Embryos without Cell Division. Cell. 6, 499–515 (1991). [DOI] [PubMed] [Google Scholar]
- 16.Riley B. B., Sweet E. M., Heck R., Evans A., McFarland K. N., Warga R. M., Kane D. A., Characterization of harpy/Rca1/emi1 mutants: Patterning in the absence of cell division. Developmental Dynamics. 239, 828–843 (2010). [DOI] [PMC free article] [PubMed] [Google Scholar]
- 17.Zhang L., Kendrick C., Julich D., Holley S. A., Cell cycle progression is required for zebrafish somite morphogenesis but not segmentation clock function. Development. 135, 2065–2070 (2008). [DOI] [PMC free article] [PubMed] [Google Scholar]
- 18.Farrell J. A., Wang Y., Riesenfeld S. J., Shekhar K., Regev A., Schier A. F., Single-cell reconstruction of developmental trajectories during zebrafish embryogenesis. Science, eaar3131 (2018). [DOI] [PMC free article] [PubMed] [Google Scholar]
- 19.Jin X., Simmons S. K., Guo A., Shetty A. S., Ko M., Nguyen L., Jokhi V., Robinson E., Oyler P., Curry N., Deangeli G., Lodato S., Levin J. Z., Regev A., Zhang F., Arlotta P., In vivo Perturb-Seq reveals neuronal and glial abnormalities associated with autism risk genes. Science 370 (2020) [DOI] [PMC free article] [PubMed] [Google Scholar]
- 20.Wagner D. E., Weinreb C., Collins Z. M., Briggs J. A., Megason S. G., Klein A. M., Single-cell mapping of gene expression landscapes and lineage in the zebrafish embryo. Science. 360, 981–987 (2018). [DOI] [PMC free article] [PubMed] [Google Scholar]
- 21.Kimmel C. B., Ballard W. W., Kimmel S. R., Ullmann B., Schilling T. F., Stages of embryonic development of the zebrafish. Developmental dynamic. 203, 253–310 (1995). [DOI] [PubMed] [Google Scholar]
- 22.Kimmel C. B., Warga R. M., Schilling T. F., Origin and organization of the zebrafish fate map. Development. 108, 581–594 (1990). [DOI] [PubMed] [Google Scholar]
- 23.Machida Y. J., Dutta A., The APC/C inhibitor, Emi1, is essential for prevention of rereplication. Genes Dev. 21, 184–94 (2007). [DOI] [PMC free article] [PubMed] [Google Scholar]
- 24.Reimann J. D. R., Freed E., Hsu J. Y., Kramer E. R., Peters J.-M., Jackson P. K., Emi1 is a mitotic regulator that interacts with Cdc20 and inhibits the anaphase promoting complex. Cell. 105(5), 645–655 (2001). [DOI] [PubMed] [Google Scholar]
- 25.Tusi B. K., Wolock S. L., Weinreb C., Hwang Y., Hidalgo D., Zilionis R., Waisman A., Huh J. R., Klein A. M., Socolovsky M., Population snapshots predict early haematopoietic and erythroid hierarchies. Nature Publishing Group. 555 (2018), doi: 10.1038/nature25741. [DOI] [PMC free article] [PubMed] [Google Scholar]
- 26.Kotliar D., Veres A., Nagy M. A., Tabrizi S., Hodis E., Melton D. A., Sabeti P. C., Identifying gene expression programs of cell-type identity and cellular activity with single-cell RNA-Seq. Elife. 8 (2019), doi: 10.7554/eLife.43803. [DOI] [PMC free article] [PubMed] [Google Scholar]
Associated Data
This section collects any data citations, data availability statements, or supplementary materials included in this article.


