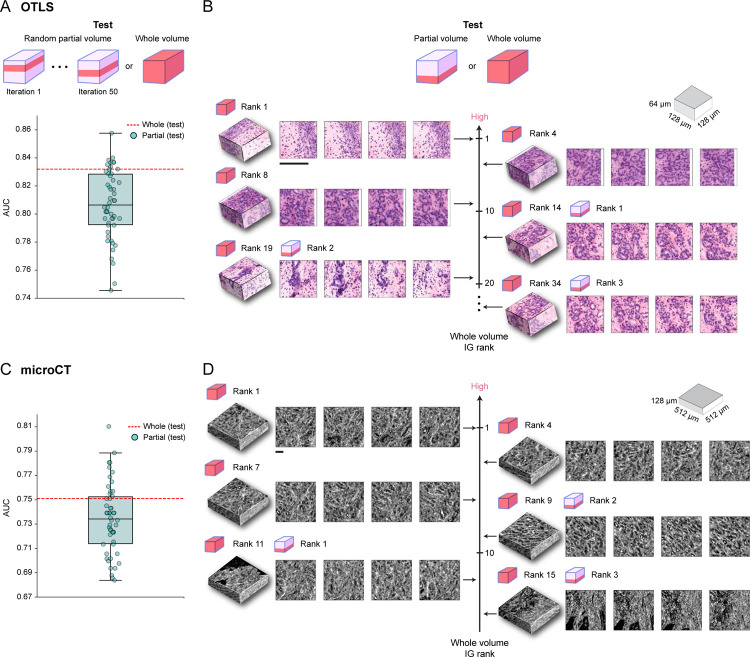
Figure 4: Comparison between whole-volume and partial-volume analysis.
Given the predictive model trained on whole volume cuboids, the cohort-level AUC is computed for the whole volume (whole volume) or over 50 iterations with 15% of the tissue volume randomly sampled each time (partial volume). (A) OTLS cohort AUC spread for the partial volume analysis (teal) and AUC for the whole volume analysis (red). The AUC spread is considerable and indicative of significant performance variability induced by heterogeneity within the tissue volume. (B) IG score ranking for 3D patches when tested on the whole volume and partial volume of a given OTLS sample, where a higher ranking corresponds to a larger integrated gradient (IG) score. The top IG score patches from the partial volume analysis are not the top contributors for increasing the risk when other patches from the whole tissue volume are accounted for. This suggests that partial volumes can miss prognostic regions. (C-D) The same analyses for the microCT cohort with similar findings to the OTLS analyses. All scale bars are 100μm.

