

Abstract
Background
Lactate/albumin (LA/ALB) and procalcitonin/albumin (PCT/ALB) ratios have been implicated in predicting mortality in sepsis patients. However, their prognostic value and relationship to sepsis severity require further investigation. This retrospective study aimed to assess the prognostic value of lactate/albumin (LA/ALB) and procalcitonin/albumin (PCT/ALB) ratios in septic patients admitted to the Intensive Care Unit (ICU).
Material/Methods
A total of 340 adult sepsis patients admitted to the ICU were included in the derivation cohort. LA/ALB and PCT/ALB ratios were calculated and analyzed in relation to sepsis severity and survival status. Additionally, a validation cohort of 75 sepsis patients from another medical center was selected.
Results
In the derivation cohort, higher LA/ALB and PCT/ALB ratios and SOFA scores were significantly associated with increased mortality (P<0.001). The LA/ALB and PCT/ALB ratios positively correlated with SOFA score. Survival analysis revealed significantly higher 28-day mortality in sepsis patients with elevated PCT/ALB (≥0.256) and LA/ALB (≥0.079) ratios upon ICU admission. The constructed prediction model incorporating LA/ALB ratio, PCT/ALB ratio, and SOFA score yielded an AUC of 0.826, demonstrating good predictive ability. The associations between LA/ALB and PCT/ALB ratios and 28-day mortality in sepsis patients were validated in the validation cohort.
Conclusions
The LA/ALB and PCT/ALB ratios at ICU admission provide valuable prognostic information for predicting 28-day mortality in sepsis patients. Combining these ratios with SOFA score improves the assessment of prognosis in sepsis patients.
Keywords: Albumins, Lactates, Mortality, Nomograms, Procalcitonin, Sepsis
Background
Sepsis is described as an organ malfunction resulting from an uncontrolled host response to the infection, which is the leading cause of death among severely ill individuals and a significant public health concern worldwide [1,2]. A Lancet study reported there are nearly 50 million cases of sepsis worldwide each year, with 11 million sepsis-related deaths, and 1 person dying every 2.8 seconds from sepsis [3]. A study of 44 hospital ICUs in China found that the incidence of sepsis in ICUs was 20.6%, the case fatality rate was 35.5%, and the mortality rate was as high as 50% in severe sepsis [4]. For patients with sepsis, rapid and accurate assessment of prognosis on the first day of ICU admission is of great significance, but there is still a lack of effective clinical and laboratory-related indicators. Therefore, there is an immediate need for reliable predictive biomarkers to effectively evaluate the prognosis of sepsis patients and achieve precise diagnosis and treatment of sepsis patients.
As research has progressed, various biomarkers of sepsis have been revealed. At present, procalcitonin (PCT) [5] and C-reactive protein (CRP) [6] have been evaluated for use in the diagnosis and prognosis of sepsis, which have been included in the diagnostic criteria for sepsis by the Surviving Sepsis Campaign [7]. However, it should be noted that CRP and PCT both have some limitations, such as non-specificity and delayed response [8]. Moreover, some studies identified that PCT and CRP were unable to efficiently predict the risk of death in septic patients [9,10]; therefore, the value of PCT and CRP in the assessment of sepsis prognosis is still controversial. Meanwhile, other biomarkers, such as interleukin-37 (IL-37) [11], IL-26 [12] heparin-binding protein (HBP) [13], lactate (LA) [14], albumin (ALB) [15], macrophage/CD5L [16], and heat shock protein 90α (HSP90α) [17], have been found to be useful in the prognostic assessment of sepsis. Nevertheless, the specific role of most biomarkers in patients with sepsis is not well defined, and of the many biomarkers that have been studied, only a small fraction have been evaluated in large or replicated studies, while the sensitivity and specificity of single biomarkers were limited [18–20], which further limits the clinical application of the above indicators. Accordingly, to save medical resources, reduce costs, ensure the correct interventions, and further improve outcomes for septic patients, there is still a need to discover more new biomarkers applicable to clinical applications in an effort to optimize patient treatment.
Lactate/albumin (LA/ALB) ratio reflects the degree of cell damage and tissue hypoxia, and, combined with the nutritional status of body, is expected to be a biomarker for the prognosis of sepsis. It has been shown that the LA/ALB ratio can be used as an early prognostic marker in severely sick individuals, especially in those with heart failure or sepsis [21–23]. Moreover, procalcitonin/albumin (PCT/ALB) ratio is a new indicator that combines inflammation levels with nutritional status, which had been shown to contribute to the prognosis of sepsis in neonates [24]. Despite this, the correlation between the prognosis of sepsis and LA/ALB ratio, as well as PCT/ALB ratio, has rarely been studied. The present study evaluated the relationship between LA/ALB and PCT/ALB ratios on the first day of admittance to the ICU and the 28-day prognosis of patients with sepsis and attempted to develop a relevant predictive model.
Material and Methods
Study Population
We retrospectively collected data on septic patients admitted to the Intensive Care Unit (ICU) of the Second Affiliated Hospital of Nanchang University (China) from 1 January 2018 to 31 December 2022. There were 340 sepsis patients included in the derivation cohort. The validation cohort included 75 patients with sepsis admitted to the ICU at Dali University’s First Affiliated Hospital over the same period. Afterward, according to the septic patients’ 28-day mortality, the patients in the derivation cohort and validation cohort were assigned to either the survival group or the non-survival group. This research was approved by the Ethics Committee of the Second Affiliated Hospital of Nanchang University. Because of the retrospective and observational nature of the investigation and because the data were anonymous, the requirement for informed consent was waived by the Ethics Committee.
Key Inclusion and Exclusion Criteria
Inclusion criteria were: (1) All individuals fulfilled the diagnosis criteria of sepsis as recommended in the Third International Consensus Definitions for Sepsis and Septic Shock (sepsis 3.0) [25]; (2) Age 18–80 years; (3) All individuals had clinical data available.
Exclusion criteria were: (1) Women during pregnancy and lactation; (2) Severe liver and kidney dysfunction; (3) Major adverse cardiac and cerebrovascular events (myocardial infarction, cerebral hemorrhage, and cerebral infarction); (4) Patients with tumors, blood system diseases, immune system diseases, and other acute and life-threatening events; (5) Patients who received intravenous fluids containing albumin or lactate prior to blood collection; (6) Patients with missing key information.
Clinical and Laboratory Data Collection
Data were obtained via manual and automated retrievals from the institutional electronic medical records regarding clinical characteristics, demographics, and laboratory results. Then, data were independently collected and entered into an Excel table (Microsoft Office 2020, USA) by 2 observers. The following clinical information was collected: Age, sex, vital signs (temperature, pulse rate, breath rate, and blood pressure), underlying disease (hypertension, diabetes mellitus, and pleural effusion), length of hospital stay, and the prognosis at 28 days following admission to the ICU. Within 24 h of admission to the ICU, the collected laboratory parameters included the results of blood culture, blood routine (white blood cells (×109/L), neutrophils (×109/L), lymphocytes (×109/L), hemoglobin (g/L), hematocrit (HCT,%), and platelet (PLT, ×109/L)), liver function (direct bilirubin (μmol/L), indirect bilirubin (μmol/L), total bilirubin (μmol/L), aspartate aminotransferase (AST, IU/L), alanine aminotransferase (ALT, IU/L), and albumin (ALB, g/L)), renal function (creatinine (Crea, μmol/L), uric acid (UA, μmol/L)), blood urea nitrogen (BUN, mmol/L), triglycerides (mg/dL), total cholesterol (mg/dL), lactate (LA, mmol/L), procalcitonin (PCT, μg/L) and C-reactive protein (CRP, mg/L). PCT/ALB ratio was estimated according to the PCT serum levels and ALB, and LA/ALB ratio was calculated based on the levels of serum LA and ALB. Additionally, the acute physiology and chronic health evaluation (APACHE) II and sequential organ failure assessment (SOFA) scores were estimated on the day of admission to the ICU.
Statistics
All statistics and plotting were conducted utilizing R version 4.2.3. Continuous variables were analyzed using the Mann-Whitney U test and expressed as the median and interquartile range (IQR). The enumeration data were adopted by chi-square test and reported as a percentage (%). Spearman correlation coefficient was employed to determine the relationship between the ratios of LA/ALB and PCT/ALB and the severity of sepsis (SOFA score). The receiver operating characteristic (ROC) curve was utilized to evaluate the abilities of LA/ALB, PCT/ALB, and SOFA scores on the prognosis of 28-day mortality in sepsis. Next, risk factors for 28-day mortality in sepsis were assessed using logistics regression analysis with best subsets variable reduction [26], and variables achieving univariate P<0.10 were included in multivariate logistic regression analysis. Furthermore, the optimum cutoff values from the ROC curve of LA/ALB (0.079) and PCT/ALB (0.256) in the derivation cohort were determined based on the Youden index, and the survival curves were plotted. The prediction model was developed using multivariate logistic regression analysis, and the nomogram was drawn. To assess the goodness of fit of the nomogram, the Hosmer-Lemeshow test was employed [27]. Then, utilizing the ROC curves and calibration plots, the internal validation of nomogram was accomplished, and decision curve analysis (DCA) was mapped to assess the clinical utility of predictive models. Finally, we validated the ability of LA/ALB and PCT/ALB to predict 28-day mortality in sepsis using data from 75 patients with sepsis at another medical institute, along with external validation of the prediction model. Differences with a P-value less than 0.05 were considered to be statistically significant (P<0.05).
Results
Elevated LA/ALB and PCT/ALB Ratios in Non-Survivors Compared to Those in Survivors
A total of 340 adult septic individuals meeting the clinical criteria for Sepsis-3.0, including 198 males and 142 females, having a median age of 56.0 years, were included in the derivation cohort. Then, these individuals were categorized into a survival group (n=238, 135 males and 103 females, median age 55.0 years) and a non-survival (n=102, 63 males and 39 females, median age 58.5 years) group based on the prognosis of septic individuals at 28 days. The clinical features and laboratory data of the survival and non-survival group are presented in Table 1. The median creatinine (Crea), lactate (LA), and procalcitonin (PCT) were significantly greater in non-survivors compared to those in survivors, and the median albumin (ALB) was lower in non-survivors in comparison with those in survivors (all P<0.05). According to the survival group, the ratio of serum LA to ALB (LA/ALB) (Figure 1A) and PCT to ALB (PCT/ALB) (Figure 1B) on ICU admission were also significantly elevated in the non-survival group (P<0.001). Meanwhile, non-survivors had significantly higher admission SOFA (Figure 1C) and APACHE II scores versus survivors (P<0.001).
Table 1.
The comparisons of clinical features between the survival and non-survival groups of septic individuals.
| Parameter | Total (n=340) | Survival (n=238) | Non-survival (n=102) | Z/χ2 | P-value |
|---|---|---|---|---|---|
| Patient characteristics | |||||
| Age, years | 56.00 (44.25–68.00) | 55.00 (44.75–66.25) | 58.50 (44.00–68.25) | −1.046 | 0.296 |
| Sex (male/female, n) | 198/142 | 135/103 | 63/39 | 3.510 | 0.061 |
| Constants | |||||
| Temperature (°C) | 36.60 (36.40–37.00) | 36.60 (36.30–37.10) | 36.60 (36.40–36.83) | −0.308 | 0.758 |
| Pulse rate (beats/min) | 90.50 (80.00–101.00) | 91.00 (79.75–105.00) | 90.00 (80.00–97.00) | −1.457 | 0.145 |
| Breath rate (beats/min) | 20.00 (19.00–21.00) | 20.00 (19.75–21.00) | 20.00 (18.00–22.00) | −0.105 | 0.917 |
| Systolic blood pressure (mmHg) | 115.00 (101.00–131.00) | 114.50 (100.75–130.00) | 118.50 (101.50–131.25) | −0.473 | 0.636 |
| Diastolic blood pressure (mmHg) | 70.00 (62.00–81.00) | 70.00 (62.00–81.00) | 69.00 (61.00–82.00) | −0.120 | 0.904 |
| Underlying disease (n, %) | |||||
| Hypertension | 82 (24.12) | 62 (26.05) | 20 (19.61) | 1.619 | 0.203 |
| Diabetes mellitus | 89 (26.18) | 59 (24.79) | 30 (29.41) | 0.789 | 0.374 |
| Pleural effusion | 40 (11.76) | 26 (10.92) | 14 (13.73) | 0.540 | 0.463 |
| Blood culture (n, %) | |||||
| Gram-positive rods | 94 (27.65%) | 63 (26.47%) | 31 (30.39%) | 0.549 | 0.459 |
| Gram-negative rods | 246 (72.35%) | 175 (73.53%) | 71 (69.61%) | ||
| Laboratory values | |||||
| White blood cells (×109/L) | 11.33 (7.77–16.25) | 11.14 (7.62–15.51) | 11.72 (8.96–16.87) | −1.692 | 0.091 |
| Neutrophils (×109/L) | 9.59 (6.02–13.93) | 9.40 (5.27–13.68) | 10.06 (7.27–14.88) | −1.501 | 0.133 |
| Lymphocytes (×109/L) | 0.84 (0.50–1.32) | 0.92 (0.50–1.33) | 0.79 (0.50–1.29) | −1.367 | 0.172 |
| Hemoglobin (g/L) | 119.5 (100.0–136.0) | 120.0 (102.0–135.0) | 116.0 (98.0–139.5) | −0.541 | 0.589 |
| HCT (%) | 35.2 (30.3–40.4) | 35.5 (31.3–40.0) | 33.9 (28.3–41.2) | −1.330 | 0.184 |
| Platelet (×109/L) | 123.50 (78.00–192.75) | 125.50 (81.00–192.25) | 122.00 (64.00–199.00) | −0.152 | 0.879 |
| Total bilirubin (μmol/L) | 16.30 (10.70–29.05) | 16.15 (10.78–26.63) | 18.50 (10.48–35.93) | −0.741 | 0.459 |
| Direct bilirubin (μmol/L) | 7.80 (4.70–14.35) | 7.30 (4.50–13.83) | 9.65 (5.25–17.83) | −1.768 | 0.077 |
| Indirect bilirubin (μmol/L) | 7.75 (4.65–12.70) | 7.90 (4.90–12.00) | 6.85 (4.10–13.50) | −0.736 | 0.462 |
| ALT (IU/L) | 32.00 (17.00–50.00) | 31.00 (17.00–51.25) | 33.50 (18.75–46.25) | −0.049 | 0.961 |
| AST (IU/L) | 35.00 (21.00–58.75) | 35.00 (20.00–59.50) | 36.00 (25.00–57.00) | −1.021 | 0.307 |
| Albumin (g/L) | 28.55 (25.70–31.00) | 29.10 (26.58–31.40) | 27.05 (23.25–30.35) | −3.461 | 0.001 |
| Creatinine (μmol/L) | 94.50 (64.00–158.50) | 88.50 (62.00–142.25) | 119.50 (69.75–189.00) | −2.684 | 0.007 |
| Blood urea nitrogen (mmol/L) | 8.70 (6.48–13.50) | 8.48 (6.67–12.92) | 10.33 (5.53–16.50) | −0.618 | 0.536 |
| Uric acid (μmol/L) | 308.50 (203.25–438.25) | 302.50 (207.00–417.25) | 328.50 (186.50–488.00) | −0.968 | 0.333 |
| Triglycerides (mg/dL) | 1.63 (1.08–2.41) | 1.60 (1.06–2.25) | 1.85 (1.09–2.64) | −1.538 | 0.124 |
| Total cholesterol (mg/dL) | 3.83 (2.88–4.87) | 3.74 (2.93–4.87) | 3.98 (2.73–4.87) | −0.440 | 0.660 |
| Lactate (mmol/L) | 1.70 (0.90–2.70) | 1.40 (0.90–2.20) | 2.20 (1.30–3.83) | −3.938 | <0.001 |
| CRP (mg/L) | 119.95 (61.40–177.80) | 120.44 (62.22–120.44) | 116.58 (60.14–186.93) | −0.201 | 0.841 |
| PCT (μg/L) | 2.10 (0.89–8.41) | 1.87 (0.82–5.66) | 3.75 (1.02–33.03) | −3.578 | <0.001 |
| PCT/ALB | 0.073 (0.030–0.325) | 0.066 (0.028–0.190) | 0.136 (0.040–1.128) | −3.951 | <0.001 |
| Lactate/ALB | 0.059 (0.033–0.097) | 0.052 (0.031–0.082) | 0.082 (0.046–0.177) | −4.290 | <0.001 |
| Disease severity | |||||
| SOFA (score) | 5.0 (4.0–7.0) | 4.0 (3.0–6.0) | 8.0 (6.0–9.0) | −9.844 | <0.001 |
| APACHE II (score) | 10.0 (7.0–13.0) | 9.0 (6.0–13.0) | 11.0 (10.0–15.0) | −4.341 | <0.001 |
| Length of hospital stay (days) | 13.00 (9.00–18.00) | 13.0 (9.00–18.25) | 12.0 (7.00–18.25) | −1.650 | 0.099 |
HCT – hematocrit; ALT – alanine aminotransferase; AST – aspartate aminotransferase; CRP – C-reactive protein; PCT – procalcitonin; ALB – albumin; SOFA – sequential organ failure assessment; APACHE – acute physiology and chronic health evaluation.
Figure 1.

The levels of LA/ALB, PCT/ALB, and the SOFA score in survival and non-survival of septic patients. (A) The levels of LA/ALB across survival and non-survival groups. (B) The levels of PCT/ALB across survival and non-survival groups. (C) The levels of SOFA score across survival and non-survival groups. n=238 (survival group) and 102 (non-survival group), respectively. **** P<0.0001. R version 4.2.3, The R Foundation, Vienna, Austria.
The Ratios of LA/ALB and PCT/ALB Were Connected to 28-Day Mortality in Individuals Suffering from Sepsis
To evaluate the correlation between disease severity (SOFA score) and laboratory indexes, a correlation network analysis was performed (Figure 2). The spearman correlation analysis demonstrated low positive correlations between SOFA score and LA/ALB (r=0.297, P<0.001), LA (r=0.280, P<0.001), PCT/ALB (r=0.251, P<0.001), APACHE II (r=0.232, P<0.001), Crea (r=0.182, P<0.001), and a weak negative association between SOFA score and ALB (r=−0.208, P<0.001).
Figure 2.
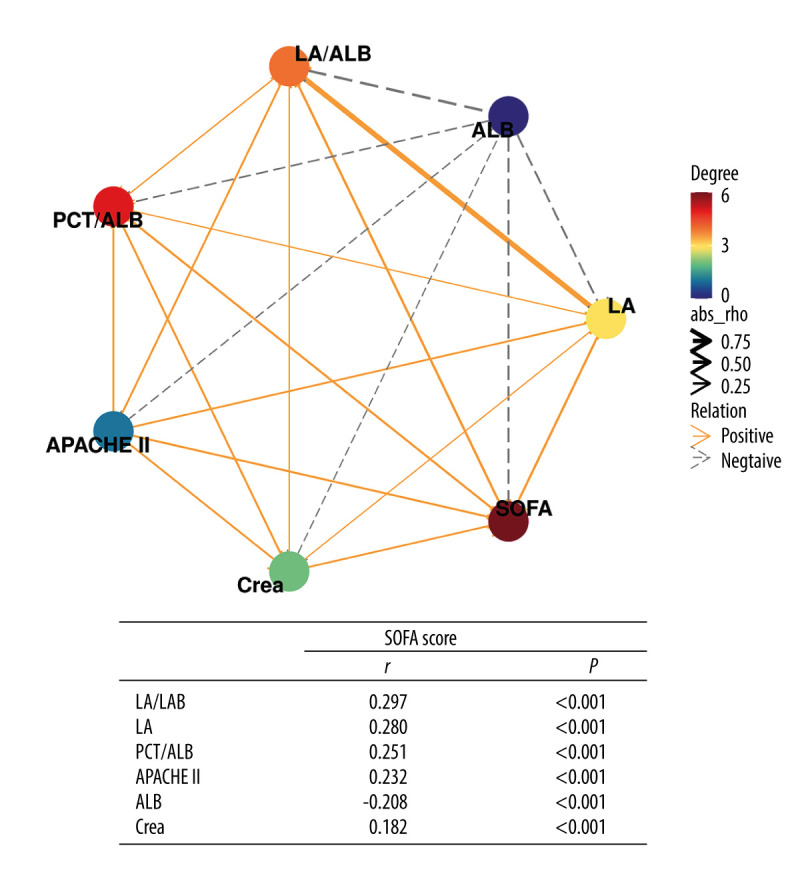
Correlation network of SOFA score with laboratory indexes (Spearman analysis). R version 4.2.3, The R Foundation, Vienna, Austria.
Furthermore, logistics regression analysis with best subsets variable reduction was performed to discover the independent risk factors of 28-day mortality in individuals with sepsis. Among the variables associated with 28-day mortality of sepsis patients in the univariate logistic regression analysis, PCT/ALB, LA/ALB, and SOFA score remained independent risks factors for 28-day mortality of sepsis patients in the multivariable analysis (Table 2).
Table 2.
ROC analysis of laboratory indexes for predicting the prognosis of individuals with sepsis.
| Index | Univariable | Multivariable | ||||
|---|---|---|---|---|---|---|
| OR | 95% CI | P | OR | 95% CI | P | |
| ALB | 0.90 | 0.85–0.95 | <0.001 | – | – | – |
| PCT | 1.02 | 1.01–1.02 | <0.001 | – | – | – |
| Creatinine | 1.00 | 1.00–1.00 | 0.063 | – | – | – |
| Lactate | 1.30 | 1.15–1.48 | <0.001 | – | – | – |
| PCT/ALB | 3.32 | 2.05–5.42 | <0.001 | 2.34 | 1.30–4.20 | 0.004 |
| Lactate/ALB | 3.34 | 2.01–5.59 | <0.001 | 1.64 | 1.31–2.94 | 0.025 |
| APACHE II | 1.07 | 1.03–1.12 | <0.001 | – | – | – |
| SOFA | 1.58 | 1.41–1.78 | <0.001 | 1.49 | 1.33–1.68 | <0.001 |
Performance of multivaiate model: Number in dataframe=340, Number in model=340, Missing=0, AIC=326.4, C-statistic=0.838, H&L=Chi-sq(8) 21.93 (P=0.005).
The Ability of Ratios of LA/ALB and PCT/ALB to Predict 28-Day Mortality in Septic Patients
Next, we used the ratios of LA/ALB and PCT/ALB to develop a receiver operating characteristic (ROC) curve analysis for predictive assessment of 28-day mortality in individuals with sepsis (Table 3). The area under the curve (AUC) of LA/ALB was 0.65 (95% CI 0.59–0.70), with 53.9% sensitivity and 74.4% specificity, which was greater than those in the AUC for PCT (AUC=0.62), ALB (AUC=0.62), lactate (AUC=0.64), creatinine (AUC=0.59), PCT/ALB (AUC=0.64) and APACHE II (AUC=0.64), but lower than SOFA score (AUC=0.83). The AUC of PCT/ALB combined with LA/ALB and SOFA score was 0.83, with sensitivity rising from 73.5% to 80.4% compared to the SOFA score alone.
Table 3.
Logistic regression with best subsets variable reduction.
| laboratory indexes | AUC (95% CI) | Cut off-value | z-Value | Youden index J | P-Value | Sensitivity | Specificity |
|---|---|---|---|---|---|---|---|
| PCT (μg/L) | 0.62 (0.57–0.67) | 8.03 | 3.53 | 0.24 | <0.001 | 42.2% | 81.9% |
| Albumin (g/L) | 0.62 (0.56–0.67) | 24.70 | 3.25 | 0.23 | 0.001 | 34.3% | 89.1% |
| Lactate (mmol/L) | 0.64 (0.58–0.69) | 2.40 | 3.89 | 0.27 | <0.001 | 47.1% | 79.8% |
| Creatinine (μmol/L) | 0.59 (0.54–0.65) | 99.00 | 2.66 | 0.20 | 0.008 | 60.8% | 58.8% |
| PCT/ALB | 0.64 (0.58–0.69) | 0.256 | 3.95 | 0.25 | <0.001 | 43.1% | 81.5% |
| LA/ALB | 0.65 (0.59–0.70) | 0.079 | 4.23 | 0.29 | <0.001 | 53.9% | 74.4% |
| APACHE II (score) | 0.64 (0.59–0.69) | 8.0 | 4.82 | 0.28 | <0.001 | 84.3% | 44.1% |
| SOFA (score) | 0.83 (0.79–0.87) | 6.0 | 13.59 | 0.58 | <0.001 | 73.5% | 84.9% |
| PCT/ALB+LA/ALB | 0.70 (0.64–0.75) | – | 5.95 | 0.37 | <0.001 | 56.9% | 79.8% |
| PCT/ALB+SOFA | 0.83 (0.79–0.87) | – | 10.95 | 0.53 | <0.001 | 75.3% | 79.8% |
| LA/ALB+SOFA | 0.83 (0.79–0.87) | – | 12.94 | 0.60 | <0.001 | 77.5% | 80.6% |
| PCT/ALB+ LA/ALB+SOFA | 0.83 (0.79–0.87) | – | 13.95 | 0.61 | <0.001 | 80.4% | 80.7% |
The ratios cut point in PCT/ALB+LA/ALB+SOFA variables the same as PCT/ALB, LA/ALB and SOFA alone (0.256,0.079, and 6 respectively).
Based on Youden’s index from the ROC curve in the derivation cohort, the result of optimal cutoff value of LA/ALB was 0.079 (Figure 3A), and the result of optimal cutoff value of PCT/ALB was 0.256 (Figure 3B), Kaplan-Meier survival analysis curves were constructed. Septic patients with higher ratios of LA/ALB and PCT/ALB had significantly higher 28-day mortality.
Figure 3.

Kaplan-Meier survival curves of 340 adult septic patients based on the LAC/ALB (A) cutoff value (0.079) and PCT/ALB (B) cutoff value (0.256) on the day of ICU admission. R version 4.2.3, The R Foundation, Vienna, Austria.
Columnar Plots to Predict the 28-Day Mortality in Patients with Sepsis Using LA/ALB Ratio, PCT/ALB Ratio, and SOFA Score
According to the multivariate logistic regression model, the model having the highest score was chosen, and a predictive nomogram was constructed to assess the risk of 28-day mortality of sepsis patients (Figure 4). However, because LA/ALB ratio (LAR), PCT/ALB ratio (PAR), and SOFA score were nonnormal data, these continuous parameters were dichotomized by ROC curve-derived optimal cutoff values. The scores associated with the column line plots were 32 for LAR ≥0.079, 30 for PAR ≥0.256, and 100 for SOFA score ≥6.0, and the speculated probabilities were 0.1–0.8 for total integrals 22–174.
Figure 4.

Nomogram for predicting the prognosis of septic patients. Nomogram, to draw an upward vertical line to the “Points” bar to calculate points. Based on the sum, draw a downward vertical line from the “Total Points” line to calculate the probability of 28-d mortality in sepsis for each patient. R version 4.2.3, The R Foundation, Vienna, Austria.
Then, the performance of the nomogram was estimated using the ROC curve and calibration plot. The model’s AUC value was 0.826 (0.723–0.843), indicating that the predictive model has a degree of discrimination (Figure 5A). Hosmer-Lemeshow test outcomes revealed no statistically significant variation between the model’s risk predicted values and the actual observed values (χ2=2.623, P=0.758). Furthermore, the calibration plot for the probability of 28-day mortality revealed good agreement between the prediction by nomogram and actual observation (Figure 5B).
Figure 5.

The validation of a predictive model for the prognosis of septic patients. (A) ROC curve of the prediction model for the prognosis of septic patients. (B) Calibration curve of the model for the prognosis of septic patients. R version 4.2.3, The R Foundation, Vienna, Austria.
Clinical Utility of a Model for Risk Of 28-Day Mortality in Sepsis Patients
The clinical decision curves for the risk of 28-day mortality in the sepsis model revealed that the model has clinical utility when the risk threshold varies from 0.07 to 0.74 (Figure 6).
Figure 6.
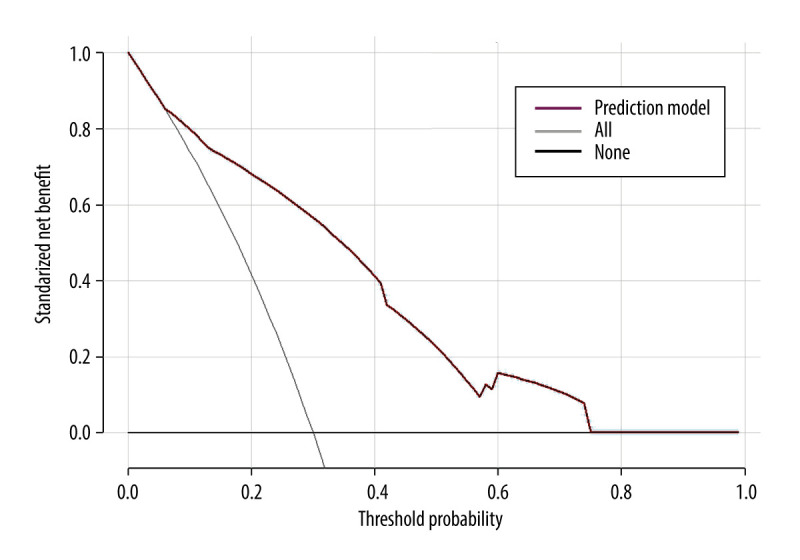
Clinical decision curve for the prognosis of septic patients. (X: probability with value, Y: net benefit, black line: hypothesis of no death in all septic patients, gray line: hypothesis of death in all septic patients). R version 4.2.3, The R Foundation, Vienna, Austria.
Validation of Prognostic Models Based on External Cohort
To confirm the predictive values of LAR and PAR, 75 sex- and age-matched adult septic patients from another medical institute were included in the external confirmation cohort (Table 4). In the validation cohort, non-surviving septic patients also had significantly higher LA/ALB ratio, PCT/ALB ratio, and SOFA score than survivors on ICU admission (Table 5). Notably, in the validation cohort the AUC of PCT/ALB combined with LA/ALB and SOFA score was 0.91 (0.82–0.96), with 94.6% of sensitivity and 71.1% specificity, rising from 0.86 for the SOFA score alone (Table 6).
Table 4.
The comparisons of clinical features between the derivation cohort and validation cohort of septic patients.
| Parameter | Total (n=415) | Derivation cohort (n=340) | Validation cohort (n=75) | Z/χ2 | P-value |
|---|---|---|---|---|---|
| Patient characteristics | |||||
| Age, years | 56.00 (44.00–68.00) | 56.00 (44.25–68.00) | 61.00 (44.00–71.00) | −0.931 | 0.352 |
| Sex (male/female, n) | 248/167 | 198/142 | 50/25 | 1.816 | 0.178 |
| Constants | |||||
| Temperature (°C) | 36.60 (36.40–37.10) | 36.60 (36.40–37.00) | 36.80 (36.40–38.00) | −1.827 | 0.068 |
| Pulse rate (beats/min) | 92.00 (82.00–104.00) | 90.50 (80.00–101.00) | 100.00 (88.00–113.00) | −4.360 | <0.001 |
| Breath rate (beats/min) | 20.00 (19.00–21.00) | 20.00 (19.00–21.00) | 20.00 (15.00–23.00) | −1.205 | 0.228 |
| Systolic blood pressure (mmHg) | 117.00 (103.00–131.00) | 115.00 (101.00–131.00) | 124.00 (110.00–137.00) | −2.458 | 0.014 |
| Diastolic blood pressure (mmHg) | 70.00 (62.00–81.00) | 70.00 (62.00–81.00) | 70.00 (62.00–81.00) | −1.665 | 0.096 |
| Underlying disease (n, %) | |||||
| Hypertension | 99 (23.86) | 82 (24.12) | 17 (22.67) | 0.071 | 0.790 |
| Diabetes mellitus | 98 (23.61) | 89 (26.18) | 9 (12.00) | 6.846 | 0.009 |
| Pleural effusion | 45 (10.84) | 40 (11.76) | 5 (6.67) | 1.652 | 0.199 |
| Blood culture (n,%) | |||||
| Gram-positive rods | 114 (27.47) | 94 (27.65%) | 20 (26.67) | 0.030 | 0.863 |
| Gram-negative rods | 301 (72.53) | 246 (72.35%) | 55 (73.33) | ||
| Laboratory values | |||||
| White blood cells (×109/L) | 11.61 (8.02–16.49) | 11.33 (7.77–16.25) | 12.27 (9.66–17.97) | −2.209 | 0.042 |
| Neutrophils (×109/L) | 9.86 (6.57–14.61) | 9.59 (6.02–13.93) | 10.57 (8.49–15.13) | −2.172 | 0.030 |
| Lymphocytes (×109/L) | 0.82 (0.50–1.29) | 0.84 (0.50–1.32) | 0.71 (0.47–1.08) | −1.555 | 0.120 |
| HCT (%) | 35.2 (30.0–40.6) | 35.2 (30.3–40.4) | 35.0 (28.3–41.4) | −0.047 | 0.962 |
| Platelet (×109/L) | 123.00 (75.00–192.00) | 123.50 (78.00–192.75) | 117.00 (55.00–175.00) | −1.117 | 0.264 |
| Total bilirubin (μmol/L) | 16.80 (10.80–29.60) | 16.30 (10.70–29.05) | 18.80 (11.70–31.70) | −1.412 | 0.158 |
| Albumin (g/L) | 28.70 (25.80–31.20) | 28.55 (25.70–31.00) | 28.90 (26.70–32.70) | −1.743 | 0.081 |
| Creatinine (μmol/L) | 97.00 (64.00–160.00) | 94.50 (64.00–158.50) | 101.00 (63.00–176.00) | −0.533 | 0.594 |
| Blood urea nitrogen (mmol/L) | 8.84 (6.44–13.50) | 8.70 (6.48–13.50) | 9.39 (5.68–13.97) | −0.401 | 0.688 |
| Uric acid (μmol/L) | 302.00 (190.00–440.00) | 308.50 (203.25–438.25) | 269.00 (143.00–470.00) | −1.096 | 0.273 |
| Lactate (mmol/L) | 1.70 (1.00–2.90) | 1.70 (0.90–2.70) | 1.70 (1.10–3.20) | −1.223 | 0.221 |
| CRP (mg/L) | 117.93 (62.28–179.80) | 119.95 (61.40–177.80) | 104.29 (65.51–182.80) | −0.163 | 0.870 |
| PCT (μg/L) | 2.17 (0.92–9.76) | 2.10 (0.89–8.41) | 3.93 (0.96–13.02) | −1.754 | 0.079 |
| PCT/ALB | 0.077 (0.031–0.367) | 0.073 (0.030–0.325) | 0.131 (0.034–0.480) | −1.521 | 0.128 |
| Lactate/ALB | 0.061 (0.034–0.098) | 0.059 (0.033–0.097) | 0.063 (0.037–0.100) | −0.903 | 0.367 |
| Disease severity | |||||
| SOFA (score) | 6.0 (4.0–8.0) | 5.0 (4.0–7.0) | 8.0 (5.5–10.5) | −5.259 | <0.001 |
| Length of hospital stay (days) | 14.00 (9.00–20.00) | 13.00 (9.00–18.00) | 17.00 (12.00–26.00) | −3.267 | 0.001 |
HCT – hematocrit; ALT – alanine aminotransferase; AST – aspartate aminotransferase; CRP – C-reactive protein; PCT – procalcitonin; ALB – albumin; SOFA – sequential organ failure assessment; APACHE – acute physiology and chronic health evaluation.
Table 5.
The comparisons of clinical characteristics between the survival and non-survival groups of septic individuals (validation cohort).
| Parameter | Total (n=75) | Survival (n=38) | Non-survival (n=37) | Z/χ2 | P-value |
|---|---|---|---|---|---|
| Patient characteristics | |||||
| Age, years | 61.00 (44.00–71.00) | 50.00 (35.00–70.50) | 63.00 (49.50–71.50) | −1.552 | 0.128 |
| Sex (male/female, n) | 50/25 | 26/12 | 24/13 | 0.107 | 0.744 |
| Constants | |||||
| Temperature (°C) | 36.80 (36.40–38.00) | 36.60 (36.35–38.05) | 36.90 (36.50–37.85) | −0.435 | 0.663 |
| Pulse rate (beats/min) | 100.00 (88.00–113.00) | 101.00 (87.50–110.75) | 99.00 (89.00–116.50) | −0.297 | 0.767 |
| Breath rate (beats/min) | 20.00 (15.00–23.00) | 20.00 (15.00–24.25) | 20.00 (15.00–22.00) | −0.359 | 0.720 |
| Systolic blood pressure (mmHg) | 124.00 (110.00–137.00) | 124.00 (110.00–137.50) | 125.00 (106.50–136.50) | −0.095 | 0.924 |
| Diastolic blood pressure (mmHg) | 70.00 (62.00–81.00) | 75.00 (64.50–85.25) | 70.00 (65.00–83.50) | −0.636 | 0.525 |
| Underlying disease (n,%) | |||||
| Hypertension | 17 (22.67) | 10 (13.33) | 7 (18.92) | 0.585 | 0.444 |
| Diabetes mellitus | 9 (12.00) | 5 (13.16) | 4 (10.81) | 0.098 | 0.754 |
| Pleural effusion | 5 (6.67) | 3 (7.89) | 2 (5.41) | 0.187 | 0.666 |
| Blood culture (n, %) | |||||
| Gram-positive rods | 20 (26.67) | 8 (21.05) | 12 (32.43) | 1.241 | 0.265 |
| Gram-negative rods | 55 (73.33) | 30 (78.95) | 25 (67.57) | ||
| Laboratory values | |||||
| White blood cells (×109/L) | 12.27 (9.66–17.97) | 14.69 (8.73–18.74) | 11.65 (10.00–16.70) | −0.784 | 0.433 |
| Neutrophils (×109/L) | 10.57 (8.49–15.13) | 12.75 (7.83–15.83) | 10.44 (8.67–14.82) | −0.848 | 0.397 |
| Lymphocytes (×109/L) | 0.71 (0.47–1.08) | 0.76 (0.43–1.12) | 0.67 (0.437–1.10) | −0.503 | 0.615 |
| HCT (%) | 35.0 (28.3–41.4) | 33.4 (28.6–39.1) | 37.5 (28.3–46.1) | −1.681 | 0.093 |
| Platelet (×109/L) | 117.00 (55.00–175.00) | 112.50 (49.75–145.25) | 121.00 (59.50–195.00) | −0.853 | 0.394 |
| Total bilirubin (μmol/L) | 18.80 (11.70–31.70) | 16.30 (12.00–31.55) | 19.30 (10.90–37.95) | −0.408 | 0.683 |
| Albumin (g/L) | 28.90 (26.70–32.70) | 31.20 (28.00–35.05) | 27.30 (25.55–30.00) | −3.132 | 0.002 |
| Creatinine (μmol/L) | 101.00 (63.00–176.00) | 95.00 (60.00–161.25) | 114.00 (71.50–221.00) | −1.325 | 0.185 |
| Blood urea nitrogen (mmol/L) | 9.39 (5.68–13.97) | 7.96 (4.86–12.27) | 10.37 (6.81–16.19) | −1.092 | 0.275 |
| Uric acid (μmol/L) | 269.00 (143.00–470.00) | 255.00 (141.50–481.75) | 282.00 (143.50–455.00) | −0.064 | 0.949 |
| Lactate (mmol/L) | 1.70 (1.10–3.20) | 1.40 (1.00–2.18) | 2.20 (1.65–4.10) | −3.395 | 0.001 |
| CRP (mg/L) | 104.29 (65.51–182.80) | 97.36 (59.37–175.38) | 121.33 (72.77–194.53) | −0.858 | 0.391 |
| PCT (μg/L) | 3.93 (0.96–13.02) | 1.46 (0.91–5.34) | 6.42 (3.96–17.43) | −3.069 | 0.002 |
| PCT/ALB | 0.131 (0.034–0.480) | 0.039 (0.029–0.182) | 0.090 (0.062–0.154) | −3.222 | 0.001 |
| Lactate/ALB | 0.063 (0.037–0.100) | 0.038 (0.032–0.077) | 0.255 (0.132–0.602) | −3.794 | <0.001 |
| Disease severity | |||||
| SOFA (score) | 8.0 (5.5–10.5) | 6.0 (4.0–7.0) | 10.0 (8.0–12.0) | −5.324 | <0.001 |
| Length of hospital stay (days) | 17.00 (12.00–26.00) | 19.00 (15.75–26.00) | 13.00 (6.50–27.50) | −2.847 | 0.004 |
HCT – hematocrit; ALT – alanine aminotransferase; AST – aspartate aminotransferase; CRP – C-reactive protein; PCT – procalcitonin; ALB – albumin; SOFA – sequential organ failure assessment; APACHE – acute physiology and chronic health evaluation.
Table 6.
ROC analysis of laboratory indexes for predicting the prognosis of individuals with sepsis (validation cohort).
| laboratory indexes | AUC (95% CI) | z-Value | Youden index J | P-Value | Sensitivity | Specificity |
|---|---|---|---|---|---|---|
| PCT (μg/L) | 0.71 (0.59–0.81) | 3.14 | 0.60 | 0.002 | 83.8% | 76.3% |
| Albumin (g/L) | 0.71 (0.59–0.81) | 3.41 | 0.39 | <0.001 | 83.8% | 55.3% |
| Lactate (mmol/L) | 0.73 (0.61–0.82) | 3.85 | 0.36 | <0.001 | 81.1% | 55.3% |
| PCT/ALB | 0.72 (0.62–0.81) | 3.39 | 0.57 | <0.001 | 81.1% | 76.3% |
| LA/ALB | 0.76 (0.64–0.85) | 4.41 | 0.47 | <0.001 | 91.9% | 55.3% |
| SOFA (score) | 0.86 (0.76–0.93) | 8.29 | 0.69 | <0.001 | 83.8% | 76.3% |
| PCT/ALB+LA/ALB | 0.79 (0.69–0.88) | 5.57 | 0.55 | <0.001 | 75.7% | 78.9% |
| PCT/ALB+LA/ALB+SOFA | 0.91 (0.82–0.96) | 12.34 | 0.66 | <0.001 | 94.6% | 71.1% |
The ratios cut point in PCT/ALB+LA/ALB+SOFA variables the same as PCT/ALB, LA/ALB and SOFA alone (0.256,0.079, and 6 respectively).
Finally, to evaluate the performances of columnar plots, we used the independent cohort for external validation. The model performed well within both the derivation cohort and the confirmation cohort (Figure 7). Decision curve analysis (DCA) confirmed the predictive value of our prognostic model in the validation cohort, which has value for clinical use when the risk threshold extends from 0.04 to 0.84 in the validation cohort.
Figure 7.

The validation of a predictive model for the prognosis of septic patients (validation cohort). (A) ROC curve of the prediction model for the prognosis of septic patients (validation cohort). (B) Calibration curve of the model for the prognosis of septic patients (validation cohort). (C) Clinical decision curve for the prognosis of septic patients (validation cohort). R version 4.2.3, The R Foundation, Vienna, Austria.
Discussion
Currently, there is still a lack of efficient biomarkers to assess the prognosis of septic patients on ICU admission [28]. Our study found that LA/ALB and PCT/ALB ratios on the first day of admission to the ICU helped assess 28-day mortality in individuals with sepsis. These results provide evidence supporting our observations: (1) The LA/ALB and PCT/ALB ratios of septic patients in the mortality group were higher than those in the survival group; (2) The spearman correlation analysis revealed a weak positive relationship between LA/ALB ratio, PCT/ALB ratio, and the SOFA score; (3) The survival analysis revealed that higher LA/ALB and PCT/ALB ratios were correlated with shorter survival times of septic patients; (4) The nomogram was constructed using LA/ALB, PCT/ALB, and SOFA scores in the derivation cohort, and the AUC of prognostic model was 0.826, indicating that the prediction model had some discriminatory power; (5) Most importantly, these findings were also validated in the validation cohort.
Lactate, a biomarker of tissue hypoxia, is increased following reperfusion. Elevated lactate levels had been shown to correlate with the case fatality rate and were widely used in the early prognosis, management, and risk stratification in individuals who are experiencing septic shock [29], which was in accordance with our study. This investigation revealed that the prognosis of septic individuals having lactate more than 2.40 mmol/L within 24 h of ICU admission may be worse. Serum albumin, as an acute-phase negative protein, can be used as a sepsis biomarker of patient prognosis [15,30]. Similar to previous studies [31], we found lower albumin levels in the septic patients on the day of admittance to the ICU in the mortality group than those in the survival group. Furthermore, many studies confirmed that serum PCT has a positive correlation between sepsis diagnosis and prognosis; both have a good positive correlation [5]. Again, this provides support for our results. In conclusion, the individual value of PCT, lactate, and ALB levels change in patients with sepsis is clear, but the role and correlation between the above indicators reflecting the severity of sepsis are different, and the applications of PCT/ALB and LA/ALB may be more valuable. A study of 274 patients with sepsis found that the LA/ALB ratio on the day of admission was an independent risk factor for 28-day mortality in individuals with sepsis, with an optimal cutoff value of 0.16 for LA/ALB [22]. However, the optimal cutoff value in our study was 0.079, which still needs further confirmation. Another study of 128 adult septic patients confirmed that the PCT/ALB ratio was a crucial predictor of infectious shock and 28-day mortality in septic patients. This gives further support to our study [32].
Given the complexity of immune disorders in sepsis, a single biomarker is unsuitable for assessing the prognosis of sepsis [18]; therefore, we tried to combine the metabolic state, inflammatory state, and nutritional state of septic patients to assess the prognosis. Of note, LA/ALB and PCT/ALB ratios have many practical implications in the prognostic assessment of sepsis. At first, PCT, lactate, and ALB were routine laboratory testing indicators for patients admitted to the ICU, which are now widely performed in the clinic, and easy to obtain relevant data. Second, numerous studies confirmed that PCT, lactate, and albumin are associated with sepsis prognosis [14,33,34]. On this basis, differences in ratio-based indicators are often more pronounced and better utilized to assess the prognosis of septic patients. Lastly, after effective treatment, these indicators change significantly and facilitate the assessment of treatment effects. Meanwhile, these indicators make it easy to achieve real-time monitoring, which helps to dynamically and continuously assess the condition of sepsis patients.
The SOFA score is an important clinically recognized tool for diagnosing sepsis, indicating disease severity, and predicting mortality [35]. Based on our study, SOFA was likewise the best tool to predict 28-day mortality in individuals with sepsis. To improve the prognostic evaluation of patients with sepsis, we constructed a nomogram using LA/ALB, PCT/ALB, and SOFA scores, and found that SOFA score had a relatively strong influence (higher weighting) in the predictive nomogram. Notably, the nomogram based on these 3 factors showed good predictive performance (Figure 5–7). To further confirm the validity of the nomogram, we collected data from 75 patients with sepsis at another medical institution for external validation, confirming our findings. There are several strengths of our prognostic model: 1) The present prognostic models pertaining to sepsis were predominantly developed utilizing databases [36–38], thereby possessing restricted generalizability, and our model is more suitable for our region; 2) We collected comprehensive data from institutional electronic medical records, and we employed a rigorous statistical methodology that utilized the selection criteria of the lowest AIC value and the least number of predictors to determine the optimal model [39], further ensuring the validity and reliability of our results; 3) Our prognostic model used only data that are available at the time of patient admission to the ICU, thereby providing an early forecast of 28-day mortality in sepsis.
Limitations
Despite these findings, there are some restrictions associated with this investigation. Initially, as a retrospective analysis, although our study included medical centers in 2 different regions, selection bias could not be ruled out, while the sample size was limited, and a large prospective study of multiple centers is needed to confirm our findings. Second, the complex and unstable conditions of sepsis patients admitted to the ICU make it challenging to thoroughly assess the pre-admission background of these individuals, including the categorization of the source of sepsis and the days leading up to their ICU admission. Third, the investigation was performed only in adult septic individuals, but the increasing incidence of neonatal and pediatric sepsis requires further study to determine if it is useful to evaluate the prognosis of pediatric sepsis patients and neonatal sepsis patients. Fourth, we only evaluated the prognosis of sepsis by the above indicators on the day of admission to the ICU, and it is unclear whether changes in the patient’s condition cause changes in the above indicators after the clinical intervention, so dynamic monitoring of the above indicators can better assess the effect of treatment. Finally, although a predictive model was developed and validated, its predictive value is still limited, and as much clinical data as possible needs to be added to increase the model’s sensitivity and improve the prognostic prediction of septic patients.
Conclusions
In summary, our study found that LA/ALB and PCT/ALB ratios on the day of admission to the ICU were potential biomarkers to predict 28-day mortality in individuals with sepsis, while prediction models showed that LA/ALB and PCT/ALB ratios combined with SOFA score could better predict 28-day mortality in individuals with sepsis, but more prospective analyses are needed.
Acknowledgments
We thank all the patients participating in this study. We would also like to express our gratitude to Home for Researchers (www.home-for-researchers.com) for English language editing services.
Footnotes
Conflict of interest: None declared
Publisher’s note: All claims expressed in this article are solely those of the authors and do not necessarily represent those of their affiliated organizations, or those of the publisher, the editors and the reviewers. Any product that may be evaluated in this article, or claim that may be made by its manufacturer, is not guaranteed or endorsed by the publisher
Declaration of Figures’ Authenticity
All figures submitted have been created by the authors, who confirm that the images are original with no duplication and have not been previously published in whole or in part.
Financial support: None declared
References
- 1.Salluh JIF, Soares M, Singer M. Spreading the knowledge on the epidemiology of sepsis. Lancet Infect Dis. 2017;17(11):1104–6. doi: 10.1016/S1473-3099(17)30480-2. [DOI] [PubMed] [Google Scholar]
- 2.van den Berg M, van Beuningen FE, Ter Maaten JC, Bouma HR. Hospital-related costs of sepsis around the world: A systematic review exploring the economic burden of sepsis. J Crit Care. 2022;71:154096. doi: 10.1016/j.jcrc.2022.154096. [DOI] [PubMed] [Google Scholar]
- 3.Kempker JA, Martin GS. A global accounting of sepsis. Lancet. 2020;395(10219):168–70. doi: 10.1016/S0140-6736(19)33065-X. [DOI] [PubMed] [Google Scholar]
- 4.Xie J, Wang H, Kang Y, et al. The epidemiology of sepsis in Chinese ICUs: A national cross-sectional survey. Crit Care Med. 2020;48(3):e209–e18. doi: 10.1097/CCM.0000000000004155. [DOI] [PubMed] [Google Scholar]
- 5.Schuetz P, Birkhahn R, Sherwin R, et al. Serial procalcitonin predicts mortality in severe sepsis patients: Results from the Multicenter Procalcitonin MOnitoring SEpsis (MOSES) study. Crit Care Med. 2017;45(5):781–89. doi: 10.1097/CCM.0000000000002321. [DOI] [PMC free article] [PubMed] [Google Scholar]
- 6.Yang Y, Xie J, Guo F, et al. Combination of C-reactive protein, procalcitonin and sepsis-related organ failure score for the diagnosis of sepsis in critical patients. Ann Intensive Care. 2016;6(1):51. doi: 10.1186/s13613-016-0153-5. [DOI] [PMC free article] [PubMed] [Google Scholar]
- 7.Dellinger RP, Levy MM, Rhodes A, et al. Surviving Sepsis Campaign: International guidelines for management of severe sepsis and septic shock, 2012. Intensive Care Med. 2013;39(2):165–228. doi: 10.1007/s00134-012-2769-8. [DOI] [PMC free article] [PubMed] [Google Scholar]
- 8.Rhodes B, Merriman ME, Harrison A, et al. A genetic association study of serum acute-phase C-reactive protein levels in rheumatoid arthritis: Implications for clinical interpretation. PLoS Med. 2010;7(9):e1000341. doi: 10.1371/journal.pmed.1000341. [DOI] [PMC free article] [PubMed] [Google Scholar]
- 9.Becker KL, Snider R, Nylen ES. Procalcitonin assay in systemic inflammation, infection, and sepsis: Clinical utility and limitations. Crit Care Med. 2008;36(3):941–52. doi: 10.1097/CCM.0B013E318165BABB. [DOI] [PubMed] [Google Scholar]
- 10.Schuetz P, Christ-Crain M, Muller B. Procalcitonin and other biomarkers to improve assessment and antibiotic stewardship in infections – hope for hype? Swiss Med Wkly. 2009;139(23–24):318–26. doi: 10.4414/smw.2009.12584. [DOI] [PubMed] [Google Scholar]
- 11.Wu C, Ma J, Yang H, et al. Interleukin-37 as a biomarker of mortality risk in patients with sepsis. J Infect. 2021;82(3):346–54. doi: 10.1016/j.jinf.2021.01.019. [DOI] [PubMed] [Google Scholar]
- 12.Tu H, Lai X, Li J, et al. Interleukin-26 is overexpressed in human sepsis and contributes to inflammation, organ injury, and mortality in murine sepsis. Crit Care. 2019;23(1):290. doi: 10.1186/s13054-019-2574-7. [DOI] [PMC free article] [PubMed] [Google Scholar]
- 13.Wu YL, Yo CH, Hsu WT, et al. Accuracy of heparin-binding protein in diagnosing sepsis: A systematic review and meta-analysis. Crit Care Med. 2021;49(1):e80–e90. doi: 10.1097/CCM.0000000000004738. [DOI] [PubMed] [Google Scholar]
- 14.Nguyen HB, Kuan WS, Batech M, et al. Outcome effectiveness of the severe sepsis resuscitation bundle with addition of lactate clearance as a bundle item: A multi-national evaluation. Crit Care. 2011;15(5):R229. doi: 10.1186/cc10469. [DOI] [PMC free article] [PubMed] [Google Scholar]
- 15.Yin M, Si L, Qin W, et al. Predictive value of serum albumin level for the prognosis of severe sepsis without exogenous human albumin administration: A prospective cohort study. J Intensive Care Med. 2018;33(12):687–94. doi: 10.1177/0885066616685300. [DOI] [PubMed] [Google Scholar]
- 16.Gao X, Liu Y, Xu F, et al. Assessment of apoptosis inhibitor of macrophage/CD5L as a biomarker to predict mortality in the critically ill with sepsis. Chest. 2019;156(4):696–705. doi: 10.1016/j.chest.2019.04.134. [DOI] [PubMed] [Google Scholar]
- 17.Li F, Zhang Y, Yu B, et al. Evaluation of the diagnostic and prognostic values of serum HSP90alpha in sepsis patients: A retrospective study. Peer J. 2022;10:e12997. doi: 10.7717/peerj.12997. [DOI] [PMC free article] [PubMed] [Google Scholar]
- 18.Povoa P, Coelho L, Dal-Pizzol F, et al. How to use biomarkers of infection or sepsis at the bedside: guide to clinicians. Intensive Care Med. 2023;49(2):142–53. doi: 10.1007/s00134-022-06956-y. [DOI] [PMC free article] [PubMed] [Google Scholar]
- 19.van der Poll T, van de Veerdonk FL, Scicluna BP, Netea MG. The immunopathology of sepsis and potential therapeutic targets. Nat Rev Immunol. 2017;17(7):407–20. doi: 10.1038/nri.2017.36. [DOI] [PubMed] [Google Scholar]
- 20.Pierrakos C, Velissaris D, Bisdorff M, et al. Biomarkers of sepsis: Time for a reappraisal. Crit Care. 2020;24(1):287. doi: 10.1186/s13054-020-02993-5. [DOI] [PMC free article] [PubMed] [Google Scholar]
- 21.Gharipour A, Razavi R, Gharipour M, Mukasa D. Lactate/albumin ratio: An early prognostic marker in critically ill patients. Am J Emerg Med. 2020;38(10):2088–95. doi: 10.1016/j.ajem.2020.06.067. [DOI] [PubMed] [Google Scholar]
- 22.Li Y, Li D, Yuan X, et al. [Predictive value of early lactate/albumin ratio in the prognosis of sepsis]. Zhonghua Wei Zhong Bing Ji Jiu Yi Xue. 2023;35(1):61–65. doi: 10.3760/cma.j.cn121430-20220130-00108. [in Chinese] [DOI] [PubMed] [Google Scholar]
- 23.Bou Chebl R, Geha M, Assaf M, et al. The prognostic value of the lactate/albumin ratio for predicting mortality in septic patients presenting to the emergency department: a prospective study. Ann Med. 2021;53(1):2268–77. doi: 10.1080/07853890.2021.2009125. [DOI] [PMC free article] [PubMed] [Google Scholar]
- 24.Li T, Li X, Liu X, et al. Association of procalcitonin to albumin ratio with the presence and severity of sepsis in neonates. J Inflamm Res. 2022;15:2313–21. doi: 10.2147/JIR.S358067. [DOI] [PMC free article] [PubMed] [Google Scholar]
- 25.Singer M, Deutschman CS, Seymour CW, et al. The Third International Consensus Definitions for Sepsis and Septic Shock (Sepsis-3) JAMA. 2016;315(8):801–10. doi: 10.1001/jama.2016.0287. [DOI] [PMC free article] [PubMed] [Google Scholar]
- 26.Calcagno V, De CM. glmulti: An R package for easy automated model selection with (generalized) linear models. Journal of Statistical Software. 2010;34(12):1–29. [Google Scholar]
- 27.Lemeshow S, Hosmer DW., Jr A review of goodness of fit statistics for use in the development of logistic regression models. Am J Epidemiol. 1982;115(1):92–106. doi: 10.1093/oxfordjournals.aje.a113284. [DOI] [PubMed] [Google Scholar]
- 28.Coopersmith CM, De Backer D, Deutschman CS, et al. Surviving Sepsis Campaign: Research priorities for sepsis and septic shock. Crit Care Med. 2018;46(8):1334–56. doi: 10.1097/CCM.0000000000003225. [DOI] [PubMed] [Google Scholar]
- 29.Casserly B, Phillips GS, Schorr C, et al. Lactate measurements in sepsis-induced tissue hypoperfusion: Results from the Surviving Sepsis Campaign database. Crit Care Med. 2015;43(3):567–73. doi: 10.1097/CCM.0000000000000742. [DOI] [PubMed] [Google Scholar]
- 30.Wang S, Ding S, Luo H, Chai X. International Normalized Ratio to Albumin Ratio (PTAR): An objective risk stratification tool in patients with sepsis. Int J Gen Med. 2021;14:1829–41. doi: 10.2147/IJGM.S305085. [DOI] [PMC free article] [PubMed] [Google Scholar]
- 31.Yu YT, Liu J, Hu B, et al. Expert consensus on the use of human serum albumin in critically ill patients. Chin Med J (Engl) 2021;134(14):1639–54. doi: 10.1097/CM9.0000000000001661. [DOI] [PMC free article] [PubMed] [Google Scholar]
- 32.Wang X, Jing M, Li L, Xu Q. The prognostic value of procalcitonin clearance and procalcitonin to albumin ratio in sepsis patients. Clin Lab. 2023;69(3):220613. doi: 10.7754/Clin.Lab.2022.220613. [DOI] [PubMed] [Google Scholar]
- 33.Nelson J, Hansen C, Scupp T, Brainard J. Implications of procalcitonin testing in critically ill patients with sepsis. Am J Respir Crit Care Med. 2019;199(2):232–34. doi: 10.1164/rccm.201712-2544RR. [DOI] [PubMed] [Google Scholar]
- 34.Arnau-Barres I, Guerri-Fernandez R, Luque S, et al. Serum albumin is a strong predictor of sepsis outcome in elderly patients. Eur J Clin Microbiol Infect Dis. 2019;38(4):743–46. doi: 10.1007/s10096-019-03478-2. [DOI] [PubMed] [Google Scholar]
- 35.Karakike E, Kyriazopoulou E, Tsangaris I, et al. The early change of SOFA score as a prognostic marker of 28-day sepsis mortality: Analysis through a derivation and a validation cohort. Crit Care. 2019;23(1):387. doi: 10.1186/s13054-019-2665-5. [DOI] [PMC free article] [PubMed] [Google Scholar]
- 36.Hu H, Li L, Zhang Y, et al. A prediction model for assessing prognosis in critically ill patients with sepsis-associated acute kidney injury. Shock. 2021;56(4):564–72. doi: 10.1097/SHK.0000000000001768. [DOI] [PubMed] [Google Scholar]
- 37.Liu H, Zhang L, Xu F, et al. Establishment of a prognostic model for patients with sepsis based on SOFA: A retrospective cohort study. J Int Med Res. 2021;49(9):3000605211044892. doi: 10.1177/03000605211044892. [DOI] [PMC free article] [PubMed] [Google Scholar]
- 38.Zhao L, Yang J, Zhou C, et al. A novel prognostic model for predicting the mortality risk of patients with sepsis-related acute respiratory failure: a cohort study using the MIMIC-IV database. Curr Med Res Opin. 2022;38(4):629–36. doi: 10.1080/03007995.2022.2038490. [DOI] [PubMed] [Google Scholar]
- 39.Vrieze SI. Model selection and psychological theory: A discussion of the differences between the Akaike information criterion (AIC) and the Bayesian information criterion (BIC) Psychol Methods. 2012;17(2):228–43. doi: 10.1037/a0027127. [DOI] [PMC free article] [PubMed] [Google Scholar]