

Abstract
Background:
Administrative datasets are useful for identifying rare disease cohorts such as pediatric acute myeloid leukemia (AML). Previously, cohorts were assembled using labor-intensive, manual reviews of patients’ longitudinal chemotherapy data.
Methods:
We utilized a two-step machine learning (ML) method to (i) identify pediatric patients with newly diagnosed AML, and (ii) among the identified AML patients, their chemotherapy courses, in an administrative/billing database. Using 2558 patients previously manually reviewed, multiple ML algorithms were derived from 75% of the study sample, and the selected model was tested in the remaining hold-out sample. The selected model was also applied to assemble a new pediatric AML cohort and further assessed in an external validation, using a standalone cohort established by manual chart abstraction.
Results:
For patient identification, the selected Support Vector Machine model yielded a sensitivity of 0.97 and a positive predictive value (PPV) of 0.97 in the hold-out test sample. For course-specific chemotherapy regimen and start date identification, the selected Random Forest model yielded overall PPV greater than or equal to 0.88 and sensitivity greater than or equal to 0.86 across all courses in the test sample. When applied to new cohort assembly, ML identified 3016 AML patients with 10,588 treatment courses. In the external validation subset, PPV was greater than or equal to 0.75 and sensitivity was greater than or equal to 0.82 for patient identification, and PPV was greater than or equal to 0.93 and sensitivity was greater than or equal to 0.94 for regimen identifications.
Conclusion:
A carefully designed ML model can accurately identify pediatric AML patients and their chemotherapy courses from administrative databases. This approach may be generalizable to other diseases and databases.
Keywords: acute myeloid leukemia, administrative database, case identification machine learning
1 |. INTRODUCTION
Acute myeloid leukemia (AML) is a rare disease with the annual rate of 4.1 per 100,000 new cases in the United States, which accounts for 4% of all childhood cancer diagnoses.1,2 For comparative effectiveness studies of such rare diseases, administrative data become important sources to provide large sample sizes that are otherwise unavailable.3,4 We previously developed and validated a manual-review method to identify newly diagnosed pediatric AML patients from a large multicenter administrative database, the Pediatric Health Information System (PHIS).5 This approach has been applied to construct large cohorts of multiple cancer types,6–9 and the established cohorts have been used in a range of comparative effectiveness studies.10–19 While this manual approach to cohort assembly has been effective, it is time-and resource-intensive and is subject to assessment variation between reviewers. There is a need for alternative approaches for cohort assembly that could enhance efficiency and minimize variation in human decisions.20–25
Machine learning (ML) is a powerful computing tool that has been increasingly applied to large and complex healthcare data to construct algorithms to predict outcomes, identify patterns, or to classify patients into categorical phenotypes.26–29 ML has also been leveraged to inform diagnosis of, prognosis for, and treatment of hematological malignancies.30,31 In particular, in adult AML and pediatric oncology, multiple ML applications have been published to monitor diseased cells in blood samples and flow cytometry or to predict overall survival, for example.32–39 However, there is limited publication in leveraging ML to assemble a cohort of patients with a rare malignancy from administrative data. We aimed to derive and externally validate an ML method that will allow for assembly of a large cohort of newly diagnosed pediatric AML patients, while reducing the burden of manual review and limiting the impact of human decision variation.
2 |. METHODS
2.1 |. Samples for ML training and testing
PHIS is an administrative database that contains inpatient, emergency department, ambulatory surgery, and observational unit encounter data from over 50 not-for-profit, tertiary care United States pediatric hospitals affiliated with the Children’s Hospital Association (CHA; Overland Park, KS, USA). Rigorous data quality and reliability are assured through a joint effort between the CHA and participating hospitals, which submit encounter data (including demographics, diagnoses, and procedures) as well as resource utilization data (e.g., pharmaceutical, imaging, laboratory test, and room-and-board) to PHIS. This study was deemed to be exempt from Institutional Review Board approval.
Between January 2004 through September 2014,2558 hospitalized patients with ICD-9 AML diagnosis codes and relevant chemotherapy drug utilization were identified in PHIS. Based on their day-to-day drug billing data, three rounds of manual reviews using the method described by Kavcic et al. were performed to determine each patient’s case status and treatment regimens, resulting in more than 1600 AML cases.5,10 The manual reviewed cohorts (n = 2558) were used as the training and testing sample for ML process, with features based on daily chemotherapy billing data and gold standard (GS) based on manual review designations of case status, course chemotherapy regimen, and course start date. Seventy-five percent of the manual-review cohort was selected randomly as a training set, and the remaining 25% was reserved for the hold-out test (or internal validation) (Figure 1A).
FIGURE 1.
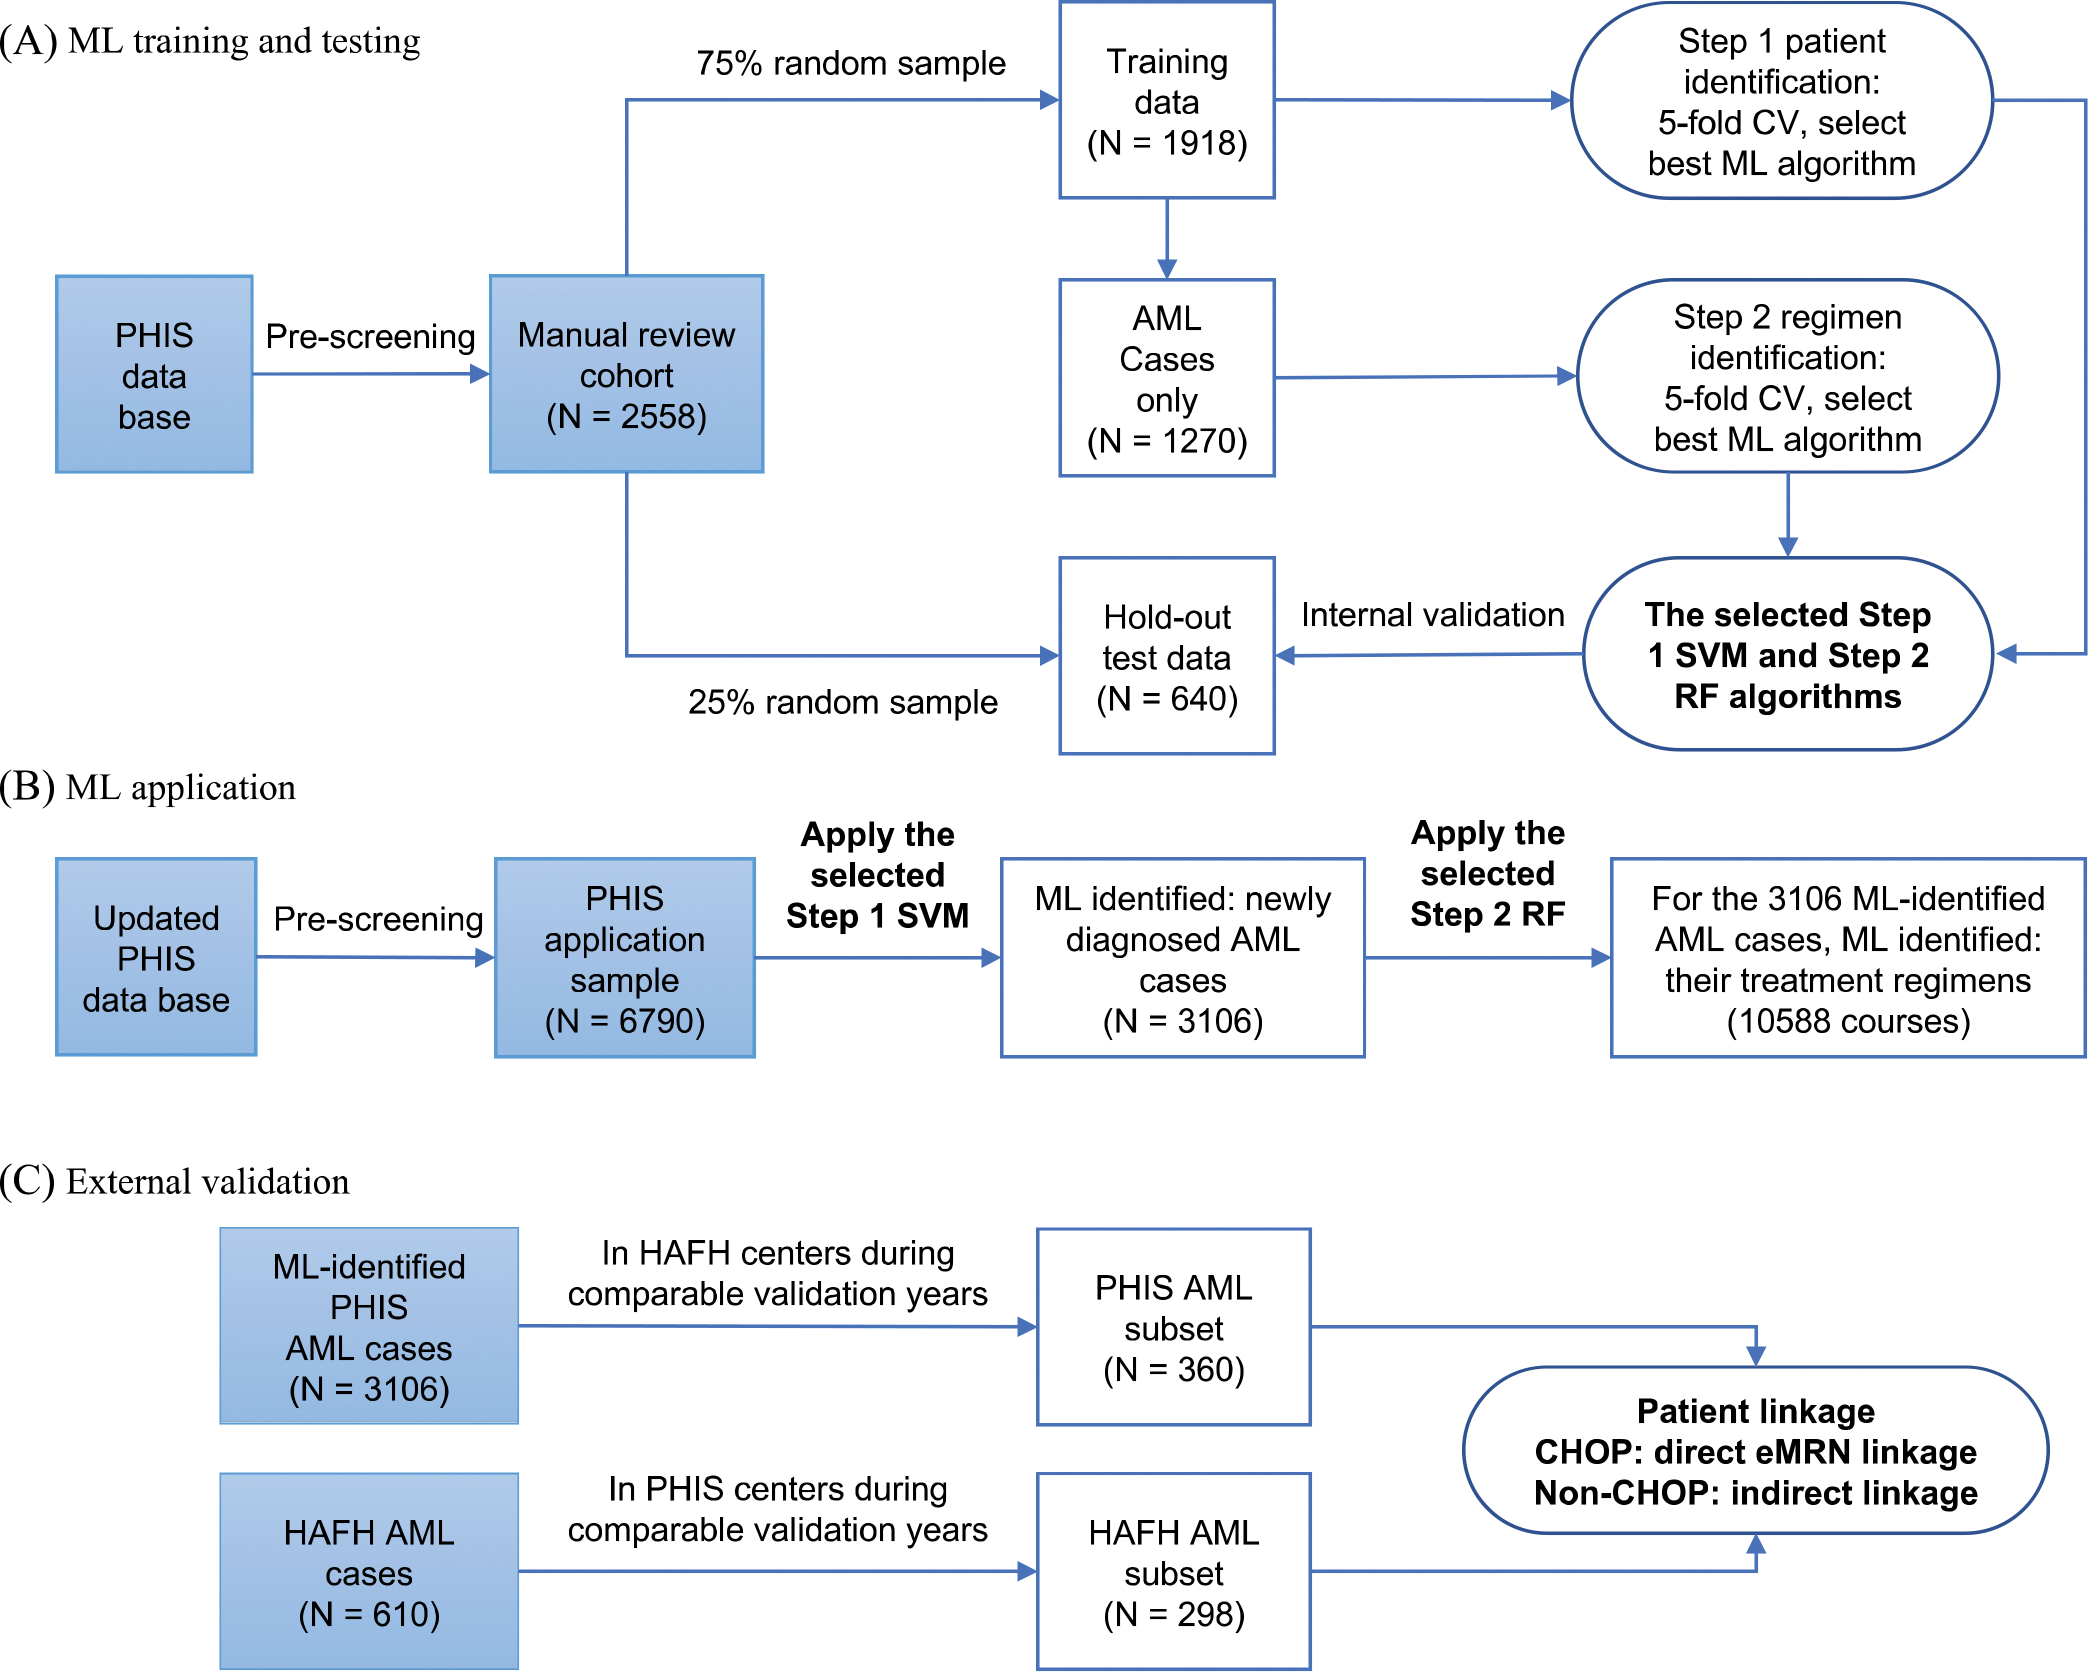
Overview of study process. ML: machine learning, PHIS: Pediatric Health Information System, AML: acute myeloid leukemia, CV: cross-validation, SVM: Support Vector Machine, RF: Random Forest, HAFH: Home or Away from Home study, CHOP: Children’s Hospital of Philadelphia, eMRN: encrypted medical record number.
2.2 |. ML training
The ML model was designed to identify patients with a new AML diagnosis and the start dates and chemotherapy regimens for up to five treatment courses per patient. Patients in training data were prescreened based on diagnosis codes, treatment-relevant medications, as well additional exclusion criteria, such as receiving hematopoietic stem cell transplants within 60 days of initial hospitalization.5 After this prescreening process, the remaining patients went into ML training. The main features in ML were based on day-to-day chemotherapy drug utilization from index admission (initial admission containing an AML diagnosis code) up to 365 days. During training, five-fold cross-validation was employed for algorithm optimization and selection of best-performing method.
A stepwise M L approach was adopted. Step 1 aimed to identify AML cases based on utilization patterns of four drugs (cytarabine, daunorubicin, etoposide, and gemtuzumab [GMTZ]) consistent with the three most common induction regimens for newly diagnosed AML patients. The raw data consist of binary indicator of daily utilization of individual drugs, and their utilization was assessed within five different time windows (20, 25, 30, 35, or 40 days) starting from the index admission. The proportions of drug utilization days in each window were explored as ML features in supervised ML algorithms (supervised methods were chosen because of the availability of labeled data). Three most commonly used algorithms were explored: Logistic Regression (LR), Random Forest (RF), and Support Vector Machine (SVM).
Conditional on successful patient identification in Step 1, Step 2 aimed to identify course-specific chemotherapy regimens and corresponding start dates. Six commonly used regimens were included: ara-C/cytarabine plus daunorubicin plus etoposide (ADE) 10, ADE 8, and ADE 10 plus GMTZ, ara-C plus etoposide (AE), mitoxantrone plus ara-C (MA), and high-dose ara-C plus asparaginase (HDAraC-C) (Table S1). A set of similarity metrics, including dot product, cosine similarity, and Euclidean distance, was first established to measure the degree of similarity between each observed drug utilization pattern and a regimen-specific expected pattern, with both the weighted version (using Inverse Document Frequency technique) and unweighted version of each metric, resulting in a total of six similarity measures. Specifically, each patient’s day-to-day drug utilization profile within a 15-day window was transferred into a sparse binary vector. From drug day 1 up to day 365, a series of sparse binary vectors from all sliding 15-day windows were compared with the expected patterns of six treatment regimens to generate similarity metrics. These six similarity metrics were then used as ML features in supervised learning employing RF, LR, or SVM. For this step, a successful match was defined when the ML-identified course regimen was the same as the GS regimen and the ML-identified course start date was within ±2 days of the GS course start date. Sensitivity analyses were performed by using exact date match and ±1 day match.
2.3 |. Internal validation
Performances of the selected Step 1 and Step 2 ML models were evaluated using the hold-out test sample. Sensitivity (recall), specificity, positive predictive value (PPV or precision), and negative predictive value (NPV) were used to evaluate both Step 1 patient-level identification and Step 2 course-level chemotherapy identification. Step 2 validation evaluated both all-course overall performance and by-course performance.
2.4 |. Application for new cohort assembly
The derived two-step ML model was applied to assemble an updated AML cohort using PHIS discharge data from January 2004 through March 2020. Pre-ML patient screening and day-to-day drug utilization data were prepared in ways similar to those performed for establishing the previous manual review cohort. The one distinction is that this updated application sample was queried on both AML ICD-9 and ICD-10 discharge diagnosis codes. Although the previous cohort included PHIS data up to 2014, for this new application, the pre-2014 records were extracted again because the PHIS database had incorporated new hospitals and new admissions. A total of 6790 patients from 46 hospitals were determined to be eligible for ML model application (Figure 1B).
2.5 |. External validation
The external validation used a separate cohort assembled in the Home or Away From Home study (HAFH) (ClinicalTrials.gov identifier: NCT02774850). This study included patients aged 0–18 years with newly diagnosed AML who received treatment at 17 US pediatric centers between 2011 and 2019, and data were collected using standardized manual chart abstractions.40‘41 Case status and chemotherapy regimens data from 11 HAFH study centers contributing data to PHIS served as the GS (Figure 1C).
PHIS and HAFH patients were linked on encrypted medical record number (eMRN) for Children’s Hospital of Philadelphia (CHOP) patients, and through an indirect match procedure as described by Li et al. for patients from other centers.12 A match was declared if a patient in each dataset had the same date of birth (DOB; or age if missing DOB) gender and their diagnosis or first course start dates were within ±3 days of each other.
Treatment regimens and course start date validation were conducted only among linked patients. Because chemotherapy regimen groupings varied between HAFH study and PHIS cohort, a regimen crosswalk was developed to define comparable regimens between two data sources (Table S2). A course-level match is declared if regimens from both sets were the same and the course start dates were within ±2 days of each other.
2.6 |. Software
The PHIS database was queried to extract each patient’s entire inpatient data. SAS version 9.3 (Cary, NC, USA) was used to structure the PHIS data. All ML analysis was conducted In Python 3.7.6 using Jupyter notebooks.42 Data manipulation was performed using pandas version 1.2.4,43 and mathematical analysis was performed using the numPy library version 1.20.1.44 ML modeling, evaluation, and application were performed with the scikit-learn version l.O.l.45 External validation, data preparation, data matching, and statistical analysis were performed in SAS 9.3.
3 |. RESULTS
3.1 |. ML model performance
Step 1 of ML training applied three different algorithms (i.e., LR, RF, and SVM models) to a randomly selected sample of 1918 (75%out of 2558) patients of the manual review cohort. For identifying AML cases, the 25-day window was chosen to construct ML features due to its slightly better performance compared to the rest of the windows explored (i.e., 20,30,35, or 40 days) (Table S3). Additionally, based on five-fold cross-validation results, all three ML algorithms performed similarly (Table 1). We chose the SVM approach as the final model, because it is generally less prone to overfitting. From the selected SVM model using the 25-day window, the sensitivity is greater than or equal to 0.94, specificity is greater than or equal to 0.94, PPV is greater than or equal to 0.97, and NPV is greater than or equal to 0.89 across all the cross-validations.
TABLE 1.
Five-fold cross-validation results, in Step 1 patient identification with 25-day drug utilization as features.
| Support Vector Machine | |||||
|---|---|---|---|---|---|
|
| |||||
| Fold 1 | Fold 2 | Fold 3 | Fold 4 | Fold 5 | |
| PPV | 1.00 | 1.00 | 0.97 | 0.97 | 0.97 |
| NPV | 0.89 | 0.99 | 0.95 | 0.98 | 0.97 |
| Sensitivity | 0.94 | 0.99 | 0.98 | 0.99 | 0.98 |
| Specificity | 0.99 | 1.00 | 0.95 | 0.95 | 0.94 |
| Logistic Regression | |||||
| PPV | 0.97 | 0.98 | 0.94 | 0.96 | 0.94 |
| NPV | 0.85 | 0.95 | 0.94 | 0.98 | 0.93 |
| Sensitivity | 0.92 | 0.98 | 0.97 | 0.99 | 0.97 |
| Specificity | 0.94 | 0.95 | 0.88 | 0.92 | 0.88 |
| Random Forest | |||||
| PPV | 1.00 | 1.00 | 0.97 | 0.98 | 0.97 |
| NPV | 0.89 | 0.97 | 0.96 | 0.98 | 0.98 |
| Sensitivity | 0.94 | 0.98 | 0.98 | 0.99 | 0.99 |
| Specificity | 1.00 | 1.00 | 0.95 | 0.96 | 0.94 |
Abbreviations: NPV, negative predictive value; PPV, positive predictive value.
For patients identified in Step 1, Step 2 aimed to identify chemotherapy regimen and corresponding start date for each treatment course using the same training sample as in Step 1. Table 2 displays the sensitivity and PPV for each chemotherapy regimen and by each fold of cross-validation for all three ML algorithms. The best performing (RF) algorithm yielded satisfactory sensitivity and PPV for each regimen across all five folds, only dropping below 0.80 for the sensitivity of ADE 10 + GMTZ in fold 1 and 3.
TABLE 2.
All-course five-fold cross-validation results by chemotherapy regimen, in Step 2 regimen and start-date identification.
| Random Forest | ||||||||||
|---|---|---|---|---|---|---|---|---|---|---|
|
| ||||||||||
| Fold 1 |
Fold 2 |
Fold 3 |
Fold 4 |
Fold 5 |
||||||
| PPV | Sensitivity | PPV | Sensitivity | PPV | Sensitivity | PPV | Sensitivity | PPV | Sensitivity | |
| ADE 10 | 0.92 | 0.84 | 0.92 | 0.85 | 0.88 | 0.88 | 0.88 | 0.89 | 0.90 | 0.82 |
| ADE 10 GMTZ | 0.91 | 0.74 | 0.89 | 0.83 | 0.95 | 0.64 | 0.89 | 0.85 | 0.93 | 0.84 |
| ADE 8 | 0.85 | 0.81 | 0.88 | 0.89 | 0.84 | 0.88 | 0.87 | 0.87 | 0.82 | 0.88 |
| AE | 0.91 | 0.85 | 0.91 | 0.90 | 0.93 | 0.88 | 0.90 | 0.94 | 0.94 | 0.88 |
| HDAraC-C | 0.90 | 0.88 | 0.90 | 0.90 | 0.85 | 0.90 | 0.89 | 0.87 | 0.86 | 0.86 |
| MA | 0.86 | 0.92 | 0.87 | 0.92 | 0.85 | 0.95 | 0.87 | 0.94 | 0.85 | 0.91 |
| Logistic Regression | ||||||||||
|
| ||||||||||
|
Fold 1
|
Fold 2
|
Fold 3
|
Fold 4
|
Fold 5
|
||||||
| PPV | Sensitivity | PPV | Sensitivity | PPV | Sensitivity | PPV | Sensitivity | PPV | Sensitivity | |
| ADE 10 | 0.84 | 0.75 | 0.84 | 0.72 | 0.78 | 0.76 | 0.74 | 0.77 | 0.81 | 0.72 |
| ADE 10 GMTZ | 0.96 | 0.67 | 0.93 | 0.70 | 0.94 | 0.69 | 0.90 | 0.78 | 0.95 | 0.71 |
| ADE 8 | 0.79 | 0.69 | 0.81 | 0.76 | 0.77 | 0.69 | 0.76 | 0.70 | 0.75 | 0.79 |
| AE | 0.85 | 0.80 | 0.87 | 0.88 | 0.88 | 0.86 | 0.84 | 0.90 | 0.85 | 0.88 |
| HDAraC-C | 0.86 | 0.35 | 0.84 | 0.35 | 0.65 | 0.39 | 0.76 | 0.32 | 0.81 | 0.33 |
| MA | 0.81 | 0.76 | 0.80 | 0.77 | 0.76 | 0.83 | 0.84 | 0.78 | 0.84 | 0.75 |
| Support Vector Machine | ||||||||||
|
| ||||||||||
|
Fold 1
|
Fold 2
|
Fold 3
|
Fold 4
|
Fold 5
|
||||||
| PPV | Sensitivity | PPV | Sensitivity | PPV | Sensitivity | PPV | Sensitivity | PPV | Sensitivity | |
| ADE 10 | 0.92 | 0.83 | 0.91 | 0.81 | 0.95 | 0.85 | 0.91 | 0.87 | 0.91 | 0.82 |
| ADE 10 GMTZ | 0.91 | 0.83 | 0.94 | 0.90 | 0.93 | 0.88 | 0.86 | 0.93 | 0.92 | 0.94 |
| ADE 8 | 0.86 | 0.79 | 0.89 | 0.84 | 0.86 | 0.87 | 0.85 | 0.88 | 0.83 | 0.89 |
| AE | 0.88 | 0.81 | 0.91 | 0.88 | 0.92 | 0.87 | 0.89 | 0.91 | 0.91 | 0.88 |
| HDAraC-C | 0.89 | 0.59 | 0.88 | 0.65 | 0.79 | 0.64 | 0.84 | 0.62 | 0.85 | 0.60 |
| MA | 0.86 | 0.91 | 0.85 | 0.90 | 0.83 | 0.92 | 0.86 | 0.94 | 0.83 | 0.90 |
Abbreviations: ADE, ara-C (cytarabinel+daunorubicin+etoposide; AE, ara-C+etoposide; GMTZ, gemtuzumab; HDAraC-C, high-dose ara-C+asparaginase; MA, mitoxantrone+ara-C.
3.2 |. Internal validation with the hold-out test sample
The internal validation of the ML models used the hold-out test sample consisting of 640 (25%) of the 2558 manual review cohort. The selected Step 1 SVM algorithm for case identification yielded a PPV of 0.97, sensitivity of 0.97, NPV of 0.94, and specificity of 0.94. To further ensure we did not differentially miss patients who had early death, we also evaluated sensitivity in subsets of patients with early mortality within 25 days (n = 8) or 1 year (n = 48) from the start of index hospitalization. The Step 1 SVM algorithm retained sensitivity of 1.0 and 0.98 in these subsets, respectively.
To validate the Step 2 RF algorithm for identification of the start date of each chemotherapy course and corresponding specific regimen, we aligned the sequence of the course regimens and dates identified by RF and evaluated the performance by course. Table 3 summarizes the sensitivity and PPV for all-regimen assessment, as well as the sensitivity and PPV for each individual regimen.
TABLE 3.
Internal validation results by regimen and by course, for the selected Step 2 Random Forest model.
| Sensitivity | ||||||||||
|---|---|---|---|---|---|---|---|---|---|---|
|
| ||||||||||
| Course 1 |
Course 2 |
Course 3 |
Course 4 |
Course 5 |
||||||
| Regimen | N | Sensitivity | N | Sensitivity | N | Sensitivity | N | Sensitivity | N | Sensitivity |
| Overall | 411 | 0.87 | 382 | 0.95 | 325 | 0.96 | 229 | 0.92 | 97 | 0.86 |
| ADE 10 | 310 | 0.90 | 5 | 0.80 | NA | NA | NA | NA | NA | NA |
| ADE 10 GMTZ | 74 | 0.84 | 5 | 0.00 | NA | NA | NA | NA | NA | NA |
| ADE 8 | 27 | 0.70 | 310 | 0.97 | 3 | 0.67 | 2 | 0.50 | NA | NA |
| AE | NA | NA | 26 | 0.92 | 273 | 0.96 | 3 | 0.33 | 4 | 0.50 |
| HDAraC-C | NA | NA | 5 | 1.00 | 10 | 1.00 | 78 | 0.92 | 84 | 0.87 |
| MA | NA | NA | 31 | 0.94 | 39 | 0.97 | 146 | 0.93 | 9 | 0.89 |
| PPV | ||||||||||
|
| ||||||||||
|
Course 1
|
Course 2
|
Course 3
|
Course 4
|
Course 5
|
||||||
| Regimen | N | PPV | N | PPV | N | PPV | N | PPV | N | PPV |
| Overall | 410 | 0.88 | 379 | 0.96 | 317 | 0.98 | 222 | 0.95 | 96 | 0.89 |
| ADE 10 | 288 | 0.97 | 12 | 0.33 | NA | NA | NA | NA | NA | NA |
| ADE 10 GMTZ | 64 | 0.97 | NA | NA | NA | NA | NA | NA | NA | NA |
| ADE 8 | 58 | 0.33 | 307 | 0.98 | 2 | 0.67 | 1 | 1.00 | NA | NA |
| AE | NA | NA | 25 | 0.96 | 265 | 0.98 | 3 | 0.33 | 2 | 1.00 |
| HDAraC-C | NA | NA | 5 | 1.00 | 10 | 1.00 | 76 | 0.95 | 79 | 0.92 |
| MA | NA | NA | 30 | 0.97 | 39 | 0.97 | 142 | 0.96 | 12 | 0.67 |
Abbreviations: ADE, ara-C (cytarabine)+daunorubicin+etoposide; AE, ara-C+etoposide; GMTZ, gemtuzumab; HDAraC-C, high-dose ara-C+asparaginase; MA, mitoxantrone+ara-C.
For course 1, the PPV was 0.88 for all chemotherapy regimens. Course-1 individual regimen PPV was 0.97 for ADE 10 and ADE 10 + GMTZ, but dropped to 0.33 for ADE 8. Similarly, for course 2, the all-regimen PPV was high (PPV = 0.96), while individual regimens’ PPVs varied, with ADE 8, AE, HDAraC-C, and MA having a PPV above 0. 95 but ADE 10 dropping to a PPV of 0.33. Validations for subsequent courses showed similar results, with PPVs of 0.98, 0.85, and 0.89 across all regimens for courses 3,4, and 5, respectively. The PPVs for individual regimens in these courses were typically above 0.90, except for some regimens that were less frequently used in a given course.
3.3 |. Application for new cohort assembly
Among the 6790 new PHIS patients who were prescreened to be eligible for application of ML, 3106 were identified as newly diagnosed AML patients by the Step 1 SVM algorithm (Figure 1B). We consistently identified about 200 pediatric AML cases every year (Table S4). After implementing the Step 2 RF algorithm on these 3106 cases, a total of 10,588 unique chemotherapy courses and corresponding regimens were identified, namely 2529 courses were with ADE10,402 with ADE 10 + GMTZ, 2480 with ADE 8, 2191 with AE, 1079 with HDAraC-C, and 1877 with MA. Table S5 shows top 30 chemotherapy sequences identified by Step 2 RF model.
3.4 |. External validation
Of the 3106 Step 1 SVM-identified PHIS AML patients, 360 pediatric patients were eligible for external validation, as they received treatment at an HAFH study site during the HAFH study period and did not contribute data to ML training. This subset has similar demographics to the entire ML-identified PHIS AML cohort (Table S6). Among the HAFH study patients, 298 received AML treatment at PHIS-contributing centers and served as GS in validation (Figure 1C).
Table 4 reports external validation results on both Step 1 patient identification and Step 2 chemotherapy regimen identification; CHOP and non-CHOP results were summarized separately due to utilization of different linkage methods described in Section 2.5. For AML case status identification, sensitivity was 0.82 for CHOP patients and 0.93 for non-CHOP patients, and PPV was of 0.82 for CHOP patients and 0.75 for non-CHOP patients. For the patients with validated AML case status, validation of their course regimens and start dates against the HAFH records yielded PPV of 0.93 for CHOP patients and 0.95 for non-CHOP patients, and sensitivity of 0.94 for CHOP patients and 0.96 for non-CHOP patients.
TABLE 4.
External validation results for the selected Step 1 Support Vector Machine model and Step 2 Random Forest model.
| Patient identification (Step 1 Support Vector Machine) |
Course regimen identification (Step 2 Random Forest) |
|||
|---|---|---|---|---|
| CHOP | non-CHOP | CHOP | non-CHOP | |
| Sensitivity (95% Cl) | 0.82(0.70,0.95) | 0.93(0.90,0.96) | 0.94(0.89,0.99) | 0.96(0.94,0.97) |
| PPV (95% Cl) | 0.82(0.70,0.95) | 0.75(0.70,0.80) | 0.93(0.87,0.98) | 0.95(0.94,0.97) |
Abbreviations: CHOR Children’s Hospital of Philadelphia; Cl, confidence interval; PPV, positive predictive value.
4 |. DISCUSSION
Our multidisciplinary team designed and validated a novel approach by leveraging ML method to identify newly diagnosed AML patients and determine the chemotherapy regimens by course from an administrative database. Our ML algorithms demonstrated outstanding performance in internal validation using hold-out test data and good performance in external validation against a chart-review data source. By applying the derived ML model to PHIS data from 2004 to 2020, we were able to efficiently assemble a large cohort of newly diagnosed pediatric AML patients and identify their chemotherapy regimens by course.
In pediatric oncology, previous studies reported an average PPV of approximately 0.8 and sensitivity approximately 0.8 when applying ML classification to clinically derived data, such as histological images, spectroscopy, or flow cytometry.46–49 In contrast, ML results using health records data only reached a PPV value of 0.6 or lower.31,50 Our ML algorithm has yielded better operating characteristics for identification of patients with newly diagnosed AML and good accuracy for detection of course-level chemotherapy regimens and their start dates. When evaluating the performance of regimen identification by course, the Step 2 RF algorithm performed better for specific regimens at the courses in which they are most commonly administered in clinical practice. For example, the sensitivity and PPV for ADE 10 and ADE 10 + GMTZ were high in course 1, whereas the sensitivity and PPV for ADE 8 were high in course 2. These follow the administration patterns in the most used pediatric AML frontline treatment protocols in the United States. In comparison, when regimens were used in a less expected order, such as using AE in course 4 or 5, the same RF algorithm yielded inadequate sensitivity (0.33 in course 4 and 0.5 in course 5) and PPV (0.33 in course 4) for regimen identification (Table 3). However, as these treatment variations only apply to a small portion of patients in any given course, the issue could be easily amended by performing additional targeted manual reviews. Overall, compared to our previous manual review cohort assembly, the Step 1SVM and Step 2 RF models are much more efficient, easier to replicate, and less prone to decision variations from different reviewers.
Accurate identification of study cohorts assembled from administrative data is a fundamental and critical component for observational studies, and the accuracy of cohort assembly methods is receiving increasing scrutiny in the literature.51 For assembly of a cohort via an ML method, internal and external validations are necessary steps to ensure confidence in resultant study cohort. Unfortunately, many ML studies suffer from an absence of external validation, often because of a lack of an appropriate data source.52–54 Our study benefited from having access to the HAFH study data that were assembled from oncology divisions across multiple pediatric institutions by chart review. For Step 1 patient identification, the external validation showed excellent performance when patients were linked through eMRN, and slightly decreased performance (lower PPV) when patients were matched/linked based on the indirect matching methodology.12 We also observed that among patients in our local hospital, the external validation results were not as good as those in the internal validation. Given that the GS used in ML training was based on manual review of pharmacy data and not on actual AML disease status determined directly from the medical record, it was not surprising to find lower ML model performance when outcomes were measured against true disease status in the external validation cohort. Moreover, it has been widely noted that the performance in external validation is generally worse than internal validation in ML studies, mostly due to the inherent difference between the external validation dataset and the training dataset.53,55‘56
With both clinical and resource utilization data from 50 pediatric tertiary hospitals from all geographical regions in the United States, PHIS serves as a good data source for ML utilization and assembly of rare disease cohorts. As all features in our models were derived from and based on administrative data, our methods can be easily generalized and adapted to similar databases reporting claim/billing data for drug administration. In addition to disease cohort identification, our method is unique in that it can establish each patient’s treatment regimen sequence, which could be utilized in subsequent analyses. For example, we could define completion of therapy by comparing identified regimen sequence with the intended pattern and then evaluate this outcome disparity by sociodemographic covariates.
Given the stable nature of pediatric AML chemotherapy regimens over the past two decades, our ML model may not require frequent adjustment for changes in clinical practice as noted in other applications.57 Nevertheless, as new regimens are implemented for the treatment of pediatric AML, they could be assessed within our ML model via similar training and validation procedures performed in this current study. For example, such adjustment will need to be performed to include liposome-encapsulated daunorubicin-araC, or CPX, which is under study in the Children’s Oncology Group AAML1831 trial (NCT04293562). Based on our successful experience in the current work, we are confident that such updates will be feasible and successful.
This study has two main limitations. First, for patient identification, we focused only on identifying those who start with common ADE regimens, so patients receiving other less typical initial regimens will not be identified by our ML method. As ADE regimens account for most current induction regimens for newly diagnosed pediatric AML patients, this restriction should result in missing only a small minority of patients in the final cohort. Similarly, in all courses, we trained the ML model to focus on six primary treatment regimens, which by design will miss or mislabel courses for patients receiving other less commonly used regimens, or has low sensitivities in scenarios where treatments are alerted due to occurrence of adverse events. Given the small number of patients receiving those regimens, however, the utility of expanding the ML process to other miscellaneous regimens may be limited. Second, as noted earlier, the GS used in our ML training data was based on clinicians’ manual review of pharmacy data from an administrative database rather than from actual clinical data. The latter would be more consistent with a true GS for detecting newly diagnosed AML patients and their treatment regimens. Ultimately, the derivation and validation of any ML model is only as good as the chosen reference standard. Researchers performing similar ML procedures to build a study cohort should aim to utilize a separate cohort as a GS for external validation as we did with the cohort from the HAFH study. However, such an external cohort is not always available, and establishment of one if not already available requires substantial resources and efforts.
In summary, we demonstrated that newly diagnosed pediatric AML patients and their chemotherapy course regimens can be accurately identified from an administrative database using ML. In particular, this approach could be adopted to establish chemotherapy regimens and course sequence. It provides a valuable tool to study other diseases using administrative data.
Supplementary Material
Abbreviations:
- aCHA
Children’s Hospital Association
- ADE
ara-C (cytarabine), daunorubicin, etoposide
- AE
ara-C, etoposide
- AML
acute myeloid leukemia
- CHOP
Children’s Hospital of Philadelphia
- DOB
date of birth
- eMRN
encrypted medical record number
- GMTZ
gemtuzumab
- GS
gold standard
- HAFH
Home or Away From Home study
- HDAraC-C
high-dose ara-C, asparaginase
- LR
Logistic Regression
- MA
mitoxantrone, ara-C
- ML
machine learning
- NPV
negative predictive value
- PHIS
Pediatric Health Information System
- PPV
positive predictive value
- RF
Random Forest
- SVM
Support Vector Machine
Footnotes
CONFLICT OF INTEREST STATEMENT
BTF receives funding from Pfizer, Merck, and Allovir. He also serves on a data safety monitoring board for Astellas. Other authors do not have a conflict of interest to disclose.
SUPPORTING INFORMATION
Additional supporting information can be found online in the Supporting Information section at the end of this article.
DATA AVAILABILITY STATEMENT
The data that support the findings of this study are available from CHA. Restrictions apply to the availability of these data, which were used under license for this study. PHIS data used In the study will be made available by the authors consistent with CHA data access policies.
REFERENCES
- 1.Siegel RL, Miller KD, Fuchs HE, Jemal A. Cancer statistics, 2021. CA Cancer J Clin. 2021;71(1):7–33. 10.3322/caac.21654 [DOI] [PubMed] [Google Scholar]
- 2.Kadauke S, Myers RM, Li Y.et al. Risk-adapted preemptive tocilizumab to prevent severe cytokine release syndrome after CTL019 for pediatric B-cell acute lymphoblastic leukemia: a prospective clinical trial. Am J Clin Oncol. 2021;39(8):920–930. 10.1200/jco.20.02477 [DOI] [PMC free article] [PubMed] [Google Scholar]
- 3.Savla JJ, Faerber JA Huang YV, et al. 2-Year outcomes after complete or staged procedure for tetralogy of fallot in neonates. J Am Coll Cardiol. 2019;74(12):1570–1579. 10.1016/j.jacc.2019.05.057 [DOI] [PMC free article] [PubMed] [Google Scholar]
- 4.Smith MG, Royer J, Mann JR, McDermott S. Using administrative data to ascertain true cases of muscular dystrophy: rare disease surveillance. JMIR Public Health Surveill. 2017;3(1):e2. 10.2196/publichealth.6720 [DOI] [PMC free article] [PubMed] [Google Scholar]
- 5.Kavcic M, Fisher BT, Torp K, et al. Assembly of a cohort of children treated for acute myeloid leukemia at free-standing children’s hospitals in the United States using an administrative database. Pediatr Blood Cancer. 2013;60(3):508–511. 10.1002/pbc.24402 [DOI] [PMC free article] [PubMed] [Google Scholar]
- 6.Fisher BT, Harris T, Torp K, et al. Establishment of an 11-year cohort of 8733 pediatric patients hospitalized at United States free-standing children’s hospitals with de novo acute lymphoblastic leukemia from health care administrative data. Med Care. 2014;52(1):e1–e6. 10.1097/MLR.0b013e31824deff9 [DOI] [PMC free article] [PubMed] [Google Scholar]
- 7.Desai AV, Kavcic M, Huang YS, et al. Establishing a high-risk neuroblastoma cohort using the Pediatric Health Information System database. Pediatr Blood Cancer. 2014;61(6):1129–1131. 10.1002/pbc.24930 [DOI] [PMC free article] [PubMed] [Google Scholar]
- 8.Bakk I, Koch T, Stanek J, O’Brien SH, Reed S. Steroid-induced hypertension during induction chemotherapy for acute lymphoblastic leukemia in US children’s hospitals. J Pediatr Hematol Oncol. 2018;40(1):27–30. 10.1097/MPH.0000000000000997 [DOI] [PubMed] [Google Scholar]
- 9.Rower JE, King AD, Wilkins D, et al. Dronabinol prescribing and exposure among children and young adults diagnosed with cancer. J Adolesc Young Adult Oncol. 2021;10(2):175. [DOI] [PMC free article] [PubMed] [Google Scholar]
- 10.Winestone LE, Getz KD, Miller TP, et al. The role of acuity of illness at presentation in early mortality in black children with acute myeloid leukemia. Am J Hematol. 2017;92(2):141–148. 10.1002/ajh.24605 [DOI] [PMC free article] [PubMed] [Google Scholar]
- 11.Goodman EK, Reilly AF, Fisher BT, et al. Association of weekend admission with hospital length of stay, time to chemotherapy, and risk for respiratory failure in pediatric patients with newly diagnosed leukemia at freestanding US children’s hospitals. JAMA Pediatr. 2014;168(10):925–931. 10.1001/jamapediatrics.2014.1023 [DOI] [PMC free article] [PubMed] [Google Scholar]
- 12.Li Y, Hall M, Fisher BT, et al. Merging Children’s Oncology Group data with an external administrative database using indirect patient identifiers: a report from the Children’s Oncology Group. PLoS One. 2015;10(11):e0143480. 10.1371/journal.pone.0143480 [DOI] [PMC free article] [PubMed] [Google Scholar]
- 13.Maude SL, Fitzgerald JC, Fisher BT, et al. Outcome of pediatric acute myeloid leukemia patients receiving intensive care in the United States. Pediatr Crit Care Med. 2014;15(2):112–120. 10.1097/PCC.0000000000000042 [DOI] [PMC free article] [PubMed] [Google Scholar]
- 14.Seif AE, Walker DM, Li Y, et al. Dexrazoxane exposure and risk of secondary acute myeloid leukemia in pediatric oncology patients. Pediatr Blood Cancer. 2015;62(4):704–709. 10.1002/pbc.25043 [DOI] [PMC free article] [PubMed] [Google Scholar]
- 15.Getz KD, Miller TP, Seif AE, et al. A comparison of resource utilization following chemotherapy for acute myeloid leukemia in children discharged versus children that remain hospitalized during neutropenia. Cancer Med. 2015;4(9):1356–1364. 10.1002/cam4.481 [DOI] [PMC free article] [PubMed] [Google Scholar]
- 16.Rao P, Li Y, Getz KD, et al. Low rates of pregnancy screening in adolescents before teratogenic exposures in a national sample of children’s hospitals. Cancer. 2016;122(21):3394–3400. 10.1002/cncr.30225 [DOI] [PMC free article] [PubMed] [Google Scholar]
- 17.Fitzgerald JC, Li Y, Fisher BT, et al. Hospital variation in intensive care resource utilization and mortality in newly diagnosed pediatric leukemia. Pediatr Crit Care Med. 2018;19(6):e312–e320. 10.1097/PCC.0000000000001525 [DOI] [PMC free article] [PubMed] [Google Scholar]
- 18.Getz KD, Miller TP, Seif AE, et al. Opioid utilization among pediatric patients treated for newly diagnosed acute myeloid leukemia. PLoS One. 2018;13(2):e0192529. 10.1371/journal.pone.0192529 [DOI] [PMC free article] [PubMed] [Google Scholar]
- 19.Li Y, Newton JG, Getz KD, et al. Comparable on-therapy mortality and supportive care requirements in Black and White patients following initial induction for pediatric acute myeloid leukemia. Pediatr Blood Cancer. 2019;66(4):e27583. 10.1002/pbc.27583 [DOI] [PMC free article] [PubMed] [Google Scholar]
- 20.Ong MS, Klann JG, Lin KJ, et al. Claims-based algorithms for identifying patients with pulmonary hypertension: a comparison of decision rules and machine-learning approaches. J Am Heart Assoc. 2020;9(19):e016648. 10.1161/JAHA120.016648 [DOI] [PMC free article] [PubMed] [Google Scholar]
- 21.Shivade C, Raghavan P, Fosler-Lussier E, et al. A review of approaches to identifying patient phenotype cohorts using electronic health records. J Am Med Inform Assoc. 2014;21(2):221–230. 10.1136/amiajnl-2013-001935 [DOI] [PMC free article] [PubMed] [Google Scholar]
- 22.Grosse SD, Green NS, Reeves SL. Administrative data identify sickle cell disease: a critical review of approaches in U.S. health services research. Pediatr Blood Cancer. 2020;67(12):e28703. 10.1002/pbc.28703 [DOI] [PMC free article] [PubMed] [Google Scholar]
- 23.Hanly JG, Thompson K, Skedgel C. Identification of patients with systemic lupus erythematosus In administrative healthcare databases. Lupus. 2014;23(13):1377–1382. 10.1177/0961203314543917 [DOI] [PubMed] [Google Scholar]
- 24.Salemi JL, Rutkowski RE, Tanner JP, Matas JL, Kirby RS. Identifying algorithms to improve the accuracy of unverified diagnosis codes for birth defects. Public Health Rep. 2018;133(3):303–310. 10.1177/0033354918763168 [DOI] [PMC free article] [PubMed] [Google Scholar]
- 25.Xu Y, Lee S, Martin E, et al. Enhancing ICD-code-based case definition for heart failure using electronic medical record data. J Card Fail. 2020;26(7):610–617. 10.1016/j.cardfail.2020.04.003 [DOI] [PubMed] [Google Scholar]
- 26.Rajkomar A, Dean J, Kohane I. Machine learning in medicine. N Engl J Med. 2019;380(14):1347–1358. 10.1056/NEJMral814259 [DOI] [PubMed] [Google Scholar]
- 27.Chen Y, Xi M, Johnson A et al. Machine learning approaches to investigate Clostridioides difficile infection and outcomes: a systematic review. Int J Med Inform. 2022;160:104706. 10.1016/j.ijmedinf.2022.104706 [DOI] [PubMed] [Google Scholar]
- 28.Libbrecht MW, Noble WS. Machine learning applications in genetics and genomics. Nat Rev Genet. 2015;16(6):321–332. 10.1038/nrg3920 [DOI] [PMC free article] [PubMed] [Google Scholar]
- 29.Ngiam KY, Khor IW. Big data and machine learning algorithms for health-care delivery. Lancet Oncol. 2019;20(5):e262–e273. 10.1016/S1470-2045(19)30149-4 [DOI] [PubMed] [Google Scholar]
- 30.Radakovich N, Nagy M, Nazha A. Machine learning in haematological malignancies. Lancet Haematol. 2020;7(7):e541–e550. 10.1016/S2352-3026(20)30121-6 [DOI] [PubMed] [Google Scholar]
- 31.Sung L, Corbin C, Steinberg E, et al. Development and utility assessment of a machine learning bloodstream infection classifier in pediatric patients receiving cancer treatments. BMC Cancer. 2020;20(1):1103. 10.1186/sl2885-020-07618-2 [DOI] [PMC free article] [PubMed] [Google Scholar]
- 32.Eckardt JN, Bornhauser M, Wendt K, Middeke JM. Application of machine learning in the management of acute myeloid leukemia: current practice and future prospects. Blood Adv. 2020;4(23):6077–6085. 10.1182/bloodadvances.2020002997 [DOI] [PMC free article] [PubMed] [Google Scholar]
- 33.Salah HT, Muhsen IN, Salama ME, Owaidah T, Hashmi SK. Machine learning applications in the diagnosis of leukemia: current trends and future directions. Int J Lab Hematol. 2019;41(6):717–725. 10.1111/ijlh.13089 [DOI] [PubMed] [Google Scholar]
- 34.Lee SI, Celik S, Logsdon BA, et al. A machine learning approach to integrate big data for precision medicine in acute myeloid leukemia. Nat Commun. 2018;9(1):42. 10.1038/s41467-017-02465-5 [DOI] [PMC free article] [PubMed] [Google Scholar]
- 35.Fathi E, Rezaee MJ, Tavakkoli-Moghaddam R, Alizadeh A, Montazer A. Design of an integrated model for diagnosis and classification of pediatric acute leukemia using machine learning. Proc Inst Mech Eng H. 2020;234(10):1051–1069. 10.1177/0954411920938567 [DOI] [PubMed] [Google Scholar]
- 36.Doan M, Case M, Masic D, et al. Label-free leukemia monitoring by computer vision. Cytometry A. 2020;97(4):407–414. 10.1002/cyto.a.23987 [DOI] [PMC free article] [PubMed] [Google Scholar]
- 37.Pan L, Liu G, Lin F, et al. Machine learning applications for prediction of relapse in childhood acute lymphoblastic leukemia. Sci Rep. 2017;7(1):7402. 10.1038/s41598-017-07408-0 [DOI] [PMC free article] [PubMed] [Google Scholar]
- 38.Ramesh S, Chokkara S, Shen T, et al. Applications of artificial intelligence in pediatric oncology: a systematic review. JCO Clin Cancer Inform. 2021;5:1208–1219. 10.1200/CCI.21.00102 [DOI] [PMC free article] [PubMed] [Google Scholar]
- 39.Gerstung M, Papaemmanuil E, Martincorena I, et al. Precision oncology for acute myeloid leukemia using a knowledge bank approach. Nat Genet. 2017;49(3):332–340. 10.1038/ng.3756 [DOI] [PMC free article] [PubMed] [Google Scholar]
- 40.Getz KD, Li Y, Szymczak JE, et al. Home or Away From Home: a multi-institution study comparing medical outcomes, patient perspectives, and health-related quality of life for outpatient versus inpatient management after chemotherapy for pediatric acute myeloid leukemia. Blood. 2019;134(Supplement_l):379. 10.1182/blood-2019-131761 [DOI] [Google Scholar]
- 41.Getz KD, Szymczak JE, Li Y, et al. Medical outcomes, quality of life, and family perceptions for outpatient versus inpatient neutropenia management after chemotherapy for pediatric acute myeloid leukemia. JAMA Netw Open. 2021;4:e2128385. [DOI] [PMC free article] [PubMed] [Google Scholar]
- 42.Kluyver T, Ragan-Kelley B, Pérez F, et al. Jupyter Notebooks - a publishing format for reproducible computational workflows. Paper presented at: 20th International Conference on Electronic Publishing; January 1,2016. Accessed September 15th, 2022. https://eprints.soton.ac.uk/403913/ [Google Scholar]
- 43.McKinney W Data structures for statistical computing in Python. Paper presented at: the 9th Python In Science Conference (SCIPY 2010). 2010:51–56. [Google Scholar]
- 44.Harris CR, Millman KJ, van der Walt SJ, et al. Array programming with NumPy. Nature. 2020;585(7825):357–362. 10.1038/s41586-020-2649-2 [DOI] [PMC free article] [PubMed] [Google Scholar]
- 45.Pedregosa F, Varoquaux G, Gramfort A, et al. Scikit-learn: machine learning in Python. J Mach Learn Res. 2011;12:2825–2830. [Google Scholar]
- 46.Das D, Mahanta LB, Baishya BK, Ahmed S. Classification of childhood medulloblastoma and its subtypes using transfer learning features - a comparative study of deep convolutional neural networks. Paper presented at: International Conference on Computer, Electrical & Communication Engineering (ICCECE); Kolkata, India; 2020. IEEE:l–5. [Google Scholar]
- 47.Chaber R, Arthur CJ, Depciuch J, et al. Distinguishing Ewing sarcoma and osteomyelitis using FTIR spectroscopy. Sci Rep. 2018;8(1):15081–15088. 10.1038/S41598-018-33470-3 [DOI] [PMC free article] [PubMed] [Google Scholar]
- 48.Gheisari S, Catchpoole DR, Charlton A, Kennedy PJ. Convolutional deep belief network with feature encoding for classification of neuroblastoma histological images. J Pathol Inform. 2018;9(1):17. 10.4103/jpi.jpi_73_17 [DOI] [PMC free article] [PubMed] [Google Scholar]
- 49.Reiter M, Diem M, Schumich A, et al. Automated flow cytometric MRD assessment in childhood acute B-lymphoblastic leukemia using supervised machine learning. Cytometry Part A. 2019;95(9):966–975. 10.1002/cyto.a.23852 [DOI] [PubMed] [Google Scholar]
- 50.Masino AJ, Harris MC, Forsyth D, et al. Machine learning models for early sepsis recognition in the neonatal intensive care unit using readily available electronic health record data. PLoS One. 2019;14(2):e0212665–e0212665. 10.1371/journal.pone.0212665 [DOI] [PMC free article] [PubMed] [Google Scholar]
- 51.Hall M, Attard TM, Berry JG. Improving cohort definitions in research using hospital administrative databases - do we need guidelines? JAMA Pediatr. 2022;176(6):539–540. 10.1001/jamapediatrics.2022.0091 [DOI] [PubMed] [Google Scholar]
- 52.Riley RD, Ensor J, Snell Kl, et al. External validation of clinical prediction models using big datasets from e-health records or IPD meta-analysis: opportunities and challenges. BMJ. 2016;353:i3140. 10.1136/bmj.i3140 [DOI] [PMC free article] [PubMed] [Google Scholar]
- 53.Goldstein BA, Navar AM, Pencina MJ, loannidis JP. Opportunities and challenges in developing risk prediction models with electronic health records data: a systematic review. J Am Med Inform Assoc. 2017;24(l):198–208. 10.1093/jamia/ocw042 [DOI] [PMC free article] [PubMed] [Google Scholar]
- 54.Ramspek CL, Jager KJ, Dekker FW, Zoccali C, van Diepen M. External validation of prognostic models: what, why, how, when and where? Clin Kidney J. 2021;14(1):49–58. 10.1093/ckj/sfaal88 [DOI] [PMC free article] [PubMed] [Google Scholar]
- 55.Wong A, Otles E, Donnelly JP, et al. External validation of a widely implemented proprietary sepsis prediction model in hospitalized patients. JAMA Intern Med. 2021;181(8):1065–1070. 10.1001/jamainternmed.2021.2626 [DOI] [PMC free article] [PubMed] [Google Scholar]
- 56.Siontis GC, Tzoulaki I, Castaldi PJ, loannidis JP. External validation of new risk prediction models is infrequent and reveals worse prognostic discrimination. J Clin Epidemiol. 2015;68(1):25–34. 10.1016/j.jdinepi.2014.09.007 [DOI] [PubMed] [Google Scholar]
- 57.Guo LL, Pfohl SR, Fries J, et al. Systematic review of approaches to preserve machine learning performance in the presence of temporal dataset shift in clinical medicine. Appl Clin Inform. 2021;12(4):808–815. 10.1055/S-0041-1735184 [DOI] [PMC free article] [PubMed] [Google Scholar]
Associated Data
This section collects any data citations, data availability statements, or supplementary materials included in this article.
Supplementary Materials
Data Availability Statement
The data that support the findings of this study are available from CHA. Restrictions apply to the availability of these data, which were used under license for this study. PHIS data used In the study will be made available by the authors consistent with CHA data access policies.