

Abstract
Background:
The clinical presentation and prognosis of hypertrophic cardiomyopathy (HCM) are heterogeneous between nonobstructive HCM (HNCM) and obstructive HCM (HOCM). Electrocardiography (ECG) has been used as a screening tool for HCM. However, it is still unclear whether the features presented on ECG could be used for the initial classification of HOCM and HNCM.
Objective:
We aimed to develop a pragmatic model based on common 12-lead ECG features for the initial identification of HOCM/HNCM.
Methods:
Between April 1st and September 30th, 2020, 172 consecutive HCM patients from the International Cooperation Center for Hypertrophic Cardiomyopathy of Xijing Hospital were prospectively included in the training cohort. Between January 4th and February 30th, 2021, an additional 62 HCM patients were prospectively included in the temporal internal validation cohort. External validation was performed using retrospectively collected ECG data with definite classification (390 HOCM and 499 HNCM ECG samples) from January 1st, 2010 to March 31st, 2020. Multivariable backward logistic regression (LR) was used to develop the prediction model. The discrimination performance, calibration and clinical utility of the model were evaluated.
Results:
Of all 30 acquired ECG parameters, 10 variables were significantly different between HOCM and HNCM (all P < 0.05). The P wave interval and SV1 were selected to construct the model, which had a clearly useful C-statistic of 0.805 (0.697, 0.914) in the temporal validation cohort and 0.776 (0.746, 0.806) in the external validation cohort for differentiating HOCM from HNCM. The calibration plot, decision curve analysis, and clinical impact curve indicated that the model had good fitness and clinical utility.
Conclusion:
The pragmatic model constructed by the P wave interval and SV1 had a clearly useful ability to discriminate HOCM from HNCM. The model might potentially serve as an initial classification of HCM before referring patients to dedicated centers and specialists.
Highlights
What are the novel findings of this work?
Evident differences exist in the ECG presentations between HOCM and HNCM.
To the best of our knowledge, this study is the first piece of evidence to quantify the difference in the ECG presentations between HOCM and HNCM.
Based on routine 12-lead ECG data, a probabilistic model was generated that might assist in the initial classification of HCM patients.
Keywords: hypertrophic cardiomyopathy, obstructive hypertrophic cardiomyopathy, nonobstructive hypertrophic cardiomyopathy, electrocardiogram, classification
Introduction
Hypertrophic cardiomyopathy (HCM) is one of the most common genetic cardiovascular diseases, with a large heterogeneity in its clinical presentation and prognosis. Obstructive hypertrophic cardiomyopathy (HOCM) accounts for two-thirds of HCM cases. It is a state in which the myocardium is highly contracted, causing left ventricular outflow tract obstruction (LVOTO) and leading to severe symptoms and adverse events [1,2].
The prognosis and management of HOCM and nonobstructive HCM (HNCM) are different. Patients with HOCM usually experience a high overall risk of advanced heart failure (HF) and atrial fibrillation (AF) [1,3], whereas the majority of HNCM patients are usually asymptomatic or have only mild symptoms. It has been considered that HNCM patients are associated with a low probability of HF or other major adverse consequences and do not require surgical interventions [4]. Septal reduction therapy (SRT) was recommended for symptomatic HOCM patients who progressed to drug refractory HF [5]. It has been suggested that referring HOCM patients to high-volume and high-expertise centers receiving SRT might lead to good outcomes with lower procedural mortality, lower costs and bleeding complications, and improvement in clinical discomforts [6,7]. Thus, early classification of HNCM and HOCM is important for medical counseling, prompt referral, and even longitudinal clinical follow-up.
The diagnosis of HCM and the subsequent categorization of HOCM and HNCM relies mostly on the measurement of the maximum wall thickness (MWT) and left ventricular outflow tract gradient (LVOTG≥30 mmHg) by echocardiography (Echo) or stress Echo [8,9]. However, instant, routine Echo in patients suspected to have HCM is less practical in rural or undeveloped regions due to the high cost, lack of infrastructure or well-trained cardiac sonographic specialists [10]. Most HCM patients have electrocardiographic abnormalities [11], and 12-lead electrocardiography (ECG) might offer an attractive noninvasive, low-cost, and convenient approach to screen for HCM. Generally, ECG screening has relied on particular features, such as left axis deviation, left ventricular high voltage, prominent Q waves, and T-wave inversions. Nevertheless, these single features have a less satisfied diagnostic performance [12,13]. Prediction models based on ECG using traditional statistical methods [14] or artificial intelligence [15,16] have achieved high accuracy in diagnosing or risk stratifying HCM. However, it is still unclear whether the features presented on ECG could be used for the initial classification of HNCM and HOCM.
In the current study, we constructed a practicable model based on the most common and easily available ECG features to distinguish HOCM from HNCM, with the aim to assist in the initial classification of HCM patients.
Methods
Study population
Between April 1st and September 30th, 2020, 172 consecutive HCM patients—102 HOCM and 72 HNCM patients—from the International Cooperation Center for Hypertrophic Cardiomyopathy of Xijing Hospital were prospectively included in the training cohort. Between January 4th and February 30th, 2021, an additional 62 HCM patients from the same center were prospectively included in the temporal internal validation cohort (30 HOCM and 32 HNCM patients). External validation was performed using retrospectively collected ECG data with definite classification of HOCM or HNCM (390 HOCM and 499 HNCM ECG samples) from Xijing Hospital by the end of March 2020. The study flowchart is shown in Figure 1. Patients who had previously received an interventricular reduction procedure, had a pacemaker with pacing rhythm, had persistent atrial fibrillation (AF), had bundle branch block (BBB), or had missing ECG data were excluded. The enrolled HCM participants predominantly came from Northwest, Central, Northern, and Eastern China (Supplemental Figure S1).
Figure 1.
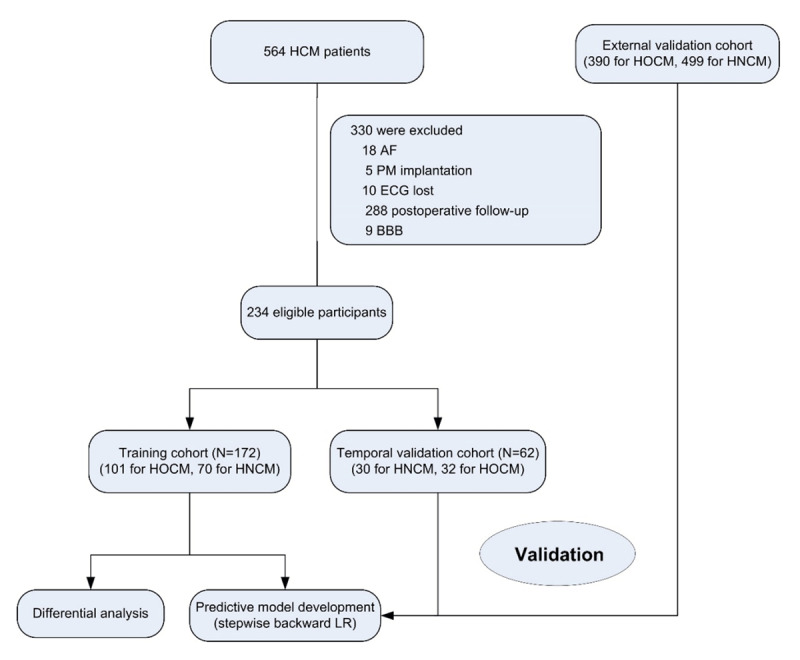
Study flow chart.
AF, atrial fibrillation; PM, pacemaker; BBB, bundle branch block; HCM, hypertrophic cardiomyopathy; HOCM, obstructive hypertrophic cardiomyopathy; HNCM, non-obstructive hypertrophic cardiomyopathy; LR, logistic regression.
The research protocol was approved by the ethics committee of Xijing Hospital, and the requirement for written informed consent was waived by the institutional review board. The study was performed in accordance with the local laws and the regulations of Xijing Hospital, and the study complied with the Declaration of Helsinki.
Electrocardiogram Evaluation
All participants underwent routine 12-lead ECG in the supine position at a sampling rate of 500 Hz, an amplitude of 10 mm/mv and a speed of 25 mm/s. The ECG features were measured automatically by the computer, and these data were checked independently by two experienced ECG reviewers blinded to the clinical details [14].
A total of 30 common ECG parameters were acquired, including the mean heart rate (HR), P wave duration, intervals of PR, QT and the corrected QT (QTc), abnormal Q wave, T wave inversion (TWI), and the amplitudes of the R and S waves in all precordial leads (V1–V6) and in limb leads I, III, and aVL (expressed as “R/S+Lead”). The amplitudes of RV5 + SV1 (RV5SV1, Sokolov–Lyon index), RaVL + SV3 (RaVLSV3, Cornell index), and RI + SIII (RISIII) were calculated for reflecting pathological high LV wall voltage, and the amplitudes of the R and S waves in leads V1–4, reflecting interventricular septum (IVS) hypertrophy, were also included.
Echocardiography acquisition
All subjects underwent a transthoracic two-dimensional and Doppler Echo that was independently performed by two experienced cardiac sonographers. A maximum LVOTG (LVOTGmax) of ≥ 30 mmHg is classified as HOCM; conversely, a rest and stress LVOTGmax < 30 mmHg is HNCM [17,18].
All the echocardiographic and Doppler measurements were averaged from three cardiac cycles, and the measurements included the biatrial dimension, left ventricular end-systolic volume (ESV), left ventricular end-diastolic volume (EDV), left ventricular ejection fraction (LVEF), left ventricular outflow tract pressure gradient (LVOTG), and maximum left ventricular wall thickness (MWT). Tissue Doppler signals were collected from the mitral inflow and mitral annulus tissue, the early (E) and late (A) diastolic mitral inflow velocity; the early (E’) and late (A’) diastolic mitral annular tissue velocity were recorded at 100 mm/s, respectively [19]. E/A and E/E’ were calculated to reflect the left ventricular diastolic function. The SAM sign, that is the forward motion of the mitral valve during systole, is an abnormal waveform of the mitral valve leaflet removed to the ventricular septum during systole. All the above procedures were in accordance with the guidelines of the American Society of Echocardiography and the European Society for the Quantification of Cardiac Chambers in Adult Echocardiography [20].
Statistical analysis
The sample size was derived based on an attempt to include all available samples during the study interval, and no power calculation was performed in advance. Categorical variables were expressed as the frequency and percentage. Normally distributed continuous variables were expressed as the mean with standard deviations (SD) or median [25th and 75th percentiles], depending on their distribution. Between groups comparisons, including t test and nonparametric Mann-Whitney U tests, were performed as appropriate for continuous variables, and Fisher’s exact tests were used for categorical variables.
Univariable and multivariable logistic regression (LR) analyses with backward stepwise-regression were used to screen variables and construct the model. The discrimination accuracy was quantified by receiver operating characteristic (ROC) curves using the C-statistic. According to previous literature [21], a C-statistic greater than 0.75 reflects a clearly useful discrimination; C-statistic less than 0.60 reflects poor discrimination; 0.60 to 0.75, possibly helpful discrimination. A calibration curve with the R package ‘CalibrationCurves’ was used to assess the goodness-of-fit of the model. Decision curve analysis (DCA) and clinical impact curve (CIC) analysis with the R package ‘rmda’ was conducted to assess the clinical effectiveness of the model. For any given patient’s probability threshold, the DCA curve with the highest benefit score at that threshold is the best choice [22]. An online browser-based calculator (http://121.36.159.143:9999/hocm.do) was generated accordingly.
All statistical analyses were carried out using R 3.6.1 software and SPSS 26.0; a two-tailed P value < 0.05 was considered to be statistically significant.
Results
Baseline characteristics
Of the total 234 prospectively enrolled participants, 172 were included in the training cohort and the remaining 62 participants were included in the temporal validation cohort. The baseline characteristics were presented in Table 1. The median ages were 47 and 46 years in HOCM and HNCM group, respectively, and males accounted for more than 60% of the patients in both groups. There was no significant difference in the diameters of right atrium (RA), end-diastolic volume (EDV), end-systolic volume (ESV), left-ventricular ejection fraction (LVEF), and E/A between the HOCM and HNCM groups (all P > 0.05). The HOCM group had larger left atrium dimension (LAD), maximal wall thickness (MWT), LVOTG, E/E’ and more positive systolic anterior motion (SAM) sign (all P < 0.05).
Table 1.
Baseline characteristics.
|
| |||||||||
|---|---|---|---|---|---|---|---|---|---|
| ALL | TRAINING COHORT | TEMPORAL VALIDATION COHORT | |||||||
|
|
|
|
|||||||
| HOCM N = 132 | HNCM N = 102 | P | HOCM N = 102 | HNCM N = 70 | P | HOCM N = 30 | HNCM N = 32 | P | |
|
| |||||||||
| Age, y (mean, SD) | 47 (14) | 46 (15) | 0.635 | 47 (14) | 47 (15) | 0.962 | 48 (15) | 44 (15) | 0.372 |
|
| |||||||||
| Male (n, %) | 97 (73.48) | 66 (64.71) | 0.147 | 74 (72.55) | 46 (65.71) | 0.338 | 23 (76.67) | 20 (62.50) | 0.227 |
|
| |||||||||
| Echocardiography parameters | |||||||||
|
| |||||||||
| MWT, mm | 23 [20, 27] | 20 [17, 23] | <0.001 | 23 [20, 27] | 19 [17, 24] | <0.001 | 24 [20, 27] | 20 [16, 22] | 0.003 |
|
| |||||||||
| RAD, mm | 34 [32, 36] | 35 [32, 37] | 0.092 | 34 [31, 36] | 35 [31, 37] | 0.091 | 35 [33, 36] | 34 [32, 37] | 0.854 |
|
| |||||||||
| LAD, mm | 44 [41, 48] | 40 [37, 45] | <0.001 | 44 [40, 48] | 41 [37, 45] | <0.001 | 45 [42, 48] | 40 [37, 45] | 0.001 |
|
| |||||||||
| EDV, ml | 78 [65, 88] | 77 [67, 90] | 0.532 | 78 [65, 87] | 80 [69, 91] | 0.174 | 80 [71, 91] | 74 [62, 89] | 0.269 |
|
| |||||||||
| ESV, ml | 31 [25, 37] | 32 [27, 39] | 0.186 | 31 [25, 36] | 33 [27, 39] | 0.126 | 32 [26, 38] | 31 [27, 39] | 0.972 |
|
| |||||||||
| LVEF, % | 59 [57, 62] | 58 [56, 61] | 0.090 | 59 [57, 62] | 58 [56, 61] | 0.137 | 59 [57, 62] | 59 [57, 61] | 0.548 |
|
| |||||||||
| E/E’ | 14.48 [11.15, 20.48] | 11.13 [9.31, 13.87] | <0.001 | 15.17 [11.69, 20.90] | 11.56 [9.31, 13.87] | <0.001 | 13.40 [10.92, 16.43] | 10.95 [9.63, 14.05] | 0.046 |
|
| |||||||||
| E/A | 0.81 [0.66, 1.32] | 0.84 [0.73, 1.35] | 0.296 | 0.80 [0.66, 1.28] | 0.85 [0.75, 1.35] | 0.136 | 0.85 [0.66, 1.44] | 0.77 [0.65, 1.35] | 0.667 |
|
| |||||||||
| LVOTGmax, mmHg | 58 [22, 96] | 5 [3, 7] | <0.001 | 64 [22, 99] | 5 [4, 7] | <0.001 | 71 [35, 102] | 6 [4, 10] | <0.001 |
|
| |||||||||
| SAM sign [n, %] | 112 (84.85) | 10 (9.80) | <0.001 | 87 (85.29) | 9 (12.86) | <0.001 | 25 (83.33) | 1 (3.13) | <0.001 |
|
| |||||||||
Data are expressed as n (%), mean (SD), or median [25th and 75th percentiles], otherwise specified.
MWT, maximum wall thickness; RA, right atrium dimension; LA, left atrium dimension; EDV, end-diastolic volume; ESV, end-systolic volume; LVEF, left ventricular ejection fraction; E, early diastolic mitral inflow velocity; A, late diastolic mitral inflow velocity; E’, early diastolic mitral annular tissue velocity; A’, late diastolic mitral annular tissue velocity; E/A, ratio of peak velocities of the early diastolic peak and late peak in mitral inflow; E/E’, ratio of early diastolic peak velocity in mitral inflow to mitral annular; LVOTGmax, the maximum of left ventricular outflow tract gradient; SAM, systolic anterior motion.
ECG parameters
Among the total 30 obtained ECG variables, compared with HNCM, HOCM was associated with significantly larger P wave interval and higher amplitudes in SV1, RI, RaVL, SV2, SV5, SV6, RV5SV1, RISIII, and SV1V2 (all P < 0.05). There was no significant difference in the other 20 ECG variables (Table 2).
Table 2.
ECG parameters.
|
| |||||||||
|---|---|---|---|---|---|---|---|---|---|
| ALL | TRAINING COHORT | TEMPORAL VALIDATION COHORT | |||||||
|
|
|
|
|||||||
| HOCM N = 132 | HNCM N = 102 | P | HOCM N = 102 | HNCM N = 70 | P | HOCM N = 30 | HNCM N = 32 | P | |
|
| |||||||||
| P, ms | 106 [100, 114] | 100 [92, 107] | <0.001 | 104 [100, 110] | 100 [90, 106] | <0.001 | 112 [104, 122] | 100 [93, 108] | <0.001 |
|
| |||||||||
| QRS, ms | 104 [94, 112] | 100 [92, 111] | 0.408 | 104 [92, 112] | 104 [92, 114] | 0.951 | 104 [96, 107] | 96 [92, 108] | 0.094 |
|
| |||||||||
| PR, ms | 154 [139, 172] | 148 [136, 164] | 0.117 | 151 [136, 172] | 152 [138, 164] | 0.720 | 160 [146, 176] | 146 [133, 163] | 0.009 |
|
| |||||||||
| QTc, ms | 430 [411, 445] | 426 [413, 441] | 0.441 | 428 [410, 442] | 427[414, 441] | 0.965 | 433 [416, 454] | 422 [410, 443] | 0.102 |
|
| |||||||||
| Abnormal Q | 37 (28.03) | 19 (18.63) | 0.095 | 26 (25.49) | 10 (14.29) | 0.088 | 11 (36.67) | 9 (28.13) | 0.589 |
|
| |||||||||
| TWI, % | 80 (60.61) | 61 (59.80) | 0.901 | 62 (60.78) | 41 (58.57) | 0.874 | 18 (60.00) | 20 (62.50) | >0.999 |
|
| |||||||||
| RI, mv | 1.20 [0.80, 1.68] | 0.80 [0.50, 1.23] | <0.001 | 1.29 [0.80, 1.70] | 0.90 [0.50, 1.20] | 0.001 | 1.05 [0.70, 1.40] | 0.80 [0.60, 1.38] | 0.133 |
|
| |||||||||
| RV1, mv | 0.31 [0.10, 0.70] | 0.40 [0.20, 0.80] | 0.535 | 0.31 [0.10, 0.70] | 0.40 [0.20, 0.80] | 0.267 | 0.35 [0.10, 0.70] | 0.55 [0.26, 1.20] | 0.055 |
|
| |||||||||
| RV2, mv | 0.80 [0.30, 1.50] | 1.03 [0.52, 1.90] | 0.047 | 0.80 [0.30, 1.50] | 0.80 [0.50, 1.55] | 0.450 | 0.74 [0.29, 1.76] | 1.35 [0.81, 2.30] | 0.036 |
|
| |||||||||
| RV3, mv | 1.75 [0.90, 2.60] | 1.45 [0.95, 2.50] | 0.523 | 1.65 [0.79, 2.60] | 1.35 [0.80, 2.50] | 0.457 | 2.23 [1.07, 2.70] | 1.95 [1.10, 2.40] | 0.587 |
|
| |||||||||
| RV4, mv | 2.60 [1.74, 3.68] | 2.35 [1.39, 3.50] | 0.154 | 2.60 [1.72, 3.70] | 2.45 [1.38, 3.33] | 0.294 | 2.70 [1.93, 3.50] | 1.95 [1.39, 3.78] | 0.310 |
|
| |||||||||
| RV5, mv | 2.70 [1.70, 3.55] | 2.35 [1.30, 3.36] | 0.072 | 2.61 [1.60, 3.70] | 2.60 [1.30, 3.35] | 0.210 | 2.85 [1.95, 3.21] | 1.71 [1.29, 3.39] | 0.178 |
|
| |||||||||
| RV6, mv | 2.03 [1.40, 2.80] | 1.80 [1.10, 2.70] | 0.070 | 2.00 [1.30, 3.00] | 1.85 [1.08, 2.63] | 0.159 | 2.30 [1.64, 2.80] | 1.68 [1.16, 2.78] | 0.215 |
|
| |||||||||
| RaVL, mv | 0.60 [0.38, 1.12] | 0.50 [0.20, 1.23] | 0.019 | 0.64 [0.40, 1.13] | 0.50 [0.20, 1.00] | 0.032 | 0.45 [0.33, 1.12] | 0.50 [0.23, 0.78] | 0.521 |
|
| |||||||||
| SIII, mv | 0.30 [0.00, 0.79] | 0.30 [0.00, 0.70] | 0.595 | 0.30 [0.00, 0.72] | 0.30 [0.00, 0.70] | 0.685 | 0.41 [0.00, 0.85] | 0.30 [0.00, 0.72] | 0.622 |
|
| |||||||||
| SV1, mv | 2.10 [1.40, 2.76] | 1.30 [0.92, 1.73] | <0.001 | 2.10 [1.40, 2.80] | 1.30 [0.90, 1.80] | <0.001 | 2.00 [1.25, 2.72] | 1.39 [1.03, 1.69] | 0.007 |
|
| |||||||||
| SV2, mv | 2.30 [1.50, 3.17] | 1.90 [1.30, 2.50] | 0.008 | 2.30 [1.50, 3.11] | 1.85 [1.20, 2.50] | 0.029 | 2.35 [1.54, 3.83] | 2.00 [1.40, 2.48] | 0.128 |
|
| |||||||||
| SV3, mv | 1.50 [0.68, 2.38] | 1.50 [0.80, 2.40] | 0.634 | 1.50 [0.70, 2.30] | 1.50 [0.78, 2.40] | 0.576 | 1.73 [0.44, 2.50] | 1.49 [0.93, 2.38] | 0.966 |
|
| |||||||||
| SV4, mv | 0.90 [0.40, 1.78] | 1.03 [0.58, 1.90] | 0.135 | 0.90 [0.38, 1.53] | 1.20 [0.58, 1.90] | 0.084 | 0.85 [0.43, 2.03] | 0.95 [0.53, 1.64] | 0.933 |
|
| |||||||||
| SV5, mv | 0.40 [0.10, 0.90] | 0.68 [0.30, 1.10] | 0.005 | 0.35 [0.00, 0.90] | 0.70 [0.30, 1.13] | 0.004 | 0.42 [0.20, 1.26] | 0.50 [0.30, 1.08] | 0.708 |
|
| |||||||||
| SV6, mv | 0.20 [0.00, 0.40] | 0.30 [0.00, 0.60] | 0.018 | 0.20 [0.00, 0.30] | 0.25 [0.00, 0.60] | 0.030 | 0.27 [0.08, 0.53] | 0.30 [0.15, 0.59] | 0.645 |
|
| |||||||||
| RV5SV1, mv | 4.58 [3.44, 6.16] | 3.50 [2.50, 4.91] | <0.001 | 4.60 [3.20, 6.30] | 3.55 [2.40, 4.95] | 0.001 | 4.58 [3.90, 5.81] | 3.35 [2.50, 4.93] | 0.010 |
|
| |||||||||
| RⅠSⅢ, mv | 1.50 [1.00, 2.28] | 1.25 [0.70, 1.93] | 0.005 | 1.53 [1.00, 2.25] | 1.25 [0.68, 2.00] | 0.014 | 1.40 [1.00, 2.34] | 1.20 [0.80, 1.90] | 0.231 |
|
| |||||||||
| RaVLSV3, mv | 2.30 [1.38, 3.19] | 2.30 [1.30, 2.86] | 0.598 | 2.30 [1.40, 3.06] | 2.30 [1.22, 2.90] | 0.711 | 2.23 [1.13, 3.79] | 2.20 [1.30, 2.80] | 0.688 |
|
| |||||||||
| RV2V3, mv | 2.60 [1.40, 4.22] | 2.55 [1.50, 4.23] | 0.573 | 2.53 [1.40, 4.19] | 2.30 [1.40, 4.07] | 0.821 | 3.00 [1.41, 4.73] | 2.95 [2.23, 5.05] | 0.375 |
|
| |||||||||
| SV2V3, mv | 3.95 [2.21, 5.16] | 3.50 [2.28, 4.80] | 0.186 | 3.85 [2.22, 4.90] | 3.55 [2.25, 4.80] | 0.377 | 4.68 [1.99, 5.63] | 3.48 [2.25, 4.80] | 0.254 |
|
| |||||||||
| RV1V2, mv | 1.25 [0.44, 2.15] | 1.43 [0.90, 2.62] | 0.042 | 1.30 [0.43, 2.12] | 1.30 [0.70, 2.33] | 0.388 | 1.08 [0.43, 2.53] | 2.03 [1.13, 3.51] | 0.029 |
|
| |||||||||
| SV1V2, mv | 4.46 [3.13, 5.70] | 3.20 [2.37, 4.13] | <0.001 | 4.37 [2.98, 5.83] | 3.30 [2.00, 4.45] | <0.001 | 4.48 [3.30, 5.48] | 3.20 [2.41, 3.99] | 0.005 |
|
| |||||||||
| RV3V4, mv | 4.35 [2.62, 6.08] | 3.90 [2.30, 6.00] | 0.292 | 4.15 [2.58, 6.10] | 3.95 [2.18, 5.93] | 0.382 | 5.15 [3.11, 5.93] | 3.85 [2.50, 6.25] | 0.517 |
|
| |||||||||
| SV3SV4, mv | 2.50 [0.99, 4.21] | 2.60 [1.39, 4.30] | 0.358 | 2.45 [1.06, 3.92] | 2.80 [1.30, 4.30] | 0.235 | 2.58 [0.82, 4.81] | 2.40 [1.45, 4.09] | 0.816 |
|
| |||||||||
Data are expressed as n (%) or median [25th and 75th percentiles].
TWI, T wave inversion; RV5SV1, amplitude of the R wave in V5 plus the S wave amplitude in V1; RⅠSⅢ, amplitude of the R wave in lead Ⅰ plus the S wave amplitude in lead Ⅲ; RaVLSV3, amplitude of the R wave in lead aVL plus the S wave amplitude in precordial lead V3; RV2V3, amplitude of the R wave in precordial lead V2 plus V3; SV2V3, amplitude of the S wave in precordial lead V2 plus V3. The rest set as the analogy.
Selection of the predictors and construction of the HOCM model
All the above 10 ECG variables with statistical significance were incorporated into the univariable and multivariable LR with backward stepwise selection (enter 0.1, removal 0.01). Two variables, P wave interval (P) and the amplitude of the S wave in lead V1 (SV1), were found to be independent predictors of HOCM (Table 3). The formula of the model is presented as follows:
Table 3.
Univariable and multivariable logistic regression analyses.
|
| ||||||
|---|---|---|---|---|---|---|
| VARIABLES | UNIVARIABLE ANALYSIS | MULTIVARIABLE ANALYSIS | ||||
|
|
|
|||||
| COEFFICIENT | OR (95% CI) | P | COEFFICIENT | OR (95% CI) | P | |
|
| ||||||
| RaVL | 0.36 | 1.43 (0.88, 2.31) | 0.150 | |||
|
| ||||||
| SV1V2 | 0.34 | 1.40 (1.17, 1.68) | <0.001 | |||
|
| ||||||
| RⅠSⅢ | 0.25 | 1.29 (0.97, 1.71) | 0.081 | |||
|
| ||||||
| SV6 | –0.48 | 0.62 (0.34, 1.13) | 0.116 | |||
|
| ||||||
| RⅠ | 0.73 | 2.07 (1.26, 3.41) | <0.001 | |||
|
| ||||||
| RV5SV1 | 0.31 | 1.37 (1.14, 1.65) | 0.001 | |||
|
| ||||||
| SV2 | 0.35 | 1.42 (1.06, 1.90) | 0.017 | |||
|
| ||||||
| SV5 | –0.47 | 0.63 (0.41, 0.96) | 0.032 | |||
|
| ||||||
| P | 0.07 | 1.07 (1.04, 1.11) | <0.001 | 0.068 | 1.07 (1.04, 1.11) | <0.001 |
|
| ||||||
| SV1 | 0.91 | 2.49 (1.67, 3.72) | <0.001 | 0.930 | 2.54 (1.65, 3.89) | <0.001 |
|
| ||||||
| Constant | –8.135 | |||||
|
| ||||||
The calibration and discrimination performance of the model
Calibration curves were generated to evaluate the fitness of the model. The calibration plots presented slopes of 1.00 (0.65~1.35), 1.14 (0.49, 1.79) and 0.82 (0.69, 0.95), intercepts of 0.00 (–0.35~0.35), 0.04 (–0.53, 0.60) and –0.40 (–0.55, –0.24) in the training, temporal, and external validation cohorts (Figure 2A–C), respectively. The model had a clearly useful C-statistic of 0.786 (0.718–0.854) in the training cohort, 0.805 (0.697–0.914) in the temporal validation cohort, and 0.776 (0.746–0.806) in the external validation cohort for differentiating HOCM from HNCM (Figure 2D–F). When the cutoff was set at 0.53 based on the Youden index, the sensitivity, specificity, and accuracy were 0.80, 0.72, and 0.71, respectively.
Figure 2.
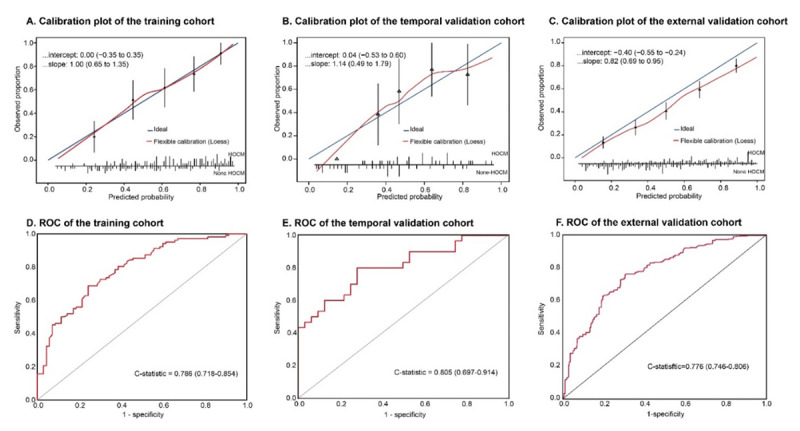
The calibration and ROC curve of the model in the training, temporal, and external validation cohorts.
Calibration plots between the predicted and observed HOCM patients in the training (A), temporal (B), and external validation (C) cohorts. The 45° blue line represents a perfect prediction, and the red line represents the predictive performance of the model. ROC curves of the training (D), temporal (E), and external (F) validation cohorts.
The correlation between LVOTG and the prediction score value
A scatter plot was used to illustrate the association between LVOTG (stress echo) and the prediction score value (Figure 3). We found that LVOTG had a linear relationship (P < 0.001) with the prediction score value (LVOTG = 53.2 + 20.6 * score per 1 unit). The risk stratification strata are presented in Figure 3. In the ‘green zone’ (the prediction score value < –0.75), the probability of HOCM was 0%, whereas in the ‘yellow zone’ (the prediction score value ranged from –0.75 to 0.53) and ‘red zone’ (the prediction score value > 0.53), the probability of HOCM was 46.4% and 76.3%, respectively.
Figure 3.
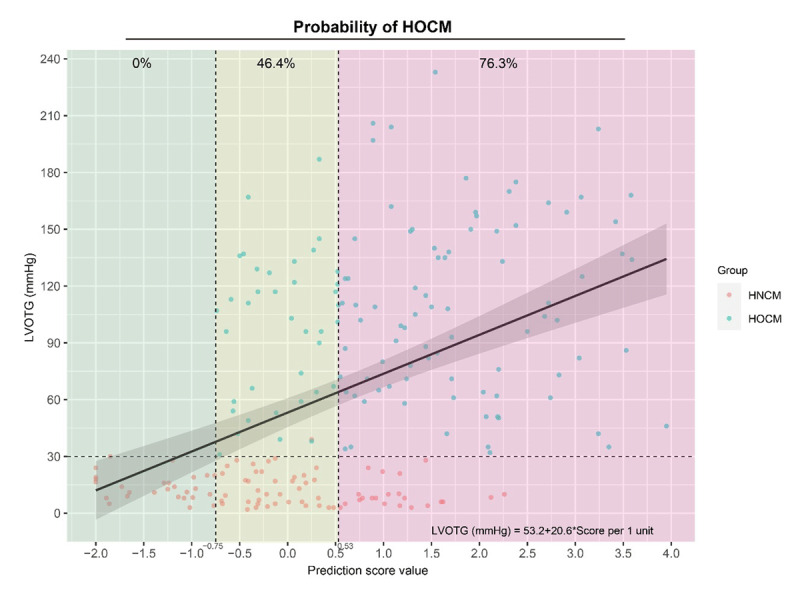
The relationship between LVOTG and the prediction score value.
The utility of the model for assessing HOCM probability
Decision curve analysis (DCA) was used to estimate the net benefits of the developed model at different thresholds, with the probability thresholds on the horizontal axis and the net benefit scores on the vertical axis. The model could gain more net benefits than either ‘none’ or ‘all’ HOCM patients recognized when the threshold probability was between 20% and 90%, which indicates a high cost-efficient net and potential for clinical application (Supplemental Figure 2A). Furthermore, clinical impact curve (CIC) was utilized to demonstrate the clinical effectiveness of the model and to predict the probability of HOCM among 1000 samples. When the threshold probability was greater than 80%, the predictive number of HOCM was approximately the same as the actual number (Supplemental Figure 2B).
Examples illustration
Two case scenarios are shown in Figure 4. Case 1 was a 58-year-old male patient with chest discomfort during activity. ECG showed that the patient had a sinus rhythm with a P wave interval of 96 ms, SV1 of 1.6 mv, and TWI in precordial leads of V2–V5 (Figure 4A). Our previous calculator, which could be used to screen for HCM/non-HCM, (http://121.36.159.143:9999/hcm.do) indicated that the patient had a high probability of HCM, and the present model further indicated a low probability of HOCM (Figure 4B). After examination by Echo, the patient was diagnosed as HNCM with a MWT of 21 mm and LVOTGmax of 12 mmHg (Figure 4C). Finally, the patient was prescribed β-blockers. Case 2 was a 40-year-old male with a family history of HCM. ECG showed the patient had sinus rhythm with a P wave interval of 108 ms, SV1 of 2.5 mv, and TWI in the inferior and precordial leads (Figure 4D). The prediction model suggested a high HCM probability with LVOT obstruction (Figure 4E). The patient was referred to our HCM center, and the Echo showed a MWT of 26 mm and a LVOTGmax of 92 mmHg (Figure 4F). The patient was diagnosed with HOCM and received the SRT procedure by percutaneous intramyocardial septal radiofrequency ablation [23].
Figure 4.
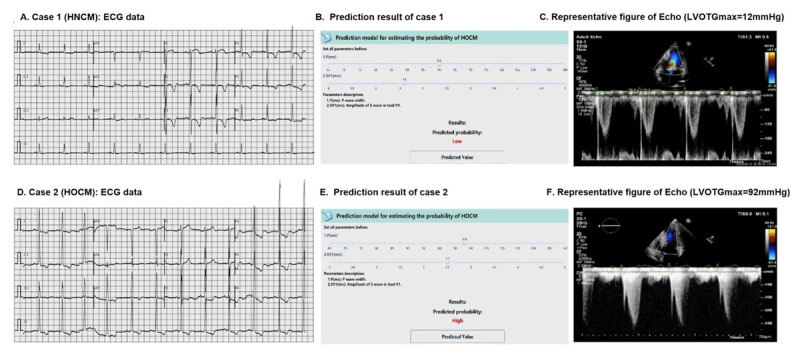
Examples illustration.
A, The ECG of the patient from case 1 (HNCM); B, the prediction result of case 1 with a low HOCM probability; C, Peak LVOTG (12 mmHg) of the patient from case 1; D, The ECG of the patient from case 2 (HOCM); E, the prediction result of case 2 with a high HOCM probability; F, Peak LVOTG (92 mmHg) of the patient from case 2.
Discussion
In this study, we found that there are differences in the ECG presentations between HOCM and HNCM. To the best of our knowledge, this study is the first piece of evidence to quantify the difference in ECG presentations between HOCM and HNCM, and a prediction model was constructed to categorize these two subtypes of HCM.
Surface 12-leads ECG is a ubiquitous and less resource-intensive approach in clinical practice. Studies have suggested that prediction models based on ECG can achieve high accuracy in detecting HCM and have proposed that patients who are suspected of having HCM should undergo routine ECG, which could reflect the morphology and function of the heart [24].
The HOCM and HNCM are the two subtypes of HCM and are associated with distinct prognosis and treatment strategies. A previous study [25] showed that there were more abnormal ECG presentations in HOCM than in HNCM; the ECG parameters reflected left ventricular hypertrophy (RV5, RV6, SV1, SV2, ST-T change, etc.), and left atrial abnormalities were also more commonly presented in HOCM than in HNCM. Recently, researchers reported an ECG model using artificial intelligence for the assessment of disease status and treatment response in HOCM [26]. However, it is still debatable whether an abnormal ECG could to some extent reflect LVOTG assessed by Echo. In addition, it is still unclear whether the features presented on ECG could be used for the initial classification of HOCM and HNCM. In this study, a feasible model consisting of the P wave interval and SV1 showed clearly useful discrimination of HOCM from HNCM, and we found that the prediction risk score was associated with LVOTG, which might be used to reflect LVOTG.
In the current formula, SV1 was included to predict HOCM/HNCM. The increase of SV1, the R-wave amplitude in the leads facing the left ventricle (I, aVL, V5 and V6), and the deepening of the S-wave amplitude in the leads V2/V3 were considered as ECG markers reflecting left ventricular hypertrophy (LVH) [27,28]. However, it has been suggested that these left ventricular hypertrophy markers alone were not associated with a higher LVOTG, and that these markers had poor discrimination ability for differentiating HOCM from HNCM [25].
Similarly, it has also been reported that the AUC of the ROC curve for left ventricular hypertrophy by the ECG voltage criteria alone was only 0.675 [29]. It suggested a ‘possibly helpful’ discrimination ability (AUC: 0.60–0.75) for severe aortic stenosis (AS) detection according to the guides of discrimination and calibration of clinical prediction models [21]. In our study, the amplitudes of the ECG markers traditionally used for indicating left ventricular hypertrophy (RI, RaVL, SV1, SV2, RV5SV1, RISIII, and SV1V2) were also all higher in HOCM than in HNCM. However, we found that SV1 was the strongest predictor among these variables in the logistic regression model.
The P wave interval was also incorporated into the prediction model. The P wave interval has been recognized to be correlated with the left atrial volume, and a prolonged P wave interval is associated with delayed interatrial conduction [30,31,32,33]. Compared to HNCM, the prolonged P wave interval showed in the HOCM group could be explained by the fact that HOCM patients typically have more severe impaired diastolic function and atrial dysfunction [34,35]. Concordantly, we observed that left atrial dimension assessed by Echo was also larger in HOCM than in HNCM.
The diagnosis of HOCM relies on the measurement of LVOTG by Echo. However, the LVOTG was not measured routinely, and it might not be accurately measured by less well-trained medical staff. Furthermore, the variability of LVOTG was reported to be as high as 49.0 mmHg in the absence of provocative maneuvers or interventions, which may result in discrepant classification [36,37]. A 12-lead ECG could offer a noninvasive, low-cost, and rapid means of screening for cardiovascular diseases. It has been suggested that the increase of SV1 was significantly reduced by 90% after HOCM patients who received intramyocardial radiofrequency ablation procedure to alleviate LVOTG [38]. Similarly, based on the 12-lead ECG, a deep learning-based algorithm was verified with high accuracy for severe AS (mean gradient pressure 32 mmHg) screening [39]. Another study also reported that AI-based ECG could mirror the decreasing trends over time in LVOTG (>100 mmHg pretreatment to less than 30 mmHg until the end of the study) for HOCM patients receiving mavacamten [26]. Such evidence indicates that ECG abnormalities may be associated with LVOTG. However, the precise features that the AI sees are obscure, AI needs advanced infrastructures, and the model may not be accessible for everyone, especially in undeveloped regions or communities.
In the current study, in virtue of the classical statistical approach, we found that the LVOTG had a linear relationship with the score of the prediction model, and the model may be regarded as a potential tool to ‘translate’ ECG features to LVOTG without dedicated instrument.
Limitations
First, the participants enrolled in the current study were from a single center and were all Chinese. Further external validation using participants from multiple centers and a population with more heterogeneity is needed. Second, the variables included in the formula of the model focused only on those parameters that are commonly assessed in clinical practice to increase the simplicity and applicability of the model; thus, some important but less frequently used features might have been omitted. Third, although some researchers reported that ECG was correlated with the HCM phenotype rather than the genotype [40], the effects of the genotype of HCM patients was not taken into consideration.
Conclusion
There are differences in the ECG presentations between HOCM and HNCM. The pragmatic model constructed by the commonly used parameters of P wave interval and SV1 had ‘clearly useful’ discrimination of the HCM subtypes. Such a model might assist the initial classification of suspected HCM patients and has potential in the follow-up of disease progression or longitudinal monitoring of treatment response.
Additional File
The additional file for this article can be found as follows:
Figures 1 and 2.
Acknowledgements
We appreciate Huiting Yang, Yue Wang, and Yupeng Han for the assistance of baseline information gathering.
Funding Statement
The present work is financially supported by the National Key R&D Program of China (Grant No. 2018YFA0107400), and Program for Chang-Jiang Scholars and Innovative Research Team in University (Grant No. PCSIRT-14R08), and program for National Science Funds of China (Grant No. 82170358).
Contributor Information
Liwen Liu, Email: liuliwen@fmmu.edu.cn.
Chao Gao, Email: woshigaochao@gmail.com.
Ling Tao, Email: lingtao@fmmu.edu.cn.
Abbreviations
| AF | Atrial fibrillation |
| BBB | Bundle branch block |
| CI | Confidence intervals |
| CIC | Clinical impact curve |
| DCA | Decision curve analysis |
| ECG | Electrocardiogram |
| Echo | Echocardiography |
| EDV | End-diastolic volume |
| ESV | End-systolic volume |
| HCM | Hypertrophic cardiomyopathy |
| HNCM | Nonobstructive HCM |
| HOCM | Obstructive HCM |
| LAD | Left atrium dimension |
| LR | Logistic regression |
| LV | Left ventricular |
| LVEF | Left ventricular ejection fraction |
| LVH | Left ventricular hypertrophy |
| LVOTG | Left ventricular outflow tract gradient |
| LVOTO | Left ventricular outflow obstruction |
| MWT | Maximum wall thickness |
| RA | Right atrium |
| ROC | Receiver operator characteristic |
| RV5SV1 | The sum amplitude of R wave in lead V5 And S wave in lead V1 |
| SAM | Systolic anterior motion |
| SRT | Septal reduction therapy |
| SV1 | The amplitude of S Wave in Lead V1 |
Funding Information
The present work is financially supported by the National Key R&D Program of China (Grant No. 2018YFA0107400), and Program for Chang-Jiang Scholars and Innovative Research Team in University (Grant No. PCSIRT-14R08), and program for National Science Funds of China (Grant No. 82170358).
Competing Interests
The authors have no competing interests to declare.
References
- 1.Geske JB, Gersh BJ. The hypertrophic cardiomyopathy paradox: better with age. Eur Heart J. 2019; 40(12): 994–996. DOI: 10.1093/eurheartj/ehy889 [DOI] [PubMed] [Google Scholar]
- 2.Maron MS, Olivotto I, Zenovich AG, et al. Hypertrophic cardiomyopathy is predominantly a disease of left ventricular outflow tract obstruction. Circulation. 2006; 114(21): 2232–2239. DOI: 10.1161/CIRCULATIONAHA.106.644682 [DOI] [PubMed] [Google Scholar]
- 3.Lu DY, Pozios I, Haileselassie B, et al. Clinical outcomes in patients with nonobstructive, labile, and obstructive hypertrophic cardiomyopathy. J Am Heart Assoc. 2018; 7(5): e006657. DOI: 10.1161/JAHA.117.006657 [DOI] [PMC free article] [PubMed] [Google Scholar]
- 4.Maron MS, Rowin EJ, Olivotto I, et al. Contemporary natural history and management of nonobstructive hypertrophic cardiomyopathy. J Am Coll Cardiol. 2016; 67(12): 1399–1409. DOI: 10.1016/j.jacc.2016.01.023 [DOI] [PubMed] [Google Scholar]
- 5.Maron BJ, Desai MY, Nishimura RA, et al. Management of hypertrophic cardiomyopathy: JACC State-of-the-Art review. J Am Coll Cardiol. 2022; 79(4): 390–414. DOI: 10.1016/j.jacc.2021.11.021 [DOI] [PubMed] [Google Scholar]
- 6.Kimmelstiel C, Zisa D, Kuttab J, et al. Guideline-based referral for septal reduction therapy in obstructive hypertrophic cardiomyopathy is associated with excellent clinical putcomes. Circulation. Cardiovascular interventions. 2019; 12(7): e007673. DOI: 10.1161/CIRCINTERVENTIONS.118.007673 [DOI] [PMC free article] [PubMed] [Google Scholar]
- 7.Kim L, Swaminathan R, Looser P, et al. Hospital volume outcomes after septal myectomy and alcohol septal ablation for treatment of obstructive hypertrophic cardiomyopathy: US Nationwide Inpatient Database. 2003–2011. JAMA cardiology. 2016; 1(3): 324–332. DOI: 10.1001/jamacardio.2016.0252 [DOI] [PubMed] [Google Scholar]
- 8.Maron BJ, Desai MY, Nishimura RA, et al. Diagnosis and evaluation of hypertrophic cardiomyopathy: JACC State-of-the-Art review. J Am Coll Cardiol. 2022; 79(4): 372–389. DOI: 10.1016/j.jacc.2021.12.002 [DOI] [PubMed] [Google Scholar]
- 9.Ommen SR, Mital S, Burke MA, et al. 2020 AHA/ACC guideline for the diagnosis and treatment of patients with hypertrophic cardiomyopathy: executive summary: a report of the American College of Cardiology/American Heart Association Joint Committee on clinical practice guidelines. Circulation. 2020; 142(25): e533–e557. DOI: 10.1161/CIR.0000000000000945 [DOI] [PubMed] [Google Scholar]
- 10.Captur G, Manisty CH, Raman B, et al. Maximal wall thickness measurement in hypertrophic cardiomyopathy: biomarker variability and its impact on clinical care. JACC Cardiovasc Imaging. 2021; 14(11): 2123–2134. DOI: 10.1016/j.jcmg.2021.03.032 [DOI] [PubMed] [Google Scholar]
- 11.Finocchiaro G, Sheikh N, Biagini E, et al. The electrocardiogram in the diagnosis and management of patients with hypertrophic cardiomyopathy. Heart Rhythm. 2020; 17(1): 142–151. DOI: 10.1016/j.hrthm.2019.07.019 [DOI] [PubMed] [Google Scholar]
- 12.Montgomery JV, Harris KM, Casey SA, et al. Relation of electrocardiographic patterns to phenotypic expression and clinical outcome in hypertrophic cardiomyopathy. Am J Cardiol. 2005; 96(2): 270–275. DOI: 10.1016/j.amjcard.2005.03.058 [DOI] [PubMed] [Google Scholar]
- 13.Maron BJ, Friedman RA, Kligfield P, et al. Assessment of the 12-lead electrocardiogram as a screening test for detection of cardiovascular disease in healthy general populations of young people (12–25 years of age): a scientific statement from the American Heart Association and the American College of Cardiology. J Am Coll Cardiol. 2014; 64(14): 1479–1514. DOI: 10.1016/j.jacc.2014.05.006 [DOI] [PubMed] [Google Scholar]
- 14.Guo L, Gao C, Yang W, et al. Derivation and validation of a screening model for hypertrophic cardiomyopathy based on electrocardiogram features. Frontiers in Cardiovascular Medicine. 2022; 9. DOI: 10.3389/fcvm.2022.889523 [DOI] [PMC free article] [PubMed] [Google Scholar]
- 15.Ko WY, Siontis KC, Attia ZI, et al. Detection of hypertrophic cardiomyopathy using a convolutional neural network-enabled electrocardiogram. J Am Coll Cardiol. 2020; 75(7): 722–733. DOI: 10.1016/j.jacc.2019.12.030 [DOI] [PubMed] [Google Scholar]
- 16.Lyon A, Ariga R, Mincholé A, et al. Distinct ECG phenotypes identified in hypertrophic cardiomyopathy using machine learning associate with arrhythmic risk markers. Frontiers in physiology. 2018; 9: 213–226. DOI: 10.3389/fphys.2018.00213 [DOI] [PMC free article] [PubMed] [Google Scholar]
- 17.Authors/Task Force M, Elliott PM, Anastasakis A, et al. 2014 ESC guidelines on diagnosis and management of hypertrophic cardiomyopathy: The task force for the diagnosis and management of hypertrophic cardiomyopathy of the European Society of Cardiology (ESC). Eur Heart J. 2014; 35(39): 2733–2779. DOI: 10.1093/eurheartj/ehu284 [DOI] [PubMed] [Google Scholar]
- 18.Gersh BJ, Maron BJ, Bonow RO, et al. 2011 ACCF/AHA guideline for the diagnosis and treatment of hypertrophic cardiomyopathy: A report of the American College of Cardiology Foundation/American Heart Association Task Force on Practice Guidelines. Circulation. 2011; 124(24): e783–831. DOI: 10.1161/CIR.0b013e318223e2bd [DOI] [PubMed] [Google Scholar]
- 19.Nagueh SF, Smiseth OA, Appleton CP, et al. Recommendations for the evaluation of left ventricular diastolic function by echocardiography: an update from the American Society of Echocardiography and the European Association of Cardiovascular Imaging. Eur Heart J Cardiovasc Imaging. 2016; 17(12): 1321–1360. DOI: 10.1093/ehjci/jew082 [DOI] [PubMed] [Google Scholar]
- 20.Lang RM, Badano LP, Mor-Avi V, et al. Recommendations for cardiac chamber quantification by echocardiography in adults: an update from the American Society of Echocardiography and the European Association of Cardiovascular Imaging. J Am Soc Echocardiogr. 2015; 28(1): 1–39. DOI: 10.1016/j.echo.2014.10.003 [DOI] [PubMed] [Google Scholar]
- 21.Alba AC, Agoritsas T, Walsh M, et al. Discrimination and calibration of clinical prediction models: users’ guides to the medical literature. JAMA. 2017; 318(14): 1377–1384. DOI: 10.1001/jama.2017.12126 [DOI] [PubMed] [Google Scholar]
- 22.Fitzgerald M, Saville BR, Lewis RJ. Decision curve analysis. JAMA. 2015; 313(4): 409–410. DOI: 10.1001/jama.2015.37 [DOI] [PubMed] [Google Scholar]
- 23.Zhou M, Ta S, Hahn RT, et al. Percutaneous intramyocardial septal radiofrequency ablation in patients with drug-refractory hypertrophic obstructive cardiomyopathy. JAMA Cardiol. 2022; 7(5): 529–538. DOI: 10.1001/jamacardio.2022.0259 [DOI] [PMC free article] [PubMed] [Google Scholar]
- 24.Gossios T, Savvatis K, Zegkos T, et al. Deciphering hypertrophic cardiomyopathy with electrocardiography. Heart Fail Rev. 2022; 27(4): 1313–1323. DOI: 10.1007/s10741-021-10147-0 [DOI] [PubMed] [Google Scholar]
- 25.Savage DD, Seides SF, Clark CE, et al. Electrocardiographic findings in patients with obstructive and nonobstructive hypertrophic cardiomyopathy. Circulation. 1978; 58(3 Pt 1): 402–408. DOI: 10.1161/01.CIR.58.3.402 [DOI] [PubMed] [Google Scholar]
- 26.Tison GH, Siontis KC, Abreau S, et al. Assessment of disease status and treatment response with artificial intelligence-enhanced electrocardiography in obstructive hypertrophic cardiomyopathy. J Am Coll Cardiol. 2022; 79(10): 1032–1034. DOI: 10.1016/j.jacc.2022.01.005 [DOI] [PMC free article] [PubMed] [Google Scholar]
- 27.Chen Y, Sun G, Guo X, et al. Performance of a novel ECG criterion for improving detection of left ventricular hypertrophy: a cross-sectional study in a general Chinese population. BMJ Open. 2021; 11(9): e051172. DOI: 10.1136/bmjopen-2021-051172 [DOI] [PMC free article] [PubMed] [Google Scholar]
- 28.Van Kleef M, Visseren FLJ, Vernooij JWP, et al. Four ECG left ventricular hypertrophy criteria and the risk of cardiovascular events and mortality in patients with vascular disease. J Hypertens. 2018; 36(9): 1865–1873. DOI: 10.1097/HJH.0000000000001785 [DOI] [PubMed] [Google Scholar]
- 29.Mino T, Kimura S, Kitaura A, et al. Can left ventricular hypertrophy on electrocardiography detect severe aortic valve stenosis? PLoS One. 2020; 15(11): e0241591. DOI: 10.1371/journal.pone.0241591 [DOI] [PMC free article] [PubMed] [Google Scholar]
- 30.Girasis C, Vassilikos V, Efthimiadis GK, et al. Patients with hypertrophic cardiomyopathy at risk for paroxysmal atrial fibrillation: advanced echocardiographic evaluation of the left atrium combined with non-invasive P-wave analysis. Eur Heart J Cardiovasc Imaging. 2013; 14(5): 425–434. DOI: 10.1093/ehjci/jes172 [DOI] [PubMed] [Google Scholar]
- 31.Tuluce K, Ozerkan F, Yakar Tuluce S, et al. Relationships between P wave dispersion, atrial electromechanical delay, left atrial remodeling, and NT-proBNP levels, in patients with hypertrophic cardiomyopathy. Cardiol J. 2015; 22(1): 94–100. DOI: 10.5603/CJ.a2014.0025 [DOI] [PubMed] [Google Scholar]
- 32.Ozdemir O, Soylu M, Demir AD, et al. P-wave durations as a predictor for atrial fibrillation development in patients with hypertrophic cardiomyopathy. Int J Cardiol. 2004; 94(2–3): 163–166. DOI: 10.1016/j.ijcard.2003.01.001 [DOI] [PubMed] [Google Scholar]
- 33.Tani T, Tanabe K, Ono M, et al. Left atrial volume and the risk of paroxysmal atrial fibrillation in patients with hypertrophic cardiomyopathy. J Am Soc Echocardiogr. 2004; 17(6): 644–648. DOI: 10.1016/j.echo.2004.02.010 [DOI] [PubMed] [Google Scholar]
- 34.Lu DY, Pozios I, Haileselassie B, et al. Clinical outcomes in patients with nonobstructive, labile, and obstructive hypertrophic cardiomyopathy. J Am Heart Assoc. 2018; 7(5): e006657. DOI: 10.1161/JAHA.117.006657 [DOI] [PMC free article] [PubMed] [Google Scholar]
- 35.Pozios I, Corona-Villalobos C, Sorensen LL, et al. Comparison of outcomes in patients with nonobstructive, labile-obstructive, and chronically obstructive hypertrophic cardiomyopathy. Am J Cardiol. 2015; 116(6): 938–944. DOI: 10.1016/j.amjcard.2015.06.018 [DOI] [PMC free article] [PubMed] [Google Scholar]
- 36.Geske JB, Sorajja P, Ommen SR, et al. Variability of left ventricular outflow tract gradient during cardiac catheterization in patients with hypertrophic cardiomyopathy. JACC Cardiovasc Interv. 2011; 4(6): 704–709. DOI: 10.1016/j.jcin.2011.02.014 [DOI] [PubMed] [Google Scholar]
- 37.Cheng TO. Mechanisms of variability of left ventricular outflow tract gradient in hypertrophic cardiomyopathy. Int J Cardiol. 2010; 145(2): 169–171. DOI: 10.1016/j.ijcard.2010.05.051 [DOI] [PubMed] [Google Scholar]
- 38.Zuo L, Hsi D, Zhang L, et al. Electrocardiographic QRS voltage amplitude improvement by intramyocardial radiofrequency ablation in patients with hypertrophic obstructive cardiomyopathy and one year follow up. Journal of electrocardiology. 2020; 61: 164–169. DOI: 10.1016/j.jelectrocard.2020.06.013 [DOI] [PubMed] [Google Scholar]
- 39.Kwon JM, Lee SY, Jeon KH, et al. Deep learning-based algorithm for detecting aortic stenosis using electrocardiography. J Am Heart Assoc. 2020; 9(7): e014717. DOI: 10.1161/JAHA.119.014717 [DOI] [PMC free article] [PubMed] [Google Scholar]
- 40.Siontis KC, Liu K, Bos JM, et al. Detection of hypertrophic cardiomyopathy by an artificial intelligence electrocardiogram in children and adolescents. Int J Cardiol. 2021; 340: 42–47. DOI: 10.1016/j.ijcard.2021.08.026 [DOI] [PubMed] [Google Scholar]
Associated Data
This section collects any data citations, data availability statements, or supplementary materials included in this article.
Supplementary Materials
Figures 1 and 2.