

Abstract
Objective
Elevated interleukin 10 (IL10) in SLE patients has B-cell promoting effects, contributing to autoantibody production and tissue damage. We aimed to characterize upregulated IL10+ B-cell subsets and dysregulated IL10 expression in SLE B cells for new therapeutic options.
Methods
Proportions of Th10 and IL10+ B-cell subsets in PBMCs were assessed using flow cytometry. The IL10-3’UTR dual-luciferase vector was constructed and co-transfected with siRNA, miRNA mimics or inhibitors into RAJI cell line. Transcript levels were quantified using Taqman assays.
Results
Culture conditions that induced IL10+ Breg in healthy controls (HC) resulted in expansion of IL10+ DN2 (IgD−CD27−CD21−CD11c+) B-cells in SLE PBMCs. Proportions of IL10+ DN2, but not those of IL10− DN2, correlated with disease activity, levels of antibodies to dsDNA, and associated with high levels or seropositivity of anti-Smith and anti-cardiolipin IgG in SLE patients from two cohorts of mainly African Americans and Asians, respectively. Proportions of Th10 (CD45RA−CXCR5−CXCR3+PD1hiCD4+) cells correlated with IL10+ DN2 frequencies, ANA titers and proteinuria levels in SLE patients. Screening predicted IL10 3’UTR-targeting miRNAs in SLE B cells identified miR-17-5p and miR-20a-5p with their levels inversely correlated with IL10 and transcription factor E2F2. In RAJI cells, knockdown of E2F2 expression resulted in increased levels of miR-17-5p and miR-20a-5p and decreased IL10 mRNA and protein levels, and overexpression and inhibition of miR-17-5p down-regulated and up-regulated IL10 mRNA levels respectively; suggesting regulation of IL10 expression by E2F2-miR-17-5p loop.
Conclusion
IL10 promotes extrafollicular autoimmune responses in active SLE patients, which might be dampened by targeting the E2F2-miR-17-5p circuitry.
Keywords: Interleukin 10, B-cell subsets, Autoantibody, Extrafollicular autoimmune responses, microRNA
Introduction
IL10 is an anti-inflammatory cytokine that also has B-cell promoting ability, contributing to autoantibody production and tissue damage in SLE (1). It is well documented that serum levels of IL10 are elevated in SLE patients associated with disease activity (2). While SLE-associated risk variants contribute to transcripts levels of IL10, nongenetic disease state further augments IL-10 levels in SLE PBMCs, especially in B and T cells (3, 4).
The identity of IL10+ B-cell subset(s) in SLE remains unclear. B cells producing IL10, known as regulatory B cells (Bregs), contribute to the maintenance of immune tolerance (5, 6). However, differentiation signals established in HC to induce IL10 production by CD24hiCD38hi B cells are defective in SLE patients, and Bregs from SLE patients are functionally impaired to restrain interferon-α (IFN-α) production by plasmacytoid dendritic cells (pDCs) (7, 8).
IL10 is also produced by helper T-cells in SLE especially during active disease (4). A novel T cell subset, defined as Th10 (CD4+CD45RA−CXCR5−CXCR3+PD1hi), were expanded in the blood of SLE patients and enriched in kidneys, providing B-cell help through secretion of IL10 and succinate in extrafollicular autoimmune responses (9). The mitochondrial DNA (a TLR9 ligand) released during the disease process of SLE is linked to the generation of this subset. As TLR9 ligands also play a critical role in the differentiation of IL10 producing B cell subset, IL10 may promote T-B interaction in the extra-follicular humoral immune pathway.
IgD−CD27−CD21−CD11c+ (double negative 2, DN2) B cells are expanded in PBMCs of SLE patients, especially in African American patients with active disease (10). DN2 cells, derived from autoreactive naïve B cells, hyperactively respond to innate stimuli to become precursors of pre-plasma cells through extrafollicular reactions (11, 12). DN2 B cells from SLE patients express IL10 receptors, which make them a candidate to interact with Th10 in expanding extrafollicular autoimmune responses (10).
Here we aimed to identify differentially upregulated IL10+ B cells in SLE patients, to understand the role of IL10 in extrafollicular autoimmune responses, and to explore potential molecular targets that might dampen IL10 expression in SLE B cells.
Methods
Subjects
All SLE patients fulfilled at least 4 of the 11 American College of Rheumatology revised criteria for SLE (13). SLE patients and HC of cohort 1 provided written consent forms of the study approved by the Institutional Review Boards of Medical University of South Carolina. The cohort 2 study was approved by the Ethical Committee of the First Affiliated Hospital of Nanjing Medical University, and all donors provided written informed consent. Disease activity was assessed using the SELENA–SLEDAI score (14). The characteristics of the two cohorts are shown in Table 1.
Table 1.
Demographics and clinical characteristics of SLE patients and healthy controls from two cohorts.
| Cohort 1 | Cohort 2 | |||
|---|---|---|---|---|
| SLE (n=51) | Control (n=25) | SLE (n=61) | Control (n=40) | |
| Location | Charleston, U.S | Charleston, U.S | Nanjing, CHN | Nanjing, CHN |
| Female, n (%) | 49 (96.1) | 25 (100) | 56 (91.8) | 34 (85.0) |
| Age, mean (range) | 46 (20-78) | 41 (24-69) | 33 (15-63) | 36 (21-65) |
| Ancestry, n (%) | ||||
| African American | 40 (78.4) | 19 (76.0) | - | - |
| Asian | 1 (2.0) | 3 (12.0) | 61 (100) | 40 (100) |
| European American | 10 (19.6) | 3 (12.0) | - | - |
| Disease manifestations, n (%) | ||||
| Fever | 5 (9.8) | 25 (50.0) | ||
| Rash | 10 (19.6) | 32 (52.5) | ||
| Alopecia | 11 (21.6) | 21 (34.4) | ||
| Non-Erosive Arthritis | 4 (7.8) | 24 (39.3) | ||
| Oral ulcer | 13 (25.5) | 27 (44.2) | ||
| Cutaneous vasculities | 5 (9.8) | 7 (16.3) | ||
| Serositis | 6 (11.8) | 17 (27.9) | ||
| NPSLE | 2 (3.9) | 5 (8.2) | ||
| LN | 3 (5.9) | 33 (54.1) | ||
| Leukopenia and/or Thrombocytopenia | 11 (21.6) | 20 (48.8) | ||
| Laboratory features, mean ± SD | ||||
| Anti-dsDNA-IgG (IU/ml; RU/ml) | 28.9 ± 58.0 | 250 ± 257 | ||
| Anti-Sm (U/ml; n (%)) | 28.1 ± 42.1 | 33 (54.1)* | ||
| ACA-IgG (RU/ml) | 15.5 ± 8.3 | 15.0 ± 11.2 | ||
| ACA-IgM (RU/ml) | - | 16.3 ± 11.9 | ||
| IgG (g/L) | - | 16.0 ± 8.5 | ||
| C3 (g/L) | 1.25 ± 0.39 | 0.55 ± 0.22 | ||
| C4 (g/L) | 0.26 ± 0.10 | 0.11 ± 0.06 | ||
| Proteinuria (mg/24h) | - | 1716.6 ± 2640.6 | ||
| Proteinuria/Creatinine ratio | 176.3 ± 145.3 | - | ||
| SLEDAI score, mean ± SD (range) | 3.0 ± 3.7 (0-18) | 10.9 ± 6.0 (2-29) | ||
| Medication, n (%) | ||||
| Prednisone | 18 (35.3) | 58 (95.1) | ||
| Hydroxychloroquine | 46 (90.2) | 55 (90.2) | ||
| Cyclophosphamide | 1 (2.0) | 9 (14.8) | ||
| Azathioprine | 24 (47.1) | 8 (13.1) | ||
| Methotrexate | 2 (3.9) | 6 (9.8) | ||
| Mycophenolate mofetil | 20 (39.2) | 27 (44.3) | ||
| Cyclosporine | 1 (2.0) | 5 (8.2) | ||
| Tacrolimus | - | 12 (19.7) | ||
Denotes the percent of anti-Smith presence in SLE patients.
Abbreviations. NPSLE, neuropsychiatric systemic lupus erythematosus; Anti-dsDNA, anti-double stranded DNA antibody; LN, lupus nephritis; ACA, anticardiolipin antibody; IgG, immunoglobin G; C3, complement 3; C4, complement 4;
Preparation of blood samples and flow cytometric analysis
PBMCs, isolated by Ficoll-Paque Plus (Amersham Biosciencs) gradient centrifugation from participants’ blood samples, pretreated with FC block (BD Bioscience) in phosphate buffered saline/0.5% bovine serum albumin/5mM EDTA for 10 minutes at 4°C, were incubated with specific monoclonal antibodies, for B-cell subsets: CD19, IgD, CD27, CXCR5, CD21, CXCR3, IL10Ra, IL21R and CD95; for T-cell subsets: CD3, CD4, CD45RA, CXCR5, CXCR3, IL21, IL10 and PD1 as described in supplementary Table 2. For intracellular protein detection, PBMCs in 6-well plates were cultured with complete media (RPMI 1640, 10% FBS, glutamine, and Pen/Strep), 50ng/ml PMA (Sigma), 250ng/ml ionomycin (Sigma) and GolgiPlug (BD Biosciences) for ≥ 5 hours, fixed and permeabilized, and stained for detection of intracellular cytokines with IL-10, T-bet with intracellular staining reagents according to manufacturer’s instructions (eBioscience). All samples subjected to BD LSRFortessa X-20 (cohort 1) or BD AriaII (cohort 2) analysis, and data were analyzed with FlowJo software (Treestar, Ashland, OR).
B cells differentiation assay
Freshly isolated PBMCs (2*106 cells/ml) of SLE patients and HC were cultured with medium alone or with Class C CpG, (1μM; InvivoGen) and IFN-α (1000 U/ml; PBL Biomedical Laboratories) in RPMI 1640 medium with10% FBS for 24 hours. Subsequently, cells were washed, stained and subjected to flow cytometry.
Cells isolation and cell sorting
B cells were isolated by positive selection from PBMCs using EasySep™ Human CD19 Positive Selection Kit II (STEMCELL), according to the manufacturer’s instructions. The purity of isolated B cells (>95%) was assessed by flow cytometric analysis. Enriched cells were then stained with anti-IgD BV650, anti-CD27 BV421 and anti-CD19 PE-Cy5.5 and sorted as IgD+CD27−CD19+ cells (naive), IgD−CD27+CD19+ cells (switched memory), IgD+CD27+CD19+ (unswitched memory) or IgD−CD27−CD19+ cells (double negative).
For blood CD4+ T cell subset sorting, frozen peripheral blood mononuclear cells from individuals with SLE were stained with anti-CD4 BV711, anti-CXCR5 APC, anti-CD45RA PE/Cy7, anti-PD1 PE, anti-CD3 BV650, anti-IL-10 AF488, anti-IL-21 PerCP/Cyanine5.5 and anti-CXCR3 BV421. Then, CXCR3+PD1hiCD4+ T cell population was sorted from the CD3+CD4+CD45RA− CXCR5− cell fraction. Cell sorting was performed on a BD FACS Aria II SORP using a 100-μm nozzle. Sort gates were drawn as depicted in Figure 3D. Cell purity was routinely > 98%. For functional analyses, cells were sorted into cold RPMI/10% FBS.
Figure 3.
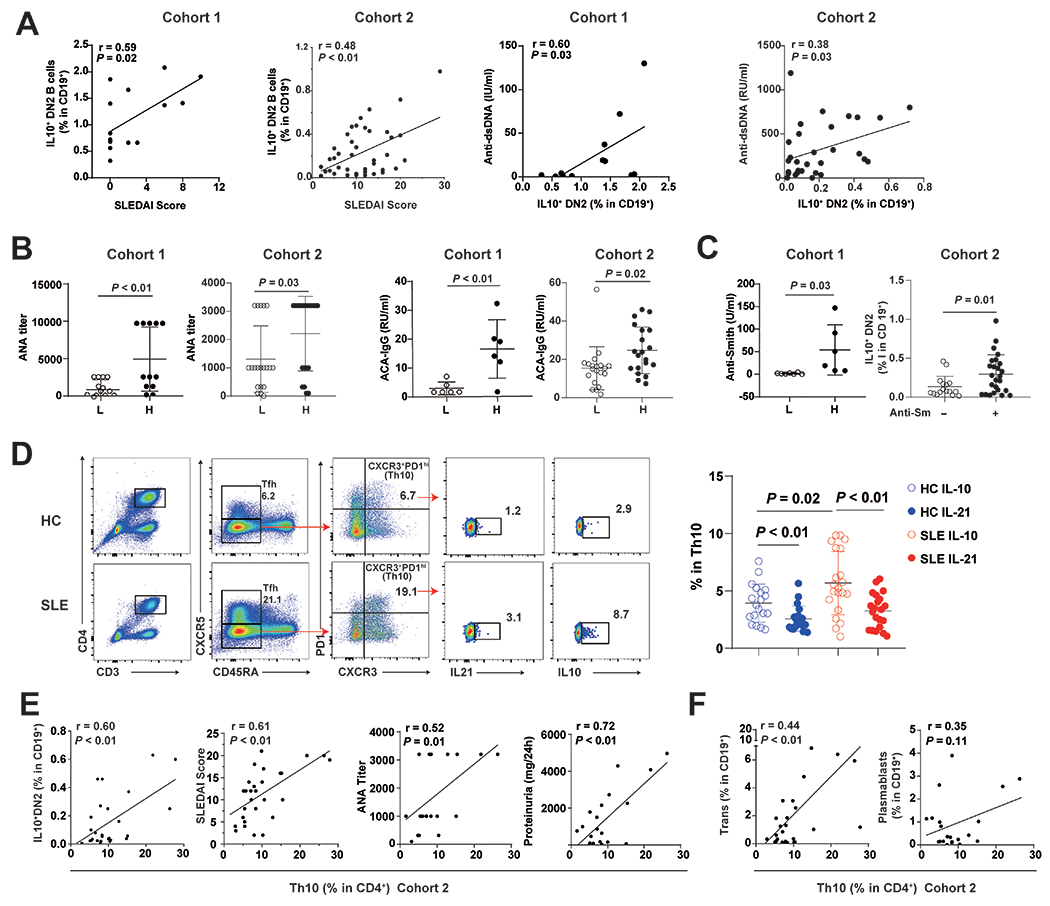
Frequencies of IL10+ DN2 and Th10 cells correlated with disease activities and linked to autoantibody production in SLE patients from multiple cohorts.
(A) Correlation of IL10+DN2 proportions with SLEDAI scores and serum levels of IgG anti-dsDNA antibody in SLE patients of cohort 1 (SLE, n=15) and 2 (SLE, n=41). (B) Serum levels of ANA titers, levels of anticardiolipin antibody (ACA) in patients with low (L) or high (H) frequencies of IL10+ DN2 cells from cohort 1 (SLE, n=13) and 2 (SLE, n=30). (C) Serum anti-Smith antibody levels or seropositivity in patients with low (L) or high (H) frequencies of IL10+ DN2 cells from cohort 1 (SLE, n=25) and 2 (SLE, n=41). (D) Gating strategy for Th10 cells and the frequency of IL10+ or IL21+ cells among Th10 cells from cohort 2 (HC, n=20; SLE, n=21). (E) Correlation of Th10 frequencies with proportions of IL10+ DN2, SLEDAI scores, serum levels of ANA titers and levels of 24h proteinuria in SLE patients from cohort 2, as well as proportions of transitional B and plasmablast cells (F). Each symbol represents a sample from one individual subject. Horizontal lines and error bars depict mean ± SEM. P values were determined by Mann-Whiney U test and Spearman’s rank correlation.
B cell cultures
The isolation of B cells is as described above. For cocultures of B and T cells, CD19+ B cells (from healthy donor) were cocultured with CXCR3+PD1hiCD4+ T cells (from SLE patients) (2×10⁴ B cells and 2×10⁴ Th10 cells) in RPMI supplemented with 10% heat-inactivated FBS. Anti-IL-10 (10μg/ml; clone JES3-9D7; BioLegend), anti-SUCNR1/GPR91 (20μg/ml; Novus Biological), or anti-IL-21R (10μg/ml; clone 17A12; BioLegend) was added during the coculture. IgG concentrations were measured at day 7 in the supernatants using the IgG Human ELISA Kit (Thermo Fisher).
Quantitative real-time PCR and ELISA assay
Total RNA was extracted from isolated B cells and RAJI lymphoblastoid cell line cells (ATCC CCL-86) using Trizol reagent (Invitrogen), and reverse transcribed into cDNA using Superscript II Reverse Transcription kit (Invitrogen) to measure levels of IL10, E2F1, E2F2, E2F3 and housekeeping gene (RPLP0 or GAPDH) using TaqMan assays (Life Technologies). The levels of 13 miRNAs were quantified using TaqMan Advanced miRNA Assays (Life Technologies) normalized using levels of miR-361 (Life Technologies). All relative expression levels were calculated by the 2−ΔΔCT method and Log10 transformed. miRNA and mRNA primers used for quantitative real-time PCR are listed in supplementary Table 3.
IL10 levels in supernatants were measured by ELISA kit (RayBiotech), according to the manufacturer’s instructions.
Transfection of the microRNA mimics, antagomiRs and small interfering RNAs
RAJI cells (ATCC CCL-86), cultured in RPMI 1640 medium with 10% FBS, seeded on a 24-well plate (1×10⁶ cell/well), transfected with mimics/AntagomiRs of miR-17, miR-20a, miR-106a or the negative control (200nM, respectively; Ambion, Invitrogen) by electroporation using the Nucleofector System (Amaxa), were harvested after 24h for gene expression assay.
Accell small interfering RNAs (siRNAs) targeting E2F2 (E-003260) and nontargeting sequences (as negative control; D-001910) were purchased from Dharmacon. RAJI cells, cultured in Accell delivery media plus 1 μM siRNA, distributed to 24-well plates at 2×10⁵ cell/ well, and divided into silenced groups for E2F2, nontargeting and medium-only mock controls. Cells were incubated at 37°C with 5% CO2 for 72 hours, supernatants were collected and cells were harvested to measure specific inhibition of E2F2 by quantitative real-time PCR.
Plasmid construction and luciferase reporter assay
The amplification of 1034-bp fragments of the 3’-UTR of IL10 was achieved by PCR using genomic DNA from a healthy European American using the following primers: 5′-CCGCTCGAGCACAGCTCCAAGAGAAAGGC-3′ (forward) and 5′-AGAGCGGCCGCCTTGGGAGCTTTGAGAGAACA-3′ (reverse). PCR products were digested using restriction enzymes and subcloned into the psiCHECK2 luciferase reporter vector (Promega). RAJI cells were seeded on 24-well plates at 1×10⁶ cells/well. The luciferase construct (1μg) and empty psiCHECK2 vector (1μg) were electroporated either alone or together with oligonucleotides (antagomiRs) using nucleofector (Amaxa), and Renilla plasmid (10ng) was used as the endogenous control. Luciferase activity in cell lysates was measured after 24-hours using a dual luciferase reporter assay (Promega).
Statistical analysis.
For comparing between two groups, Student’s t test and paired t test were used if the variance was normally distributed; whereas Mann–Whitney U test and Spearman’s rank correlation were used if the variance was not normally distributed. P<0.05 was considered statistically significant. Data were analyzed using GraphPad Prism 8 software (GraphPad Software, San Diego, CA).
Results
Expansion of IL10+DN B cells induced by IFN-α and CpG in SLE PBMCs from two independent cohorts
To begin understanding the role of IL10 expression in SLE B cells, we compared induced B cell subsets derived from HC or SLE PBMCs after culturing in the presence or absence of IFN-α and a class C CpG (a TLR9 ligand that could activate both pDCs and B cells present in PBMCs) for 24 hours using flow cytometry (Figure 1A and 1B) (15). Intracellular staining for IL-10 demonstrated a trend of higher percentage of total IL10+ B cells in HC but not in SLE patients from cohort 1, mainly composed of African-American (Figure 1B and Table 1). The induced IL10-expressing B cells were enriched in IL10+ Bregs in HC (IL10+CD24hiCD38hi; Figure 1C), but within IL10+DN B cells in SLE patients (Figure 1D), confirming defective Breg induction in SLE patients (8). To independently verify that stimulation of CpG and IFN-α resulted in the enlargement of IL10+ DN B cell subset in SLE PBMCs, we used a second cohort of Asian SLE patients (Table 1), which confirmed findings from cohort 1 (Figure 1 B, C and D) and showed upregulation of IL10+ DN B cells were enriched within IL10+ DN2 B cells (Figure 1E).
Figure 1.
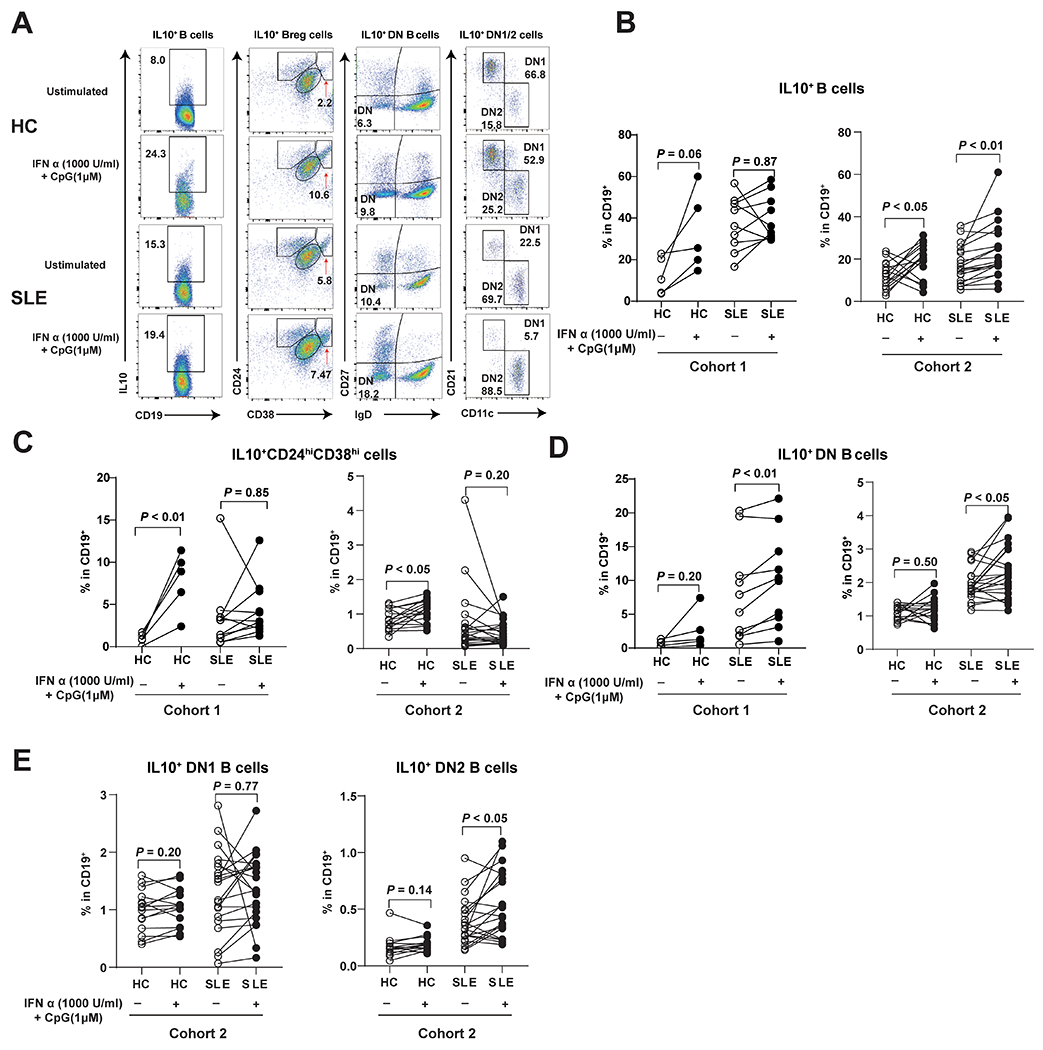
PBMC Culture conditions that upregulated regulatory B cells in healthy controls expanded IL10+ DN and IL10+ DN2 B cells in SLE patients.
(A) Representative flow cytometry plots for IL10+ B cells, IL10+Breg cells, IL10+ DN cells, and IL10+ DN1/2 cells with or without stimulated by Class C CpG and IFN-α. Graphs depict frequency changes of IL10+ B cells (B), and B cell subsets including IL10+ regulatory B cells (IL10+CD24hiCD38hi, C), IL10+ double negative B cells (IL10+IgD−CD27−, D) in HC and SLE patients from (HC, n=5; SLE, n=11) and 2 (HC, n=16; SLE, n=21), and IL10+ double negative 1 B cells (IL10+ DN1, IgD−CD27−CD21+CD11c−), IL10+ double negative 2 B cells (IL10+ DN2, IgD−CD27−CD21−CD11c+, E) in SLE patients from cohort 2 (HC, n=16; SLE, n=21). Each symbol represents a sample from one individual subject. Closed and open symbols depict stimulated and unstimulated pair samples in cultures. P values were determined by paired t test.
Expansion of IL10+ DN2 B cell subset in ex vivo SLE PBMCs enriched in IL10Ra
We next evaluated which B cell subset could account for the IL10-overproduction in ex vivo SLE B cells from cohort 1 mainly African American patients and cohort 2 Asian patients (Table 1). Flow cytometry analysis of intracellular IL10 in peripheral B cells showed significantly higher frequencies of IL-10-expressing B cells in SLE patients than HC (Figure 2), but no significant upregulation of IL-10+ B cells in patients with active disease in both cohorts (supplementary Figure 2 B and C), which was consistent with similar IL10 mRNA levels in patients with different disease activities in cohort 1 (supplementary Figure 2A). The enlarged proportions of IL10+ B cells in SLE of both cohorts were enriched in DN or DN2 B cell subsets (Figure 2B and 2C). Compared to cohort 1, SLE patients in cohort 2 had higher disease activity (Table 1) with lower proportions of IL10+ B cells (Figure 2A) and expanded IL10+ activated naïve (aNAV) B cells subset, which was not significantly expanded in cohort 1 (Figure 2C). We confirmed previously findings that SLE patients had expanded DN2 B cells compared to healthy controls (supplementary Figure 1). In both cohorts, differentially upregulated IL10+ B cells in SLE were observed in the DN2 rather than DN1 subset. The mean of IL10 positivity within DN2 B cells were 40% and 20% of SLE patients from cohort 1 and 2, respectively (supplementary Figure 4B) (10). (10).
Figure 2.
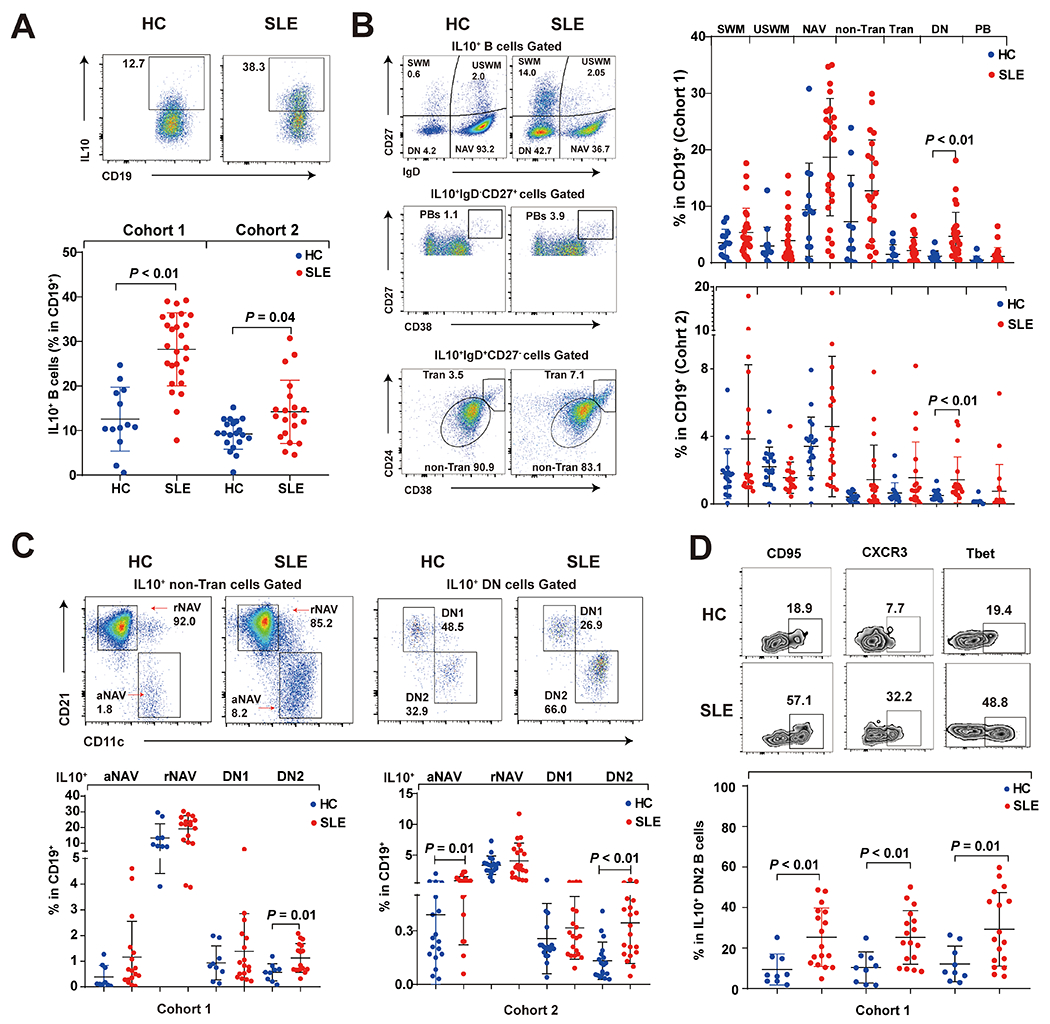
Differentially upregulated IL10+ ex vivo SLE B cells were mainly enriched in the DN2 subset from multiple cohorts.
(A) Flow cytometry analysis showed the frequency of IL10+ B cells among CD19+ B cells in healthy controls and SLE patients from cohort 1 (HC, n=13; SLE, n=20) and 2 (HC, n=20; SLE, n=20). (B) Frequencies of IL10+ B-cell subsets of HC and SLE patients from cohort 1 and cohort 2 were assessed by flow cytometry. IL10+ B cell subsets are identified as switched memory (SWM) = IgD−CD27+, plasmablast (PB) = IgD−CD27hiCD38hi, unswitched memory (USWM) = IgD+CD27+, naïve (NAV) = IgD+D27−, transitional (Tran) =IgD+CD27−CD24+CD38hi, non-transitional (non-Tran) = IgD+CD27−CD24intCD38int. (C) Non-Tran B cells and DN subset were further separated based on levels of CD11c and CD21 into IL10+ resting naïve B cells (IL10+ rNAV, IgD+CD27−CD21+CD11c−), IL10+ activated naïve B cells (IL10+ aNAV, IgD+CD27−CD21−CD11c+), IL10+ DN1 and IL10+ DN2 of cohort 1 (HC, n=9; SLE, n=17) and 2 (HC, n=9; SLE, n=17). (D) IL10+ DN2 cells in cohort 1 (HC, n=9; SLE, n=17) were further assessed for expression of three markers. Each data point represents a single subject that blue dot represents healthy control and red dot represents SLE patients. P values were determined by Mann-Whiney U test.
The inducible subunit of IL10Ra, exhibited higher expression levels in DN2 and IL10+ DN2 B cells from SLE patients of both cohorts (supplementary Figure 4A). As previously reported by Jenks et al (10), we confirmed the presence of IL10Ra on SLE DN2 B cells in both cohort 1 and 2, together with constitutively expressed IL10Rb, provided IL10+ DN2 B cells the possibility for autocrine signaling to become plasma cell precursors (16).
Further phenotypical analysis confirmed IL10+ DN2 B cells from SLE patients of cohort 1 expressed higher levels of the CD95, CXCR3 and T-bet than those from HC (Figure 2D), and these markers were also commonly found in a two additional autoantibody-secreting B cell subsets in SLE: age-associated B cells and atypical memory B cells (17, 18).
Proportions of IL-10+ DN2 B cells and Th10 cells correlated with elevated disease activities and autoantibody production in SLE patients
SLE DN2 B cell subset is previously characterized as precursors of autoantibody producing plasma cells and the proportions of DN2 cells in CD19+ cells of SLE patients correlate with SLEDAI scores (10). To explore the potential role of IL10+ DN2 B cell subset in SLE, we assessed the relationship between proportions of IL10+ DN2 B subset and disease activity as well as levels of SLE-associated autoantibodies. The proportions of IL10+ DN2 B cells in both cohort 1 and cohort 2 positively correlated with SLEDAI scores, levels of anti-dsDNA (Figure 3A), titers of ANA, levels of IgG anti-cardiolipin antibodies (Figure 3B), and the level of (or the presence of) anti-Smith autoantibody (Figure 3C), linking this cell subset with lupus autoantibody production.
Th10 has been reported to provide B cell help, independently of IL-21, through IL-10 and succinate-dependent manner in the extrafollicular pathway contributing to SLE (9). IL21R and IL10Ra, critical for naive B cell differentiation and proliferation, were higher in IL10+ DN2 and IL10+ aNAV cells of SLE patients than those in HC, suggesting that the expansion of IL10+ DN2 in SLE patients were induced by elevated IL-10 and IL-21 (supplemental Figure 3C). Similar to the previous study(9), we confirmed that more Th10 cells in SLE PBMCs expressed IL-10 than those produced IL-21 (Figure 3D). Our new data showed the IgG content in the culture supernatant was significantly decreased by anti-IL-10 or anti-SUCRN1 blockade, but not by anti-IL-21 blockage group, highlighting the importance of IL-10 and SUCRN1, independent of IL-21, in mediating Th10-B interaction and antibody production (supplemental Figure 3D). We also found the correlation between proportions of Th10 cells and SLEDAI score in cohort 2 (Figure 3E)(9). Th10 subset also showed positively correlation with IL10+ DN2 B cells (Figure 3E), suggesting that IL10 receptors present on IL10+ DN2 B cells could interact with IL10 secreting Th10 cells during active disease. Furthermore, proportions of Th10 cells positively correlated with ANA titers and levels of 24h proteinuria (Figure 3E), highlighting the importance of IL-10 producing extrafollicular T helper cells in the pathogenesis of SLE and lupus nephritis. Of note, proportions of Th10 cells positively correlated with frequencies of transitional B cells, and showed a trend of correlation with plasmablast frequencies in cohort 2 (Figure 3F), which was consistent with the previous findings (9).
Both DN2 and IL10+ DN2 B cell subsets exhibited features linked to SLE manifestations. While the mean proportions of IL10+ DN2 B cells represented a minor fraction of total DN2 B cells in either cohort (supplemental Figure 4B), IL10+ DN2 B cells captured most, if not all, features linked to SLE manifestations compared to IL10− DN2 subset in both cohorts (Table 2). While most DN2 B cells were IL10-, the IL10+ DN2 subset exhibited major pathogenic features DN2 B cells in SLE patients, contributing to extrafollicular responses of autoantibody production.
Table 2.
Correlations of frequencies of DN2, IL10+DN2 or IL10−DN2 B cell subsets with SLE manifestations (Cohort 1, n=17; Cohort 2, n=40). Correlation coefficients and P values were depicted.
| Cohort 1 | Cohort 2 | |||||||||||
|---|---|---|---|---|---|---|---|---|---|---|---|---|
| DN2 | IL10+ DN2 | IL10− DN2 | DN2 | IL10+ DN2 | IL10− DN2 | |||||||
| r | P | r | P | r | P | r | P | r | P | r | P | |
| SLEDAI | 0.670 | 0.006 | 0.594 | 0.019 | 0.640 | 0.011 | 0.461 | 0.003 | 0.481 | 0.001 | 0.293 | 0.063 |
| ANA Titer | 0.506 | 0.038 | 0.719 | 0.001 | 0.402 | 0.110 | 0.599 | <0.001 | 0.353 | 0.027 | 0.296 | 0.068 |
| Anti-dsDNA-IgG | 0.625 | 0.022 | 0.722 | 0.005 | 0.546 | 0.053 | 0.548 | 0.002 | 0.379 | 0.038 | 0.422 | 0.018 |
| ACA-IgG | 0.466 | 0.291 | 0.669 | 0.100 | 0.544 | 0.279 | 0.424 | 0.007 | 0.353 | 0.025 | 0.190 | 0.241 |
| Anti-Smith | 0.370 | 0.240 | 0.617 | 0.032 | 0.259 | 0.416 | nd | 0.021 * | nd | 0.023 * | nd | 0.013 * |
| C3 | −0.745 | 0.001 | −0.552 | 0.032 | −0.738 | 0.002 | −0.211 | 0.190 | −0.102 | 0.526 | 0.059 | 0.714 |
| C4 | −0.571 | 0.026 | −0.258 | 0.352 | −0.616 | 0.015 | −0.002 | 0.989 | −0.130 | 0.480 | 0.231 | 0.219 |
| ACA-IgM | nd | nd | nd | nd | nd | nd | 0.081 | 0.621 | 0.061 | 0.702 | 0.013 | 0.936 |
| Total IgG | nd | nd | nd | nd | nd | nd | 0.080 | 0.621 | 0.206 | 0.196 | 0.013 | 0.935 |
| 24h Proteinuria | nd | nd | nd | nd | nd | nd | 0.090 | 0.586 | 0.342 | 0.111 | −0.010 | 0.952 |
| Th10 subset | nd | nd | nd | nd | nd | nd | 0.347 | 0.048 | 0.438 | 0.011 | 0.328 | 0.062 |
| Tfh-like subset | nd | nd | nd | nd | nd | nd | 0.311 | 0.078 | 0.237 | 0.185 | 0.303 | 0.087 |
Denotes association P values for the presence or absence of anti-Smith in SLE patients.
nd denotes not define
Abbreviations. ANA, antinuclear antibody.
Regulation of IL10 expression by interactions of E2F2, miR-17-5p and miR-20a-5p
Dysregulated IL-10 expression in SLE B cells might be under posttranscriptional regulation including microRNA (miRNA) to modulate the transcript stability ad translation activity. Using miRNA target prediction databases (19–21), we identified 13 potential miRNAs that could bind to the 3’UTR of the IL10 mRNA (supplementary Table 1) and assessed their relative expression levels in B cells isolated from cohort 1 containing 25 SLE patients and 12 controls (Table 1). Consistent with flow cytometry data of cohort 1 and 2, elevated IL10 mRNA in SLE B cells observed in cohort 1 (Figure 4A). Compared to HC B cells, SLE B cells showed differential expression levels of 6 among the 13 predicted miRNAs (Figure 4B). Given that miRNAs usually negatively regulate gene expression of their targeted mRNAs (22, 23), we focused on three miRNAs (miR-17-5p, miR-20a-5p and miR-374-5p) with significantly decreased levels in SLE B cells, and found levels of miR-17-5p and miR-20a-5p inversely correlated with levels of IL10 mRNA (Figure 4B and 4C). Both miR-17-5p and miR-20a-5p were predicted to bind to the position 639-646 at the 3’UTR of IL10 mRNA. In addition, miR-106a-5p was previously reported to downregulate IL10 mRNA levels in RAJI cell line (supplementary Figure 5) (24, 25). We further transfected either mimics or antagomiRs of miR-17-5p, miR-20a-5p and miR-106a-5p into RAJI cells to explore their effects on regulating IL10 mRNA levels. Transfection with the mimics of miR-17-5p, miR-20a-5p or miR-106a-5p resulted in significant repression of endogenous IL10 mRNA levels in RAJI cells, while transfection with their respective antagomiRs augmented IL10 mRNA levels (Figure4D). Next, we performed luciferase reporter assays to test if these three miRNAs could directly target the 3’UTR region of IL10. Only transfection with the miR-17-5p antagomiR showed significantly up-regulated luciferase activity (Figure 4D).
Figure 4.
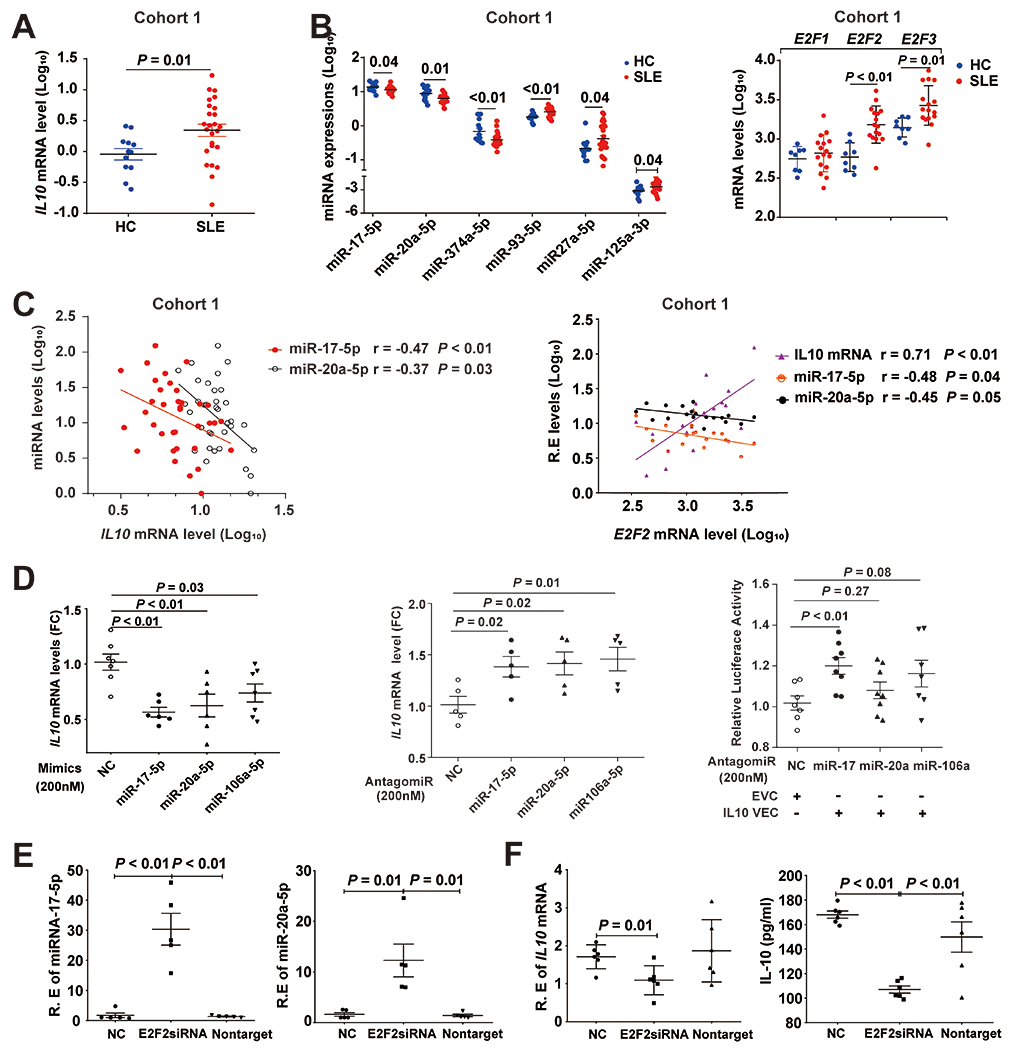
Dysregulated E2F2-miR-17-5p autoregulatory loop contributes to overproduction of IL-10 in SLE B cells. (A) Relative levels of IL10 mRNA of cohort 1 subjects. (B) Differential expression of candidate IL10-3’UTR targeting miRNAs and E2F family members in SLE B cells compared to those from HC B cells in cohort 1. (C) Correlations between levels of IL10 mRNA, E2F2 mRNA, miR-17-5p and miR-20a-5p in B cells of HC and SLE patients from cohort 1. (D) Modulation of endogenous IL10 mRNA levels in RAJI lymphoblastoid-like cell line by transfection of microRNA mimics or antagomiRs, and luciferase reporter gene activity driven by the 3’UTR region of IL10 that were transfected into RAJI cells with or without antagomiRs. (E) Suppression of E2F2 transcription in RAJI cells up-regulated miR-17-5p and miR-20a-5P. (F) Decreased mRNA and protein levels of IL10 in RAJI cells treated with E2F2 siRNA. R.E represents relative expression. FC represents fold change. EVC: Empty vector control; IL10 VEC: psiCHECK-2 vector contains a 1kb segment of IL10 3’UTR region. Bars depict mean ± SEM. P values were determined by Mann-Whiney U test.
Both miR-17-5p and miR-20a-5p are members of the miR-17-92 cluster that its promoter contains binding sites of the E2F family of transcription factors to regulate its transcription, and miR-17 and miR-20 directly inhibit translation of E2F1, E2F2 and E2F3, forming an auto-regulatory loop (26). To explore the role of E2Fs family in regulating levels of miR-17-5p and miR-20a-5p that in turn modulate indirectly levels of IL10 mRNA, we performed RT-PCR and showed that elevated levels of E2F2 and E2F3 in B cells of SLE patients, compared with those from HC of cohort 1 (Figure 4B; left panel). Because E2F2 showed a greater statistical significance in difference between SLE and HC B cells, we explored the relationship of E2F2 levels with levels of IL10 and miRNAs of interest in B cells from cohort 1. We observed negative correlations between levels of E2F2 and levels of either miR-17-5p or miR-20a-5p, and positive correlation between levels of E2F2 and levels of IL10 transcripts (Figure 4C). To assess if these correlations could have a cause-and-effect relationship in vivo, we used RAJI cells as a model to study effects of silencing E2F2 expression by siRNA on levels of IL10, miR-17-5p and miR-20a-5p. The expression of E2F2 in RAJI cells decreased by 43% when treated with E2F2 siRNA (supplementary Figure 6). The administration of E2F2 siRNA resulted in significantly increased levels of miR-17-5p and miR-20a-5p (Figure 4E) and decreased IL10 at both mRNA and protein levels (Figure 4F). These findings support that the dysregulated E2F2-miR-17-5p autoregulatory loop could contribute to overproduction of IL10 in SLE B cells.
Discussions
The immunoregulatory 10 appears to paradoxically play a pathogenic role in SLE presumably due to its effects on promoting growth and differentiation of autoreactive B-cells. However, the cellular source of pathogenic IL10 and cellular targets in SLE are not entirely clear. Given that IL10-producing Bregs cannot be identified directly ex vivo, stimulations of IFN-α and CpG that induced IL-10+CD24hiCD38hi Bregs in HC resulted in expansion of IL10+IgD−CD27− DN B cells in SLE patients, especially in IL10+ DN2 B cell subset. Compared to age-, sex- and ancestry matched controls, SLE patients exhibited increased proportions of IL10+ DN2 cells that correlated with disease activities and levels of autoantibodies. Intriguingly, an important feature of IL10+ DN2 B cells was its strong correlation with Th10 cell subset, which is distinct from Tfh and helps B cells by providing IL-10. As a minor fraction of SLE DN2 B cells, we showed that proportions of IL10+ DN2, but not IL10− DN2, subset strongly correlated with levels of autoantibodies and disease activity scores in SLE patients of mainly African-American ancestry, and confirmed these findings independently in Asian SLE patients, which supports the involvement of IL-10 in the pathogenesis of lupus patients from different genetic backgrounds and geographic locations.
A major characteristic of SLE is an autoreactive B-cell compartment that is periodically re-activated leading to the generation of new bursts of pathogenic antibody-secreting cells (ASC). While IgD−CD27− double negative B cells have been recently shown to represent a small fraction of B cells in healthy individuals, this population is markedly expanded in active SLE patients. The DN B cell subset, a TLR7-induced B-cell effector population that derives from aNAV cells, is poised to differentiate into ASC in active SLE patient. Most prominently, SLE DN2 cells display hyperresponsiveness to a number of stimuli known to contribute to SLE pathogenesis including TLR7, IL-21 and IL-10, develop through extrafollicular reactions, leading to the generation of auto-antibody producing plasmablasts (10, 27). It is generally considered that IL-10R signaling in B cell and/or plasmablasts are keys to its pathogenic effects, which is consistent with the capacity of IL10 to induce survival, proliferation and differentiation of B cells in vitro. Elevated IL10Ra expression was observed in both of DN2 and IL10+ DN2 B cells, supporting the notion that the autocrine function of these IL10 producing B cells makes them well poised to become autoantibody generating plasmablasts. Furthermore, IL0+DN2 cell subset had elevated levels of CD95, CXCR3 and T-bet that were features shared with previously reported autoantibody secreting B cell subsets in SLE (10, 17, 18).
While Tfh are the most potent B helper T-cells, there is increasing evidence that autoreactive T cell-B cell interactions in SLE also occur outside of germinal centers of secondary lymphoid organs. Recently, extra-follicular B helper T-cells have been identified, including the PD1hiCXCR5− T peripheral helper (Tph) and Th10, and they are drivers of autoantibody production in lupus mouse model and SLE patients(9, 28). T cell–B cell interactions occur within the interstitium of kidneys of lupus nephritis patients, and these interactions may drive B cell differentiation into plasma cells within the kidney (29, 30). While Tph cells provide B cell via IL-21 and MAF, Th10 promotes B cells antibody responses in an IL10- and succinate-dependent manner (9). Through in vitro coculture studies, we observed a critical role for IL-10 in the function of Th10 cells from SLE patients. Th10 cells from SLE patients mainly express IL-10, as well as IL-21, and their ability to induce B cells to secrete the IgG in vitro depends on IL-10 and succinate. Moreover, a large fraction of IL-10+CD3+ T cells appeared in close proximity to CD20+ B cells in class IV biopsies of lupus nephritis patients, suggesting that B/T cells and IL10 are a prominent feature of proliferative lupus nephritis infiltrates (9). In our study, frequencies of Th10 exhibited a strong correlation with levels of 24-hours proteinuria in cohort 2 SLE PBMCs, implicating a role of Th10 in kidney damage. While proportions of IL10+ DN2 B cells correlated with levels of antibodies to dsDNA and associated with levels of multiple autoantibodies, Th10 frequencies correlated with ANA titers and proteinuria levels in SLE patients, suggesting the pathogenic nature of these two cell subsets and the important role of IL10 in extrafollicular autoimmune responses in SLE.
MicroRNAs (miRNAs) are well-known to fine-tune cellular gene expression to control immune cell development and regulate adaptive and innate immune responses. We initiated the search of miRNAs that could downregulate IL10 levels in SLE B cells with the notion of specific miRNAs might be used as therapeutic agents. We observed that decreased levels of miR-17-5p and miR-20a correlated to levels of IL10 overproduction in SLE B cells. These two miRNAs are in the polycistronic miR17~92 family that regulates cell cycle by inhibiting E2F transcription factor for a cell to commit for active cellular proliferation and has known immune functions to govern T helper cell differentiation including to promote Tfh cell differentiation (31, 32). In addition to our observation that elevated levels of E2F2 upregulated IL10 in B cells, E2F2 was one of the top ten highly expressed genes in IL10+ enriched CD24hiCD38hi transitional B cells compared to those from naïve B cells (33). E2F1 and E2F2 were also the top differentially expressed genes in Th10 subset, identified by gene ontology analysis (9). Another family member E2F7 was prominently expressed in SLE DN2 B cell subset (10). MicroRNAs associated with the miR-17-92 cluster are crucial regulators of the mammalian cell cycle, as they inhibit transcription factors related to the E2F family that tightly control decision-making events for a cell to commit for active cellular proliferation.
Limitations of the current study include (1) Given that Th10 subset partly share surface markers with Tph subset, Th10 subset in our study may overlap with Tph cells, which also play a pathogenic role in SLE by extrafollicular pathway. (2) Given IL10+ DN2 and Th10 cell subsets each requires a number of fluorescent antibodies for their identification, we could not study their co-localization readily using biopsies from lupus nephritis patients to obtain direct evidence that the interaction between them in the pathogenesis of lupus nephritis.
Our findings demonstrate a prominent role for IL10+ DN2 B cells in the generation of SLE autoantibodies in two independent cohorts with different ethnic background and from two continents, which also provides insight into the molecular underpinnings of abnormal IL10 production in B cells, an E2F2-miR-17-5p/20a-5p auto-regulatory feedback loop. These findings offer new insights into the mechanisms and regulatory networks of IL10 expression, which could be a candidate pathway to develop strategies to modulate expansion of the extrafollicular pathway during active disease of SLE.
Supplementary Material
Acknowledgements
We thank the participants of this study and appreciate the help in subject recruitment supported by NIAMS P60 AR062755 and P30 AR072582.
Funding info
This work was supported by the Alliance for Lupus Research to Betty P. Tsao (Target Identification in Lupus).
Footnotes
Competing interests None of the authors declare any conflicts of interest.
Patient consent for publication Not required.
Ethical approval information This study was approved by the Institutional Reviews Boards (IRB) of Medical University of South Carolina, and the Ethical Committee of the First Affiliated Hospital of Nanjing Medical University.
REFERENCES
- 1.Diefenhardt P, Nosko A, Kluger MA, Richter JV, Wegscheid C, Kobayashi Y, et al. Il-10 receptor signaling empowers regulatory T cells to control Th17 responses and protect from GN. Journal of the American Society of Nephrology. 2018;29(7):1825–37. [DOI] [PMC free article] [PubMed] [Google Scholar]
- 2.Park Y, Lee S, Kim D, Lee J, Lee C, Song C. Elevated interleukin-10 levels correlated with disease activity in systemic lupus erythematosus. Clinical and experimental rheumatology. 1998;16(3):283–8. [PubMed] [Google Scholar]
- 3.Sakurai D, Zhao J, Deng Y, Kelly JA, Brown EE, Harley JB, et al. Preferential binding to Elk-1 by SLE-associated IL10 risk allele upregulates IL10 expression. PLoS Genet. 2013;9(10):e1003870. [DOI] [PMC free article] [PubMed] [Google Scholar]
- 4.Hedrich CM, Rauen T, Apostolidis SA, Grammatikos AP, Rodriguez NR, Ioannidis C, et al. Stat3 promotes IL-10 expression in lupus T cells through trans-activation and chromatin remodeling. Proceedings of the National Academy of Sciences. 2014;111(37):13457–62. [DOI] [PMC free article] [PubMed] [Google Scholar]
- 5.Mauri C, Blair PA. Regulatory B cells in autoimmunity: developments and controversies. Nature reviews Rheumatology. 2010;6(11):636. [DOI] [PubMed] [Google Scholar]
- 6.Tedder TF. B10 cells: a functionally defined regulatory B cell subset. The Journal of Immunology. 2015;194(4):1395–401. [DOI] [PubMed] [Google Scholar]
- 7.Menon M, Blair PA, Isenberg DA, Mauri C. A regulatory feedback between plasmacytoid dendritic cells and regulatory B cells is aberrant in systemic lupus erythematosus. Immunity. 2016;44(3):683–97. [DOI] [PMC free article] [PubMed] [Google Scholar]
- 8.Blair PA, Noreña LY, Flores-Borja F, Rawlings DJ, Isenberg DA, Ehrenstein MR, et al. CD19+ CD24hiCD38hi B cells exhibit regulatory capacity in healthy individuals but are functionally impaired in systemic lupus erythematosus patients. immunity. 2010;32(1):129–40. [DOI] [PubMed] [Google Scholar]
- 9.Caielli S, Veiga DT, Balasubramanian P, Athale S, Domic B, Murat E, et al. A CD4+ T cell population expanded in lupus blood provides B cell help through interleukin-10 and succinate. Nature medicine. 2019;25(1):75–81. [DOI] [PMC free article] [PubMed] [Google Scholar]
- 10.Jenks SA, Cashman KS, Zumaquero E, Marigorta UM, Patel AV, Wang X, et al. Distinct effector B cells induced by unregulated toll-like receptor 7 contribute to pathogenic responses in systemic lupus erythematosus. Immunity. 2018;49(4):725–39. e6. [DOI] [PMC free article] [PubMed] [Google Scholar]
- 11.Jenks SA, Cashman KS, Woodruff MC, Lee FEH, Sanz I. Extrafollicular responses in humans and SLE. Immunological reviews. 2019;288(1):136–48. [DOI] [PMC free article] [PubMed] [Google Scholar]
- 12.Scharer CD, Blalock EL, Mi T, Barwick BG, Jenks SA, Deguchi T, et al. Epigenetic programming underpins B cell dysfunction in human SLE. Nature immunology. 2019;20(8):1071–82. [DOI] [PMC free article] [PubMed] [Google Scholar]
- 13.Hochberg MC. Updating the American College of Rheumatology revised criteria for the classification of systemic lupus erythematosus. Arthritis & Rheumatism: Official Journal of the American College of Rheumatology. 1997;40(9):1725-. [DOI] [PubMed] [Google Scholar]
- 14.Mikdashi J, Nived O. Measuring disease activity in adults with systemic lupus erythematosus: the challenges of administrative burden and responsiveness to patient concerns in clinical research. Arthritis research & therapy. 2015;17(1):183. [DOI] [PMC free article] [PubMed] [Google Scholar]
- 15.Verthelyi D, Zeuner RA. Differential signaling by CpG DNA in DCs and B cells: not just TLR9. Trends in immunology. 2003;24(10):519–22. [DOI] [PubMed] [Google Scholar]
- 16.Heine G, Drozdenko G, Grün JR, Chang HD, Radbruch A, Worm M. Autocrine IL-10 promotes human B - cell differentiation into IgM - or IgG - secreting plasmablasts. European journal of immunology. 2014;44(6):1615–21. [DOI] [PubMed] [Google Scholar]
- 17.Manni M, Gupta S, Ricker E, Chinenov Y, Park SH, Shi M, et al. Regulation of age-associated B cells by IRF5 in systemic autoimmunity. Nature immunology. 2018;19(4):407–19. [DOI] [PMC free article] [PubMed] [Google Scholar]
- 18.Wu C, Fu Q, Guo Q, Chen S, Goswami S, Sun S, et al. Lupus-associated atypical memory B cells are mTORC1-hyperactivated and functionally dysregulated. Annals of the rheumatic diseases. 2019;78(8):1090–100. [DOI] [PMC free article] [PubMed] [Google Scholar]
- 19.Maziere P, Enright AJ. Prediction of microRNA targets. Drug discovery today. 2007;12(11-12):452–8. [DOI] [PubMed] [Google Scholar]
- 20.Sethupathy P, Megraw M, Hatzigeorgiou AG. A guide through present computational approaches for the identification of mammalian microRNA targets. Nature methods. 2006;3(11):881–6. [DOI] [PubMed] [Google Scholar]
- 21.Watanabe Y, Tomita M, Kanai A. Computational methods for microRNA target prediction. Methods in enzymology. 2007;427:65–86. [DOI] [PubMed] [Google Scholar]
- 22.Carissimi C, Fulci V, Macino G. MicroRNAs: novel regulators of immunity. Autoimmunity reviews. 2009;8(6):520–4. [DOI] [PubMed] [Google Scholar]
- 23.Bagga S, Bracht J, Hunter S, Massirer K, Holtz J, Eachus R, et al. Regulation by let-7 and lin-4 miRNAs results in target mRNA degradation. Cell. 2005;122(4):553–63. [DOI] [PubMed] [Google Scholar]
- 24.Sharma A, Kumar M, Aich J, Hariharan M, Brahmachari SK, Agrawal A, et al. Posttranscriptional regulation of interleukin-10 expression by hsa-miR-106a. Proceedings of the National Academy of Sciences. 2009;106(14):5761–6. [DOI] [PMC free article] [PubMed] [Google Scholar]
- 25.Sanctuary MR, Huang RH, Jones AA, Luck ME, Aherne CM, Jedlicka P, et al. miR-106a deficiency attenuates inflammation in murine IBD models. Mucosal immunology. 2019;12(1):200–11. [DOI] [PMC free article] [PubMed] [Google Scholar]
- 26.Concepcion CP, Bonetti C, Ventura A. The miR-17-92 family of microRNA clusters in development and disease. Cancer journal (Sudbury, Mass). 2012;18(3):262. [DOI] [PMC free article] [PubMed] [Google Scholar]
- 27.Wei C, Anolik J, Cappione A, Zheng B, Pugh-Bernard A, Brooks J, et al. A new population of cells lacking expression of CD27 represents a notable component of the B cell memory compartment in systemic lupus erythematosus. J Immunol. 2007;178(10):6624–33. [DOI] [PubMed] [Google Scholar]
- 28.Odegard JM, Marks BR, DiPlacido LD, Poholek AC, Kono DH, Dong C, et al. ICOS-dependent extrafollicular helper T cells elicit IgG production via IL-21 in systemic autoimmunity. The Journal of experimental medicine. 2008;205(12):2873–86. [DOI] [PMC free article] [PubMed] [Google Scholar]
- 29.Chang A, Henderson SG, Brandt D, Liu N, Guttikonda R, Hsieh C, et al. In situ B cell-mediated immune responses and tubulointerstitial inflammation in human lupus nephritis. The Journal of Immunology. 2011;186(3):1849–60. [DOI] [PMC free article] [PubMed] [Google Scholar]
- 30.Liarski VM, Kaverina N, Chang A, Brandt D, Yanez D, Talasnik L, et al. Cell distance mapping identifies functional T follicular helper cells in inflamed human renal tissue. Science translational medicine. 2014;6(230):230ra46–ra46. [DOI] [PMC free article] [PubMed] [Google Scholar]
- 31.Baumjohann D, Kageyama R, Clingan JM, Morar MM, Patel S, De Kouchkovsky D, et al. The microRNA cluster miR-17~ 92 promotes T FH cell differentiation and represses subset-inappropriate gene expression. Nature immunology. 2013;14(8):840. [DOI] [PMC free article] [PubMed] [Google Scholar]
- 32.Bai X, Hua S, Zhang J, Xu S. The MicroRNA family both in normal development and in different diseases: the miR-17-92 cluster. BioMed research international. 2019;2019. [DOI] [PMC free article] [PubMed] [Google Scholar]
- 33.Bigot J, Pilon C, Matignon M, Grondin C, Leibler C, Aissat A, et al. Transcriptomic Signature of the CD 24hi CD 38hi Transitional B Cells Associated With an Immunoregulatory Phenotype in Renal Transplant Recipients. American Journal of Transplantation. 2016;16(12):3430–42. [DOI] [PubMed] [Google Scholar]
Associated Data
This section collects any data citations, data availability statements, or supplementary materials included in this article.