

Abstract
Background:
The benefits of standardized care for cardiogenic shock (CS) across regional care networks are poorly understood.
Objectives:
We compared the management and outcomes of CS patients initially presenting to hub versus spoke hospitals within a regional care network.
Methods:
We stratified consecutive patients enrolled in our CS registry (January 2017-December 2019) by presentation to a spoke versus the hub. The primary endpoint was 30-day mortality. Secondary endpoints included bleeding, stroke, or major adverse cardiovascular and cerebrovascular events (MACCE).
Results:
Of 520 CS patients, 286 (55%) initially presented to 34 spoke hospitals. No difference in mean age (62 vs 61 years; p=0.38), sex (25% vs 32% female; p=0.10) and race (54 % vs. 52% white; p=0.82) between spoke and hub patients was noted. Spoke patients more often presented with acute myocardial infarction (50% vs. 32%; p<0.01), received vasopressors (74% vs 66%; p=0.04), and intra-aortic balloon pumps (88% vs 37%; p<0.01). Hub patients were more often supported with percutaneous ventricular assist devices (44% vs 11%; p<0.01) and veno-arterial extracorporeal membrane oxygenation (13% vs 0%; p<0.01). Initial presentation to a spoke was not associated with increased risk-adjusted 30-day mortality (adjusted OR: 0.87; 95% CI: 0.49–1.55; p=0.64), bleeding (adjusted OR: 0.89; 95% CI: 0.49–1.62; p=0.70), stroke (adjusted OR: 0.74; 95% CI: 0.31–1.75; p=0.49) or MACCE (adjusted OR 0.83; 95% CI: 0.50–1.35; p=0.44).
Conclusions:
Spoke and hub patients experienced similar short-term outcomes within a regionalized CS network. The optimal strategy to promote standardized care and improved outcomes across regional CS networks merits further investigation.
Keywords: Cardiogenic shock, systems of care, hub and spoke networks
INTRODUCTION
The incidence of cardiogenic shock (CS) continues to rise, and in-hospital mortality remains over 40% (1). CS accounts for approximately 15% of all contemporary cardiac intensive care unit (CICU) admissions (2). Given the paucity of randomized controlled trials, the management and outcomes of CS vary significantly (3). Similar to other acute cardiovascular syndromes, a volume-to-outcomes relationship has been observed with CS; institutions with higher CS volumes are more likely to use contemporary therapies associated with reduced mortality (4). Most CS patients present to less well-resourced centers that may not provide comprehensive, multi-organ system of care. (5). North American CS registries suggest that standardized protocols and team-based care may be associated with short-term survival (6–8). Whether these benefits extend across regionalized CS networks, predicated on inter-hospital collaboration and expedited transfer to destination centers, is unknown (9–11).After developing a standardized, team-based approach and regional CS network, we sought to compare the clinical characteristics, management strategies, and short-term outcomes of CS patients initially triaged at community spoke hospitals and then transferred to an American Heart Association (AHA) Level 1 CS hub, with those admitted directly to the hub(10).
METHODS
Study Population:
This retrospective analysis included 520 consecutive patients who presented with CS and were treated by our multidisciplinary Shock Team between January 3, 2017 and December 31, 2019. Criteria for diagnosis of CS, either due to acute myocardial infarction (AMI-CS) or acute decompensated HF (HF-CS) are in Figure 1(12–14). Patients were diagnosed with HF-CS if they a de novo or acute on chronic exacerbation of an underlying cardiomyopathy (left ventricular ejection fraction <50%)(15). We excluded patients who did not have CS due to AMI or HF or who were transferred to another hospital within 24 hours of arrival to our facility. Our integrated shock network is comprised of a Level 1 referral center (Inova Fairfax Hospital, Falls Church, VA) and 34 partnering spoke institutions located in a geographic area spanning 5,960 square miles (Figure 2). Institutions were classified based on level of interventional, surgical, MCS capabilities and critical care expertise (9). Inova Fairfax Hospital is a quaternary care center with a multidisciplinary Shock Team comprised of interventional cardiology, cardiothoracic surgery, cardiovascular critical care, advanced heart failure. It is equipped with 12 cardiac catheterization laboratories capable of providing 24–7 primary percutaneous coronary intervention (PCI), intra-aortic balloon pump (IABP) counterpulsation and advanced MCS, including Impella® (Abiomed, Danvers, MA), TandemHeart® (Nova, Pittsburgh, PA) and veno-arterial extracorporeal membrane oxygenation (VA-ECMO). It also provides advanced cardiac replacement therapies, including durable left ventricular assist devices (LVAD) and heart transplantation. In accordance with the 2017 American Heart Association consensus recommendations, all patients at the hub are cared for in a “high intensity” cardiac intensive care unit (CICU), co-managed by cardiologists and intensivists (10). “Spoke” institutions were classified as either being Level 2 centers, predominantly with primary PCI and IABP capabilities, or Level 3, with emergency departments, medical intensive care units, on-site cardiology consultation and Advance Cardiovascular Life Support expertise (9).
Figure 1:

Consort Flow Diagram and Study Design
Figure 2: The Inova Health System Regionalized Care Network for Cardiogenic Shock.
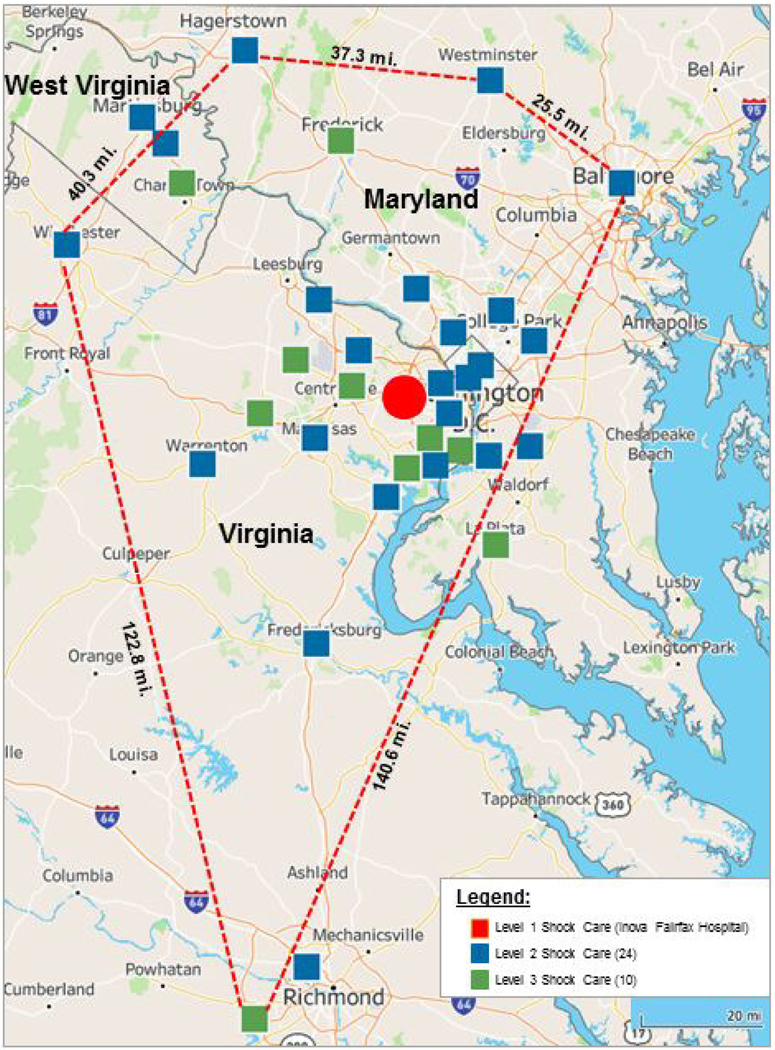
Map depicting regionalized cardiogenic shock network spanning Northern/Central Virginia, Maryland, the District of Columbia and West Virginia.
As the foundation for implementing our shock network, we undertook the following interventions:
A single CS treatment algorithm was shared amongst all institutions (Supplemental Figure 1) (6).
A one-call Shock telephone number was used for expedited multidisciplinary consultation and transfer planning between spoke sites and the Shock Team at the hub.
The Shock Team participated in focused educational outreach with clinical/administrative champions at the spoke centers to review current evidence in CS management, including early recognition, stabilization, and best practices for large bore access (14,16).
All CS cases were reviewed at biweekly quality assurance meetings. Clinicians at the spoke centers were invited to participate and bidirectional feedback was invited to improve process and outcomes.
Patients initially triaged at the hub were identified and managed by the Shock Team in accordance with the institutional CS protocol (6). All patients were recommended to undergo early comprehensive hemodynamic evaluation. Upon transfer to the Level 1 CICU, they underwent serial hemodynamic and metabolic reassessments. In patients with refractory CS, an evaluation for durable LVAD and/or cardiac transplantation was initiated.
Data Collection, Risk Stratification and Outcomes
The study was approved by the Inova Health System’s institutional review board. Data was collected via retrospective chart review of electronic medical. The clinical infrastructure and shock care capabilities of the spoke hospitals were determined and adjudicated independently by two cardiologists. The straight line distance from each spoke to the hub was calculated using the Google Maps application interface (17,18). Duration of time spent at each spoke institution was retrospectively calculated from time of initial triage to time of discharge/transfer to the hub. The MCS platforms initially implanted at each site and the final highest level of temporizing MCS at the hub were captured. All patients were retrospectively assigned three risk stratification scores at time of index diagnosis: (a) the Society for Cardiovascular Angiography and Intervention (SCAI) classification system; (b) the CardShock score; and (c) the Inova Heart and Vascular Institute (IHVI) CS score (6,19,20) by two members of the Inova shock team. The primary endpoint was 30-day mortality post-hospital discharge, with censoring for patients lost to follow-up post-hospital discharge to 30 days. Secondary outcomes included, major bleeding, defined as Bleeding Academic Research Consortium (BARC) types 3a/3b/5 bleeds, stroke, and 30-day major adverse cardiac and cerebrovascular events (MACCE), defined as the composite of stroke, 30-day mortality or 30-day readmissions (21).
Statistical Analysis
Summary statistics are presented as a mean ± standard deviation (SD), median (quartiles [Q1, Q3] with interquartile range), or frequency and percent, where deemed appropriate. Comparisons were made via Student’s t test, Wilcoxon rank sum test, one-way analysis of variance (ANOVA), chi-square, or Fisher’s exact tests, where appropriate. To determine the potential relationship between site of initial triage and the primary and secondary outcomes, we fit multivariable logistic regression models which adjusted for clinical and hemodynamic variables historically associated with outcomes in CS: SCAI CS stage (C vs D-E), age (per 5 years), duration of vasopressors (minutes), female sex, cardiac arrest, baseline log lactate and log cardiac power output (CPO) measurements, MCS use, hemolysis, dialysis, and diabetes (22,23). An internal sensitivity analysis using the Akaike information criterion (AIC), a measure of goodness-of-fit with respect to model complexity, suggested that a log transformation of both baseline CPO and lactate provides a better model fit than raw values. Hence, we included log transformed baseline CPO and lactate in our statistical models. We compared the risk of primary and secondary outcomes in spoke versus hub patients and calculated adjusted odds-ratios (OR) with corresponding 95% confidence intervals for the primary and secondary outcomes. Statistical significance was defined as a p-value less than 0.05, for two-sided tests. All analyses were performed using R (4.0.2) software for statistical computing.
RESULTS
Patient Characteristics
From January 3, 2017 to December 31, 2019, 520 consecutive patients were evaluated and managed by the Shock Team within our network (Table 1). For the overall cohort, mean age was 61.5 years, 71% were male, 44% were diabetic and 63% had chronic kidney disease. Sixty four percent of patients were mechanically ventilated, and 24% had a cardiac arrest. Mean left ventricular ejection fraction and admission lactate were 27.8% and 3.8 mg/dL, respectively. Right heart catheterization was performed in 89% (n=464) of patients during the course of the hospitalization, with 83% of them (n=385) undergoing this within 24 hours of CS identification. Mean baseline cardiac index was 1.9 L/min/m2. All patients were SCAI Shock Stages C, D, or E on presentation to the hub.
Table 1.
Baseline Demographics and Clinical Characteristics of the Hub and Spoke Patients
| Parameter | Hub N=234 | Spoke N=286 | Total N=520 | p-value |
|---|---|---|---|---|
|
| ||||
| Demographics | ||||
| Age, years | 62.0 (12.7) | 61.0 (14.1) | 61.5 (13.5) | 0.38 |
| Gender | 0.10 | |||
| Female | 59 (25.2%) | 92 (32.2%) | 151 (29.0%) | |
| Male | 175 (74.8%) | 194 (67.8%) | 369 (71.0%) | |
| BMI | 28.8 (8.7) | 29.0 (6.2) | 28.9 (7.4) | 0.75 |
| Race | 0.82 | |||
| White | 127 (54.3%) | 148 (51.7%) | 275 (52.9%) | |
| Black | 50 (21.4%) | 64 (22.4%) | 114 (21.9%) | |
| Asian | 34 (14.5%) | 49 (17.1%) | 83 (16.0%) | |
| Other | 23 (9.8%) | 25 (8.7%) | 48 (9.2%) | |
| Ethnicity | 0.48 | |||
| Hispanic/Latino | 18 (7.7%) | 17 (5.9%) | 35 (6.7%) | |
| Other | 216 (92.3%) | 269 (94.1%) | 485 (93.3%) | |
| Clinical Characteristics | ||||
| AMI-CS (%) | 75 (32.1%) | 144 (50.3%) | 219 (42.1%) | < 0.01 |
| HF-CS (%) | 159 (67.9%) | 142 (49.7%) | 301 (57.9%) | < 0.01 |
| Diabetes Mellitus | 95 (40.6%) | 132 (46.2%) | 227 (43.7%) | 0.21 |
| Chronic kidney disease* | 159 (68.2%) | 169 (59.5%) | 328 (63.4%) | 0.04 |
| Cerebrovascular disease | 48 (20.5%) | 35 (12.2%) | 83 (16.0%) | 0.01 |
| Tobacco Use (%) | 123 (52.6%) | 142 (49.7%) | 265 (51.0%) | 0.54 |
| Left Ventricular Ejection Fraction (%) | 27.8 (14.9) | 28.1 (16.1) | 28.0 (15.6) | 0.83 |
| Prior MI/PCI/CABG/Valve | 79 (33.8%) | 76 (26.6%) | 155 (29.8%) | 0.08 |
| Vasopressors at index diagnosis | 154 (65.8%) | 212 (74.1%) | 366 (70.4%) | 0.04 |
| Cardiac Arrest | 47 (20.1%) | 78 (27.3%) | 125 (24.0%) | 0.06 |
| Out of hospital arrest | 16 (6.8%) | 26 (9.1%) | 42 (8.1%) | 0.42 |
| In hospital arrest | 34 (14.5%) | 58 (20.3%) | 92 (17.7%) | 0.11 |
| Shockable Rhythm | 17 (50.0%) | 21 (36.2%) | 38 (41.3%) | 0.27 |
| Non-shockable Rhythm | 17 (50.0%) | 37 (63.8%) | 54 (58.7%) | 0.27 |
| Mechanical ventilation | 149 (63.7%) | 183 (64.0%) | 332 (63.8%) | 1.00 |
| Right Heart Catheterization* | 208 (88.9%) | 256 (89.8%) | 464 (89.4%) | 0.78 |
| Severity of CS and Hemometabolic Assessment | ||||
| 4.5 (1.8) | 4.6 (1.9) | 4.6 (1.9) | 0.68 | |
| CardShock Score (mean) | ||||
| 2.6 (1.9) | 2.5 (1.9) | 2.6 (1.9) | 0.79 | |
| IHVI Shock Score (mean) | ||||
| SCAI Shock Score | 0.15 | |||
| SCAI A | 0 | 0 | 0 | |
| SCAI B | 0 | 0 | 0 | |
| SCAI C | 125 (53.4%) | 129 (45.1%) | 254 (48.8%) | |
| SCAI D | 75 (32.1%) | 112 (39.2%) | 187 (36.0%) | |
| SCAI E | 34 (14.5%) | 45 (15.7%) | 79 (15.2%) | |
| Baseline Lactate, mg/dL | 4.1 (3.9) | 3.6 (3.4) | 3.8 (3.6) | 0.13 |
| Baseline Hemodynamics | ||||
| RA, mmHg | 14.9 (6.5) | 15.1 (7.0) | 15.0 (6.8) | 0.69 |
| PCWP, mmHg | 24.7 (9.5) | 23.5 (8.5) | 24.1 (8.9) | 0.19 |
| SVR, dynes/sec/cm2 | 1700.0 (681.9) | 1603.1 (604.2) | 1649.4 (643.4) | 0.15 |
| PVR, dynes/sec/cm2 | 242.9 (230.1) | 214.3 (154.9) | 227.7 (194.1) | 0.16 |
| CI (L/min/m2) | 1.9 (0.9) | 1.9 (0.6) | 1.9 (0.8) | 0.62 |
| CPO, W | 0.7 (0.4) | 0.7 (0.4) | 0.7 (0.4) | 0.92 |
| PAPi | 2.0 (3.5) | 1.7 (1.4) | 1.9 (2.6) | 0.26 |
| Lactate at 24 hours, mg/dL | 3.9 (4.8) | 3.0(3.6) | 3.4(4.2) | 0.07 |
| Hemodynamics at 24hrs | ||||
| RA, mmHg | 11.2 (5.5) | 11.9 (6.1) | 11.6 (5.9) | 0.23 |
| PCWP, mmHg | 20.3 (7.3) | 20.0 (7.0) | 20.2 (7.1) | 0.72 |
| SVR, dynes/sec/cm2 | 1214.8 (444.6) | 1185.8 (442.1) | 1198.9 (442.8) | 0.55 |
| PVR, dynes/sec/cm2 | 157.7 (102.8) | 146.1 (88.8) | 151.4 (95.4) | 0.28 |
| CI (L/min/m2) | 2.5 (0.9) | 2.4 (0.8) | 2.5 (0.8) | 0.79 |
| CPO, W | 0.8 (0.3) | 0.8 (0.3) | 0.8 (0.3) | 0.91 |
| PAPi | 2.9 (3.1) | 2.7 (3.2) | 2.8 (3.2) | 0.56 |
Abbreviations: AMI-CS =acute myocardial infarction complicated by cardiogenic shock; BMI = body-mass index; CABG = coronary artery bypass graft surgery; CI = cardiac index; CS = cardiogenic shock; HF-CS=heart failure complicated by cardiogenic shock; IHVI = Inova Heart and Vascular Institute; MI = myocardial infarction; PCI = percutaneous coronary intervention; PCWP = pulmonary capillary wedge pressure; PVR = pulmonary vascular resistance; RA = center atriun; SCAI = Society for Cardiovascular Angiography and Interventions; SVR = systemic vascular resistance.
Missing Values were excluded for % calculations
Missing values were excluded for mean and standard deviation calculations
Fifty-five percent (n=286) of patients initially presented to 34 spoke institutions, of which 24 were designated as Level 2 (n=233), and 10 Level 3 centers (n=53). Forty five percent (n=234) presented directly to the hub. The mean straight-line distance from the spoke institutions to the hub was 20.2 ± 44.9 miles. Median duration of time spent at these institutions prior to transfer was 18 hours 6 mins (IQR 5 hours 43 minutes - 63 hours 47 minutes). Among the spoke patients, 83 were transferred by air and 203 by ground to the hub. Patients triaged at a spoke more often presented with AMI-CS (50% vs 32%; p< 0.01). Those presenting to the hub had more HF-CS (68% vs 50%; p<0.01) and chronic kidney disease (68% vs 60%; p=0.04). Spoke patients also had greater index utilization of vasopressors (74% vs. 66%; p=0.04). No differences were noted in index severity of illness and invasive hemodynamic parameters among the two cohorts. Comparisons of baseline demographics, clinical and hemodynamic characteristics among Level 1, 2 and 3 sites are reported (Table 3).
Table 3.
Baseline Demographics and Clinical Characteristics Stratified by Level of Shock Center Instructure
| Parameter | Level 1 N=234 | Level 2 N=233 | Level 3 N=53 | Total N=520 | p-value |
|---|---|---|---|---|---|
|
| |||||
| Demographics | |||||
| Age, years | 62.0 (12.7) | 60.8 (13.8) | 61.7 (15.5) | 61.5 (13.5) | 0.62 |
| Gender | 0.21 | ||||
| Female | 59 (25.2%) | 74 (31.8%) | 18 (34.0%) | 151 (29.0%) | |
| Male | 175 (74.8%) | 159 (68.2%) | 35 (66.0%) | 369 (71.0%) | |
| BMI | 28.8 (8.7) | 29.2 (6.0) | 27.8 (6.8) | 28.9 (7.4) | 0.42 |
| Race | 0.55 | ||||
| White | 127 (54.3%) | 125 (53.6%) | 23 (43.4%) | 275 (52.9%) | |
| Black | 50 (21.4%) | 50 (21.5%) | 14 (26.4%) | 114 (21.9%) | |
| Asian | 34 (14.5%) | 36 (15.5%) | 13 (24.5%) | 83 (16.0%) | |
| Other | 23 (9.8%) | 22 (9.4%) | 3 (5.7%) | 48 (9.2%) | |
| Ethnicity | 0.68 | ||||
| Hispanic/Latino | 18 (7.7%) | 15 (6.4%) | 2 (3.8%) | 35 (6.7%) | |
| Other | 216 (92.3%) | 218 (93.6%) | 51 (96.2%) | 485 (93.3%) | |
| Clinical Characteristics | |||||
| AMI-CS (%) | 75 (32.1%) | 121 (51.9%) | 23 (43.4%) | 219 (42.1%) | < 0.01 |
| HF-CS (%) | 159 (67.9%) | 112 (48.1%) | 30 (56.6%) | 301 (57.9%) | < 0.01 |
| Diabetes Mellitus | 95 (40.6%) | 114 (48.9%) | 18 (34.0%) | 227 (43.7%) | 0.07 |
| Chronic kidney disease* | 159 (68.2%) | 135 (58.4%) | 34 (64.2%) | 328 (63.4%) | 0.09 |
| Cerebrovascular disease | 48 (20.5%) | 29 (12.4%) | 6 (11.3%) | 83 (16.0%) | 0.04 |
| Tobacco Use (%) | 123 (53.0%) | 118 (50.9%) | 24 (46.2%) | 265 (51.4%) | 0.62 |
| Left Ventricular Ejection | |||||
| 27.8 (14.9) | 28.3 (16.4) | 27.1 (14.3) | 28.0 (15.6) | 0.89 | |
| Fraction (%) | |||||
| Prior PCI/CABG/Valve | 79 (33.8%) | 60 (25.8%) | 16 (30.2%) | 155 (29.8%) | 0.17 |
| Vasopressors at index | |||||
| 154 (65.8%) | 172 (73.8%) | 40 (75.5%) | 366 (70.4%) | 0.12 | |
| diagnosis | |||||
| Cardiac Arrest | 47 (20.1%) | 63 (27.0%) | 15 (28.3%) | 125 (24.0%) | 0.15 |
| Out of hospital arrest | 16 (6.8%) | 22 (9.4%) | 4 (7.5%) | 42 (8.1%) | 0.60 |
| In hospital arrest | 34 (14.5%) | 46 (19.7%) | 12 (22.6%) | 92 (17.7%) | 0.17 |
| Shockable Rhythm | 17 (50.0%) | 17 (37.0%) | 4 (33.3%) | 38 (41.3%) | 0.47 |
| Non-shockable Rhythm | 17 (50.0%) | 29 (63.0%) | 8 (66.7%) | 54 (58.7%) | 0.47 |
| Mechanical ventilation | 149 (63.7%) | 151 (64.8%) | 32 (60.4%) | 332 (63.8%) | 0.82 |
| Right Heart Catheterization |
208 (88.9%) | 212 (91.0%) | 44 (84.6%) | 464 (89.4%) | 0.36 |
|
Severity of CS &
Hemometabolic Assessment |
|||||
| CardShock Score (mean) | 4.5 (1.8) | 4.5 (1.9) | 4.9 (1.7) | 4.6 (1.9) | 0.37 |
| IHVI Shock Score (mean) | 2.6 (1.9) | 2.4 (1.8) | 3.0 (1.9) | 2.6 (1.9) | 0.13 |
| SCAI Shock Score | 0.18 | ||||
| SCAI A | 0 | 0 | 0 | 0 | |
| SCAI B | 0 | 0 | 0 | 0 | |
| SCAI C | 125 (53.4%) | 108 (46.4%) | 21 (39.6%) | 254 (48.8%) | |
| SCAI D | 75 (32.1%) | 92 (39.5%) | 20 (37.7%) | 187 (36.0%) | |
| SCAI E | 34 (14.5%) | 33 (14.2%) | 12 (22.6%) | 79 (15.2%) | |
| Baseline Lactate, mg/dL | 4.1 (3.9) | 3.4 (3.3) | 4.4 (3.8) | 3.8 (3.6) | 0.08 |
| Baseline Hemodynamics | |||||
| RA, mmHg | 14.9 (6.5) | 15.2 (6.8) | 14.7 (8.1) | 15.0 (6.8) | 0.83 |
| PCWP, mmHg | 24.7 (9.5) | 23.7 (8.5) | 22.6 (8.5) | 24.1 (8.9) | 0.32 |
| SVR, dynes/sec/cm2 | 1700.0 (681.9) | 1594.8 (596.4) | 1641.4 (646.5) | 1649.4 (643.4) | 0.32 |
| PVR, dynes/sec/cm2 | 242.9 (230.1) | 207.8 (151.4) | 248.7 (170.7) | 227.7 (194.1) | 0.22 |
| CI (L/min/m2) | 1.9 (0.9) | 1.9 (0.6) | 1.9 (0.7) | 1.9 (0.8) | 0.88 |
| CPO, W | 0.7 (0.4) | 0.7 (0.4) | 0.7 (0.3) | 0.7 (0.4) | 0.89 |
| PAPi | 2.0 (3.5) | 1.7 (1.4) | 1.9 (1.4) | 1.9 (2.6) | 0.51 |
| Lactate at 24hrs, mg/dL | 3.9 (4.8) | 2.8 (3.6) | 3.9 (3.6) | 3.4 (4.2) | 0.10 |
| Hemodynamics at 24hrs | |||||
| RA, mmHg | 11.2 (5.5) | 11.9 (6.1) | 11.6 (6.2) | 11.6 (5.9) | 0.47 |
| PCWP, mmHg | 20.3 (7.3) | 20.2 (7.3) | 19.2 (5.5) | 20.2 (7.1) | 0.70 |
| SVR, dynes/sec/cm2 | 1214.8 (444.6) | 1180.3 (445.2) | 1209.6 (433.9) | 1198.9 (442.8) | 0.79 |
| PVR, dynes/sec/cm2 | 157.7 (102.8) | 141.5 (88.3) | 165.5 (89.3) | 151.4 (95.4) | 0.24 |
| CI (L/min/m2) | 2.5 (0.9) | 2.5 (0.8) | 2.4 (1.0) | 2.5 (0.8) | 0.91 |
| CPO, W | 0.8 (0.3) | 0.9 (0.3) | 0.8 (0.4) | 0.8 (0.3) | 0.62 |
| PAPi | 2.9 (3.1) | 2.6 (3.1) | 3.2 (3.7) | 2.8 (3.2) | 0.48 |
Abbreviations: AMI-CS=acute myocardial infarction complicated by cardiogenic shock; CABG = coronary artery bypass graft surgery; CI = cardiac index; CS = cardiogenic shock; HF-CS=heart failure complicated by cardiogenic shock; IHVI = Inova Heart and Vascular Institute; MI= myocardial infarction; PCI = percutaneous coronary intervention; PCWP = pulmonary capillary wedge pressure; PVR = pulmonary vascular resistance; RA = right atrium; SCAI = Society for Cardiovascular Angiography and Interventions; SVR = systemic vascular resistance.
Missing Values were excluded for % calculations
Missing values were excluded for mean and standard deviation calculations
Revascularization, Device Utilization and Short-Term Clinical Outcomes
Among the 144 spoke patients with AMI-CS, 47% (n=68) presented with ST-segment myocardial infarction (STEMI), 50% (n=72) with non-ST-segment myocardial infarction (NSTEMI) (n=72) and 3% (n=4) unstable angina. Forty-two percent (n=61) of the spoke patients with AMI-CS underwent PCI prior to transfer, including 65% (n=44) of those with STEMI. Of the 24 spoke patients with STEMI who did not undergo revascularization prior to transfer, 16 presented to a Level 3 center, and 6 presented to a Level 2 center, where they were noted to have multi-vessel coronary artery disease, of whom five received an IABP and 1 an Impella CP prior to transfer to the hub for CABG evaluation. Two patients also had delayed presentation of STEMI (>12 hours) to a Level 2 site, and they were transferred to the hub for coronary angiography. Among all AMI-CS patients (n=150) in the registry, 82% (n=123) underwent culprit vessel intervention. Fourteen percent (n=30) were referred for CABG and 18% (n=39) were managed medically.
Patients presenting to the hub more often initially received an MCS device compared with those triaged at a spoke (47% vs 29%; p <0.01). MCS included percutaneous ventricular assist devices (pVAD) (44% vs 11%; p<0.01) or veno-arterial extracorporeal membrane oxygenation (VA-ECMO) (13% vs 0%; p<0.01) at hub versus spoke, respectively (Table 2).
Table 2.
Mechanical Circulatory Support Utilization and Clinical Outcomes of the Hub and Spoke Patients
| Parameter | Hub N=234 | Spoke N=286 | Total N=520 | p-value |
|---|---|---|---|---|
|
| ||||
| HF-CS (%) | 159 (67.9%) | 142 (49.7%) | 301 (57.9%) | < 0.01 |
| AMI-CS (%) | 75 (32.1%) | 144 (50.3%) | 219 (42.1%) | < 0.01 |
| AMI-Breakdown | 0.04 | |||
| STEMI | 47 (62.7%) | 77 (53.8%) | 124 (56.9%) | |
| NSTEMI | 26 (34.7%) | 66 (46.2%) | 92 (42.2%) | |
| Unstable Angina | 2 (2.7%) | 0 (0.0%) | 2 (0.9%) | |
| AMI-CS management | ||||
| Percutaneous revascularization | 54 (72.0%) | 96 (66.7%) | 150 (68.5%) | 0.45 |
| Culprit/single vessel | 45 (83.3%) | 78 (81.2%) | 123 (82.0%) | 0.83 |
| Multi-vessel | 9 (16.7%) | 18 (18.8%) | 27 (18.0%) | 0.83 |
| Surgical revascularization | 13 (17.3%) | 17 (11.8%) | 30 (13.7%) | 0.30 |
| Medical Management | 8 (10.7%) | 31 (21.5%) | 39 (17.8%) | 0.06 |
| Initial MCS utilization | 109 (46.6%) | 81 (28.3%) | 190 (36.5%) | < 0.01 |
| IABP | 40 (36.7%) | 71 (87.7%) | 111 (58.4%) | < 0.01 |
| Escalation from IABP | 10 (25.0%) | 30 (42.3%) | 40 (36.0%) | 0.10 |
| pVAD only | 48 (44.0%) | 9 (11.1%) | 57 (30.0%) | < 0.01 |
| Escalation from pVAD | 4 (8.3%) | 1 (11.1%) | 5 (8.8%) | 1.0 |
| VA-ECMO only | 14 (12.8%) | 0 (0.0%) | 14 (7.4%) | < 0.01 |
| pVAD + VA-ECMO | 7 (6.4%) | 1 (1.2%) | 8 (4.2%) | 0.14 |
| Final MCS Utilization at Hub | 109 (46.6%) | 164 (57.3%) | 273 (52.5%) | 0.02 |
| IABP | 30 (27.5%) | 52 (31.7%) | 82 (30.0%) | 0.50 |
| pVAD only | 48 (44.0%) | 64 (39.0%) | 112 (41.0%) | 0.45 |
| VA-ECMO only | 13 (11.9%) | 13 (7.9%) | 26 (9.5%) | 0.30 |
| pVAD + VA-ECMO | 17 (15.6%) | 35 (21.3%) | 52 (19.0%) | 0.27 |
| Centrimag | 1 (0.9%) | 0 (0.0%) | 1 (0.4%) | 0.40 |
| LVAD or Transplant | 0.28 | |||
| LVAD | 16 (6.8%) | 16 (5.6%) | 32 (6.2%) | |
| Transplant | 9 (3.8%) | 5 (1.7%) | 14 (2.7%) | |
| Major Bleeding BARC 3, 5 | 43 (18.4%) | 66 (23.1%) | 109 (21.0%) | 0.20 |
| Vascular Access Complication | 25 (10.7%) | 42 (14.7%) | 67 (12.9%) | 0.19 |
| Cerebrovascular Accident – Stroke | 22 (9.4%) | 20 (7.0%) | 42 (8.1%) | 0.34 |
| Renal replacement therapy | 50 (21.4%) | 55 (19.2%) | 105 (20.2%) | 0.58 |
| Hospital length of stay, days | 17.4 (16.4) | 15.4 (16.4) | 16.3 (16.4) | 0.17 |
| In Hospital Mortality | 68 (29.1%) | 90 (31.5%) | 158 (30.4%) | 0.57 |
| Withdrawal of support‡ | 49 (72.1%) | 57 (63.3%) | 106 (67.1%) | 0.31 |
| Cause of Death | ||||
| Cardiac | 51 (75.0%) | 73 (81.1%) | 124 (78.5%) | 0.43 |
| Non-cardiac | 17 (25.0%) | 17 (18.9%) | 34 (21.5%) | 0.43 |
| Discharge Destination | 0.59 | |||
| Home | 109 (46.6%) | 119 (41.8%) | 228 (43.9%) | |
| Hospice | 15 (6.4%) | 14 (4.9%) | 29 (5.6%) | |
| Acute Rehab Facility | 22 (9.4%) | 35 (12.2%) | 57 (11.0%) | |
| Skilled Nursing Facility | 14 (6.0%) | 21 (7.4%) | 35 (6.7%) | |
| Other Medical Facility | 6 (2.6%) | 7 (2.4%) | 13 (2.5%) | |
| Expired | 68 (29.1%) | 90 (31.5%) | 158 (30.4%) | |
| 30-Day Mortality*** | 87 (37.8%) | 100 (35.5%) | 187 (36.5%) | 0.58 |
| Readmission within 30-days** | 40 (24.0%) | 42 (21.4%) | 82 (22.6%) | 0.62 |
| Cardiac related causes | 19 (47.5%) | 15 (35.7%) | 34 (41.5%) | 0.37 |
| Non-cardiac related causes | 21 (52.5%) | 27 (64.3%) | 48 (58.5%) | 0.37 |
| 30-Day MACCE**** | 130 (55.6%) | 148 (51.7%) | 278 (53.5%) | 0.43 |
Abbreviations: BARC = Bleeding Academic Research Consortium; IABP = Intra-aortic balloon pump; LVAD = left ventricular assist device; MACCE = major adverse cardiac and cerebrovascular event; pVAD= percutaneous ventricular assist device; VA-ECMO = veno-arterial extracorporeal membrane oxygenation; VARC = Vascular Academic Research Consortium
Patients expired before discharge were excluded to calculate the %
Missing values were excluded for % calculations
MACCE Composite:
Spoke patients more often initially received IABP (88% vs 37%; p<0.01). One of the Level 2 spoke patients received VA-ECMO and pVAD for fulminant myocarditis and was emergently transferred to the hub and underwent heart transplantation. Thirty six percent (n=40) of all patients initially supported with IABPs required escalation to an alternative MCS device. No differences were noted between the hub and spoke cohorts with regards to 30-day mortality (38% vs 36%; p=0.58); major bleeding (18% vs 23%; p=0.20); stroke (9% vs 7%; p=0.34) or MACCE (56% vs 52%; p=0.43). Comparisons of MCS utilization and clinical outcomes among Level 1, 2 and 3 institutions are reported (Table 4). The breakdown in initial and final temporizing MCS utilization based on shock phenotype and index CS center presentation is further described ( Supplemental Figure 2).
Table 4.
Clinical Management, Mechanical Circulatory Support Utilization and Clinical Outcomes Stratified by Level of Shock Center Infrastructure
| Parameter | Level 1 N=234 | Level 2 N=233 | Level 3 N=53 | Total N=520 | p-value |
|---|---|---|---|---|---|
|
| |||||
| HF-CS (%) | 159 (67.9%) | 112 (48.1%) | 30 (56.6%) | 301 (57.9%) | < 0.01 |
| AMI-CS (%) | 75 (32.1%) | 121 (51.9%) | 23 (43.4%) | 219 (42.1%) | < 0.01 |
| AMI-Breakdown | 0.08 | ||||
| STEMI | 47 (62.7%) | 62 (51.2%) | 15 (68.2%) | 124 (56.9%) | |
| NSTEMI | 26 (34.7%) | 59 (48.8%) | 7 (31.8%) | 92 (42.2%) | |
| Unstable Angina | 2 (2.7%) | 0 (0.0%) | 0 (0.0%) | 2 (0.9%) | |
| AMI-CS management | |||||
| Percutaneous revascularization | 54 (72.0%) | 85 (70.2%) | 11 (47.8%) | 150 (68.5%) | 0.08 |
| Culprit/single vessel | 45 (83.3%) | 71 (83.5%) | 7 (63.6%) | 123 (82.0%) | 0.29 |
| Multi-vessel | 9 (16.7%) | 14 (16.5%) | 4 (36.4%) | 27 (18.0%) | 0.29 |
| Surgical revascularization | 13 (17.3%) | 15 (12.4%) | 2 (8.7%) | 30 (13.7%) | 0.53 |
| Medical Management | 8 (10.7%) | 21 (17.4%) | 10 (43.5%) | 39 (17.8%) | < 0.01 |
| Initial MCS utilization | 109 (46.6%) | 81 (34.8%) | 0 (0.0%) | 190 (36.5%) | < 0.01 |
| IABP | 40 (36.7%) | 71 (87.7%) | 0 | 111 (58.4%) | < 0.01 |
| Escalation from IABP (at the Hub) | 10 (25.0%) | 30 (42.3%) | 0 | 40 (36.0%) | 0.10 |
| pVAD only | 48 (44.0%) | 9 (11.1%) | 0 | 57 (30.0%) | < 0.01 |
| Escalation from pVAD (at the Hub) | 4 (8.3%) | 1 (11.1%) | 0 | 5 (8.8%) | 1.0 |
| VA-ECMO only | 14 (12.8%) | 0 (0.0%) | 0 | 14 (7.4%) | < 0.01 |
| pVAD + VA-ECMO | 7 (6.4%) | 1 (1.2%) | 0 | 8 (4.2%) | 0.14 |
| Final MCS Utilization at the Hub | 109 (46.6%) | 141 (60.5%) | 23 (43.4%) | 273 (52.5%) | < 0.01 |
| IABP | 30 (27.5%) | 48 (34.0%) | 4 (17.4%) | 82 (30.0%) | 0.22 |
| pVAD only | 48 (44.0%) | 56 (39.7%) | 8 (34.8%) | 112 (41.0%) | 0.67 |
| VA-ECMO only | 13 (11.9%) | 11 (7.8%) | 2 (8.7%) | 26 (9.5%) | 0.53 |
| pVAD + VA-ECMO | 17 (15.6%) | 26 (18.4%) | 9 (39.1%) | 52 (19.0%) | 0.05 |
| Centrimag | 1 (0.9%) | 0 (0.0%) | 0 (0.0%) | 1 (0.4%) | 0.49 |
| LVAD or Transplant | 0.37 | ||||
| LVAD | 16 (6.8%) | 14 (6.0%) | 2 (3.8%) | 32 (6.2%) | |
| Transplant | 9 (3.8%) | 3 (1.3%) | 2 (3.8%) | 14 (2.7%) | |
| Major Bleeding, BARC 3, 5 | 43 (18.4%) | 50 (21.5%) | 16 (30.2%) | 109 (21.0%) | 0.14 |
| Vascular Access Complication | 25 (10.7%) | 32 (13.7%) | 10 (18.9%) | 67 (12.9%) | 0.22 |
| Cerebrovascular Accident – Stroke | 22 (9.4%) | 13 (5.6%) | 7 (13.2%) | 42 (8.1%) | 0.09 |
| Renal replacement therapy | 50 (21.4%) | 46 (19.7%) | 9 (17.0%) | 105 (20.2%) | 0.78 |
| Hospital length of stay, days | 17.4 (16.4) | 15.3 (16.4) | 16.1 (16.5) | 16.3 (16.4) | 0.37 |
| Discharge Destination | 0.67 | ||||
| Home | 109 (46.6%) | 99 (42.5%) | 20 (37.7%) | 228 (43.9%) | |
| Hospice | 15 (6.4%) | 11 (4.7%) | 3 (5.7%) | 29 (5.6%) | |
| Acute Rehab Facility | 22 (9.4%) | 29 (12.4%) | 6 (11.3%) | 57 (11.0%) | |
| Skilled Nursing Facility | 14 (6.0%) | 19 (8.2%) | 2 (3.8%) | 35 (6.7%) | |
| Other Medical Facility | 6 (2.6%) | 7 (3.0%) | 0 (0.0%) | 13 (2.5%) | |
| Expired | 68 (29.1%) | 68 (29.2%) | 22 (41.5%) | 158 (30.4%) | |
| In Hospital Mortality | 68 (29.1%) | 68 (29.2%) | 22 (41.5%) | 158 (30.4%) | 0.19 |
| Withdrawal of support‡ | 49 (72.1%) | 43 (63.2%) | 14 (63.6%) | 106 (67.1%) | 0.55 |
| Cause of Death | |||||
| Cardiac | 51 (75.0%) | 55 (80.9%) | 18 (81.8%) | 124 (78.5%) | 0.70 |
| Non-cardiac | 17 (25.0%) | 13 (19.1%) | 4 (18.2%) | 34 (21.5%) | 0.70 |
| 30-Day Mortality*** | 87 (37.8%) | 76 (33.2%) | 24 (45.3%) | 187 (36.5%) | 0.22 |
| Readmission within 30-days** | 40 (24.0%) | 37 (22.4%) | 5 (16.1%) | 82 (22.6%) | 0.70 |
| Cardiac related causes‡ | 19 (47.5%) | 13 (35.1%) | 2 (40.0%) | 34 (41.5%) | 0.53 |
| Non-cardiac related causes | 21 (52.5%) | 24 (64.9%) | 3 (60.0%) | 48 (58.5%) | 0.53 |
| 30-Day MACCE**** | 130 (55.6%) | 117 (50.2%) | 31 (58.5%) | 278 (53.5%) | 0.38 |
Abbreviations: BARC = Bleeding Academic Research Consortium; IABP = Intra-aortic balloon pump; LVAD = left ventricular assist device; MACCE = major adverse cardiac and cerebrovascular event; pVAD= percutaneous ventricular assist device; VA-ECMO = veno-arterial extracorporeal membrane oxygenation.
Patients expired before discharge were excluded to calculate the %
Missing values were excluded for % calculations Cardiac Cause of Death Cardiac related causes of readmissions: Acute myocardial infarction, Acute decompensated Heart Failure, Cardiac Arrest, Cerebrovascular Accident
MACCE Composite
Multivariate Regression Analysis
Multivariable logistic regression revealed the following independent predictors of 30-day mortality: (1) SCAI Shock Stages D/E ; (2) cardiac arrest; (3) dialysis; (4) diabetes; (5) baseline log lactate; (6) age (per 5 years); and (7) duration of vasopressors (per incremental increase in minutes). Initial triage at a spoke center was not associated with increased adjusted risk for 30-day mortality (aOR 0.87 95% CI: 0.49–1.55; p=0.64) (Supplemental Figure 3). This finding was consistent across the entire study period, as an exploratory analysis did not detect a statistically significant relationship between year of admission and 30-day mortality for either the spoke (aOR: 0.77; 95% CI: 0.45–1.34; p=0.35) or hub patients (aOR: 1.01; 95% CI: 0.56–1.85; p=0.96). Initial presentation to a spoke center was also not associated with increased adjusted risk for: 1) In-hospital mortality; 2) Major bleeding; 3) Stroke or 4) 30-day MACCE (Central Illustration).
Central Illustration: Standardized Systems of Care Network for Cardiogenic Shock.
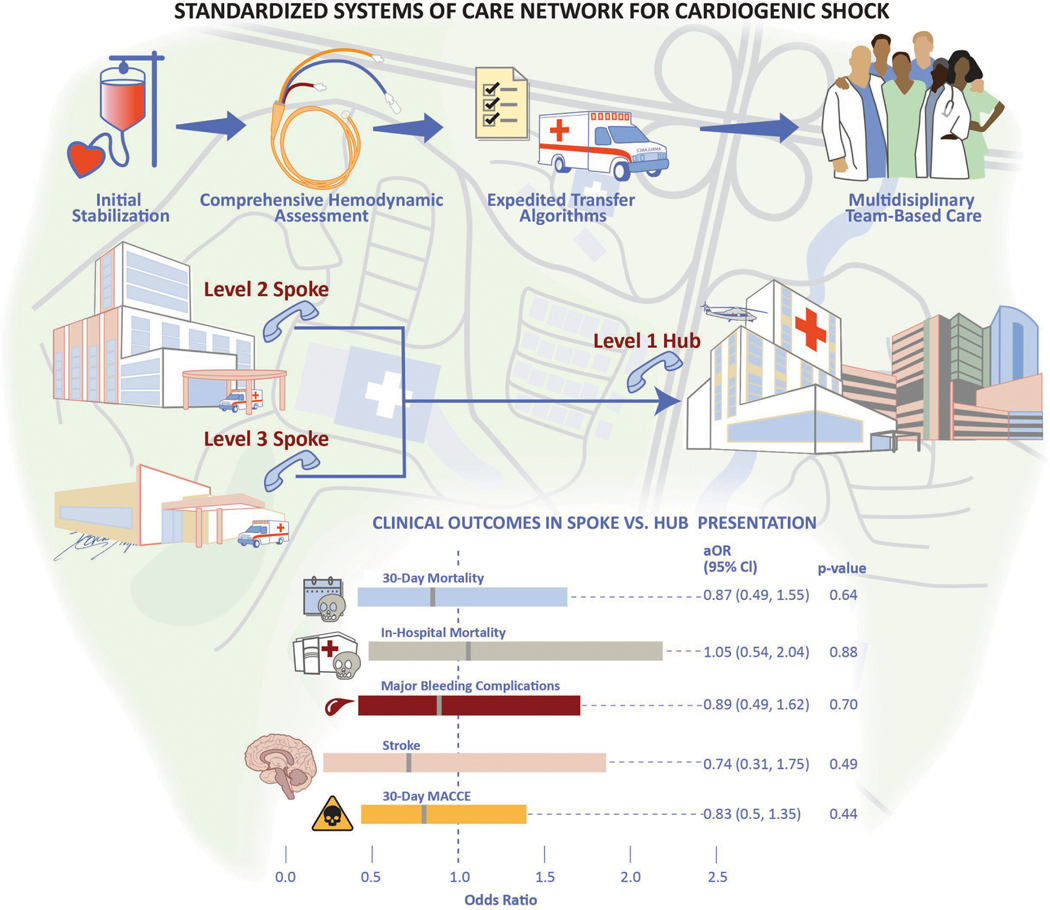
Schematic representation of the Inova Health System’s regionalized cardiogenic shock network. Key components include early recognition and stabilization, comprehensive shock phenotyping, and coordinated transfer to the Level 1 center. Following multivariate regression analysis, no differences in 30-day mortality and associated short-term outcomes were noted based on initial site of clinical presentation and management.
DISCUSSION
This is the first study to compare clinical characteristics, treatment and outcomes of spoke vs. hub patients within a regionalized CS network. Our main findings are: (1) Patients with CS more often initially presented to a spoke than a hub center; (2) Patients initially triaged at a spoke more often presented with AMI-CS and were more likely to be treated initially with vasopressors and an IABP; (3) Patients admitted directly to the hub more often had HF-CS and were more likely to receive axial or centrifugal flow MCS; and (4) Implementation of a comprehensive regionalized system of CS care that employs one-call access, uniform treatment protocols, early multidisciplinary communication and expedited transfer protocols was associated with similar short-term outcomes for all patients, independent of initial site of presentation.
The 2017 American Heart Association scientific statement endorsed a systems-of-care approach for CS through the integration of standardized algorithms into referral networks to centralize care at high volume Level 1 centers (10). However, despite these recommendations and other studies demonstrating the benefits of team-based care, little is known about the relative outcomes of CS patients who initially present to a spoke institution (6,24,25). There is also a lack of data regarding the impact of disseminating best practices and treatment algorithms across regionalized networks to decrease treatment heterogeneity. Given the high acuity and resource intensive nature of CS, there are legitimate practical concerns regarding the risks associated with inter-hospital transfer (26). Similar to integrated shock networks developed in New York City and Paris to direct refractory CS patients to destination centers with dedicated expertise, our study demonstrates the feasibility of applying a similar approach within a real-world, “all-comer” patient population spanning the entire CS severity spectrum (27,28).
To the best of our knowledge, our study is among the first to comprehensively evaluate CS spoke vs. hub outcomes within a care network that uses standardized protocols and early transfer to the hub. We observed similar short-term clinical outcomes for patients initially presenting to spoke hospitals versus the hub across a large, diverse geographic region without the use of mobile CS teams (9). Despite advances in early reperfusion and MCS, there remain significant regional variations in the treatment and outcomes of CS (29). A contemporary analysis of 362,065 hospital admissions with diagnosis of AMI-CS from the National Inpatient Sample (2000–2014) reported an adjusted 13% decrease in in-hospital mortality for patients managed at urban teaching institutions compared with those treated at rural hospitals (3). The former were more likely to receive early angiography, PCI and MCS (3). Our spoke cohort was more likely to be initially supported with vasopressors and IABPs, whereas those admitted directly to the hub center were more likely to be cannulated upfront with pVADs and/or VA-ECMO. In the end, 36% of all patients initially supported with IABP required escalation to an advanced MCS platform following transfer. Potential explanations for these observations include: (1) the suboptimal hemodynamic support provided by IABP; (2) greater access to the full complement of MCS platforms and supportive personnel at the hub; and (3) the higher prevalence of HF-CS with associated hemodynamic derangements seen in the hub cohort (2,30,31). Despite these differences, with expedited transfer algorithms and standardized multidisciplinary management, no differences were noted in 30-day mortality and associated short-term outcome in our CS network. We also did not appreciate a relationship between the distance from spoke to hub and mortality (aOR per mile incremental distance 0.98; 95% CI: 0.89–1.02; p=0.35). These findings are consistent with previous observations that suggest that early CS diagnosis and timely transfer to a specialized CS center may mitigate potentially negative impacts arising from initial presentation at a community hospital (32). There was a trend towards greater use of pVAD + ECMO, higher 30-day mortality and higher incidence of major bleeding and stroke in patients transferred from the Level 3 versus Level 2 centers. Although we attribute the uniform outcomes observed across our network to optimal multidisciplinary care coordination and early transfer to the hub, given the single center nature of this study, these results warrant validation in other large multicenter registries to identify best practices and key interventions most often associated with improved outcomes.
There exists a clinical precedent for implementing regionalized networks to advance short-term outcomes with other time-sensitive syndromes (11,33). A contemporary analysis of 10,730 hospital admissions for acute STEMI to 132 hospitals in 12 metropolitan regions from the Mission: Lifeline Accelerator-2 Project from 2015–2017 demonstrated marked improvements in quality metrics and in-hospital deaths following interventions to promote uniform adoption of best practices (11). Through collaborative engagement with service line leaders, substantial reductions in first medical contact-to-device time, in-hospital mortality and post-infarct heart failure were reported (11). The hemo-metabolic complexities associated with CS lend credence to efforts aimed at minimizing practice pattern variations and promoting inter-hospital collaborations. During the implementation phase of our CS network, we identified clinical and administrative champions at each spoke institution and engaged in regular meetings, educational efforts, encouraged two-way communication, and disseminated best practices. We believe that this level of collaboration may be considered an important component of larger healthcare delivery models for CS (34).
Our study affirms several clinical variables previously validated and associated with increased mortality. Several of these are already used in daily clinical practice to guide decision making in patients with circulatory collapse (35). In our multivariate analysis, baseline lactic acid and CPO determinations were associated with 30-day mortality. The predictive value of lactic acid has long been established in the shock literature, and has been incorporated into contemporary risk stratification schemata (20,22). Post-hoc analyses of the SHOCK trial and recent data from the National Cardiogenic Shock Initiative have both identified CPO as a strong independent predictor of CS in-hospitality mortality (24,36). Our findings highlight the importance of timely right heart catheterization and team-based care to inform clinical decision making (25,37). This is particularly important in the context of regionalized systems of care networks, where early prognostication coupled with resource availability may inform patient selection for advanced therapies .
Study Limitations
As a retrospective registry analysis, our study is prone to unmeasured confounding variables and selection bias, an inherent limitation of observational studies. We cannot account for outcomes among spoke patients who were not transferred to the hub or died prior to engagement with the Shock Team. Our “all-comer” consecutive CS sample, included patients with HF-CS, a heterogeneous group of varying disease states for which there are currently few evidence-based therapies. However, given recent data demonstrating that HF is the predominant CS phenotype in the modern era, we believe that our study population is representative of contemporary, “real-world” clinical practice (2,25). Our registry also included patients who were ineligible for advanced therapies due to pre-existing medical comorbidities, limited life expectancy and/or patient preference. Further research is needed to better understand the role that palliative care may play in guiding clinical decisions best aligned with the health values of patients and/or their surrogates(38).
CONCLUSIONS
In this retrospective review of a regionalized CS network, patients with CS more often initially presented to a spoke versus hub hospital, and a higher percentage of AMI-CS patients were transferred to a hub facility for additional CS care. Despite differences in clinical presentation and initial treatment strategy, the implementation of a comprehensive CS network across our multi-hospital system was associated with comparable 30-day mortality and associated short-term outcomes for patients presenting initially to a spoke vs. hub center. These findings highlight the potential merits of ongoing hub/spoke collaborations, standardized treatment protocols, multidisciplinary input, and early transfer algorithms. They also warrant further research using large multicenter registries and pragmatic clinical trial designs to identify the interventions within regional care networks that may best improve outcomes in CS.
Supplementary Material
Figure 3: Short-Term Clinical Outcomes.

Bar graph depiction of 30-day mortality and associated short-term outcomes based on initial site of clinical presentation.
PERSPECTIVES.
Competency in Systems Based Practice:
A regionalized system of care for CS management across a multi-hospital network predicated on team-based management and expedited transfer protocols is feasible and may afford similar short-term benefits to patients presenting to either spoke or hub shock care centers.
Translational Outlook:
Development of dedicated CS care networks supported by multidisciplinary shock teams may inform the development of larger multicenter registries and pragmatic clinical trial designs aimed at better understanding optimal care delivery models for patients afflicted with this highly lethal syndrome.
Acknowledgements:
The authors would like to acknowledge the Dudley Family for their continued contributions and support of the Inova Dudley Family Center for Cardiovascular Innovation. The authors would also like to acknowledge the Inova Heart and Vascular Institute cardiovascular disease fellows for their clinical and research contributions to the Inova Cardiogenic Shock Program. Graphic design support was provided by Ms. Devon Stuart under the guidance and direction of the authors.
Financial Disclosures:
Dr. Tehrani serves on the advisory board for Abbott and he has received research grants from Boston Scientific and Inari Medical. He also served as a consultant for Boston Scientific. Dr. Truesdell serves as a consultant for Abiomed. Dr. Ibrahim has received honoraria from Medtronic. Dr. Shah is supported by an NIH K23 Career Development Award 1K23HL143179. Dr. Shah serves as a consultant for Merck, Novartis, and Procyrion and the institution receives grant support from Abbott, Roche, Merck and Bayer for unrelated research. Dr. Batchelor serves as consultant for Boston Scientific, Abbott, Medtronic and V-Wave.
Abbreviations:
- AMI
Acute myocardial infarction
- CICU
Cardiac intensive care unit
- CS
Cardiogenic Shock
- IABP
Intra-aortic balloon pump
- LVAD
Left ventricular assist device
- MACCE
Major adverse cardiac and cerebrovascular events
- MCS
Mechanical circulatory support
- pVAD
Percutaneous ventricular assist device
- SCAI
Society for Cardiovascular Angiography and Interventions
- VA-ECMO
Veno-arterial extracorporeal membrane oxygenation
Footnotes
All other authors report no disclosures or conflicts of interest relevant to this manuscript.
REFERENCES
- 1.Schrage B, Becher PM, Goßling A et al. Temporal trends in incidence, causes, use of mechanical circulatory support and mortality in cardiogenic shock. ESC Heart Failure 2021;8:1295–1303. [DOI] [PMC free article] [PubMed] [Google Scholar]
- 2.Berg DD, Bohula EA, van Diepen S et al. Epidemiology of Shock in Contemporary Cardiac Intensive Care Units. Circ Cardiovasc Qual Outcomes 2019;12:e005618. [DOI] [PMC free article] [PubMed] [Google Scholar]
- 3.Vallabhajosyula S, Dunlay SM, Barsness GW, Rihal CS, Holmes DR Jr., Prasad A. Hospital-Level Disparities in the Outcomes of Acute Myocardial Infarction With Cardiogenic Shock. Am J Cardiol 2019;124:491–498. [DOI] [PubMed] [Google Scholar]
- 4.Shaefi S, O’Gara B, Kociol RD et al. Effect of cardiogenic shock hospital volume on mortality in patients with cardiogenic shock. J Am Heart Assoc 2015;4:e001462. [DOI] [PMC free article] [PubMed] [Google Scholar]
- 5.Wayangankar SA, Bangalore S, McCoy LA et al. Temporal Trends and Outcomes of Patients Undergoing Percutaneous Coronary Interventions for Cardiogenic Shock in the Setting of Acute Myocardial Infarction: A Report From the CathPCI Registry. JACC Cardiovasc Interv 2016;9:341–351. [DOI] [PubMed] [Google Scholar]
- 6.Tehrani BN, Truesdell AG, Sherwood MW et al. Standardized Team-Based Care for Cardiogenic Shock. J Am Coll Cardiol 2019;73:1659–1669. [DOI] [PubMed] [Google Scholar]
- 7.Moghaddam N, van Diepen S, So D, Lawler PR, Fordyce CB. Cardiogenic shock teams and centres: a contemporary review of multidisciplinary care for cardiogenic shock. ESC Heart Failure 2021;8:988–998. [DOI] [PMC free article] [PubMed] [Google Scholar]
- 8.Papolos AI, Kenigsberg BB, Berg DD et al. Management and Outcomes of Cardiogenic Shock in Cardiac ICUs With Versus Without Shock Teams. J Am Coll Cardiol 2021;78:1309–1317. [DOI] [PubMed] [Google Scholar]
- 9.Rab T, Ratanapo S, Kern KB et al. Cardiac Shock Care Centers: JACC Review Topic of the Week. J Am Coll Cardiol 2018;72:1972–1980. [DOI] [PubMed] [Google Scholar]
- 10.van Diepen S, Katz JN, Albert NM et al. Contemporary Management of Cardiogenic Shock: A Scientific Statement From the American Heart Association. Circulation 2017;136:e232–e268. [DOI] [PubMed] [Google Scholar]
- 11.Jollis JG, Al-Khalidi HR, Roettig ML et al. Impact of Regionalization of ST-Segment-Elevation Myocardial Infarction Care on Treatment Times and Outcomes for Emergency Medical Services-Transported Patients Presenting to Hospitals With Percutaneous Coronary Intervention: Mission: Lifeline Accelerator-2. Circulation 2018;137:376–387. [DOI] [PubMed] [Google Scholar]
- 12.Hochman JS, Sleeper LA, Webb JG et al. Early revascularization in acute myocardial infarction complicated by cardiogenic shock. SHOCK Investigators. Should We Emergently Revascularize Occluded Coronaries for Cardiogenic Shock. N Engl J Med 1999;341:625–34. [DOI] [PubMed] [Google Scholar]
- 13.Thygesen K, Alpert JS, Jaffe AS et al. Fourth Universal Definition of Myocardial Infarction (2018). Circulation 2018;138:e618–e651. [DOI] [PubMed] [Google Scholar]
- 14.Sv Diepen, Katz JN Albert NM et al. Contemporary Management of Cardiogenic Shock: A Scientific Statement From the American Heart Association. Circulation 2017;136:e232–e268. [DOI] [PubMed] [Google Scholar]
- 15.Abraham J, Blumer V, Burkhoff DAN et al. Heart Failure-Related Cardiogenic Shock: Pathophysiology, Evaluation and Management Considerations: Review of Heart Failure-Related Cardiogenic Shock. Journal of Cardiac Failure 2021;27:1126–1140. [DOI] [PubMed] [Google Scholar]
- 16.Sandoval Y, Burke MN, Lobo AS et al. Contemporary Arterial Access in the Cardiac Catheterization Laboratory. JACC Cardiovasc Interv 2017;10:2233–2241. [DOI] [PubMed] [Google Scholar]
- 17.Boscoe FP, Henry KA, Zdeb MS. A Nationwide Comparison of Driving Distance Versus Straight-Line Distance to Hospitals. Prof Geogr 2012;64. [DOI] [PMC free article] [PubMed] [Google Scholar]
- 18.https://www.google.com/maps/place/Inova+Heart+and+Vascular+Institute/@38.8576176,−77.23165,17z/data=!3m1!4b1!4m5!3m4!1s0×89b64c8531d317af:0xc1e3ee0318bbd746!8m2!3d38.8576134!4d-77.2294613. Last Accessed : September, 2021. [Google Scholar]
- 19.Baran DA, Grines CL, Bailey S et al. SCAI clinical expert consensus statement on the classification of cardiogenic shock. Catheterization and Cardiovascular Interventions 2019;94:29–37. [DOI] [PubMed] [Google Scholar]
- 20.Harjola VP, Lassus J, Sionis A et al. Clinical picture and risk prediction of short-term mortality in cardiogenic shock. Eur J Heart Fail 2015;17:501–9. [DOI] [PubMed] [Google Scholar]
- 21.Mehran R, Rao SV, Bhatt DL et al. Standardized bleeding definitions for cardiovascular clinical trials: a consensus report from the Bleeding Academic Research Consortium. Circulation 2011;123:2736–47. [DOI] [PubMed] [Google Scholar]
- 22.Pöss J, Köster J, Fuernau G et al. Risk Stratification for Patients in Cardiogenic Shock After Acute Myocardial Infarction. J Am Coll Cardiol 2017;69:1913–1920. [DOI] [PubMed] [Google Scholar]
- 23.Baran DA, Long A, Badiye AP, Stelling K. Prospective validation of the SCAI shock classification: Single center analysis. Catheterization and Cardiovascular Interventions 2020;96:1339–1347. [DOI] [PMC free article] [PubMed] [Google Scholar]
- 24.Basir MB, Kapur NK, Patel K et al. Improved Outcomes Associated with the use of Shock Protocols: Updates from the National Cardiogenic Shock Initiative . Catheter Cardiovasc Interv 2019;93:1173–1183. [DOI] [PubMed] [Google Scholar]
- 25.Garan AR, Kanwar M, Thayer KL et al. Complete Hemodynamic Profiling With Pulmonary Artery Catheters in Cardiogenic Shock Is Associated With Lower In-Hospital Mortality . JACC Heart Fail 2020;8:903–913. [DOI] [PubMed] [Google Scholar]
- 26.Rush B, Tyler PD, Stone DJ, Geisler BP, Walley KR, Celi LA. Outcomes of Ventilated Patients With Sepsis Who Undergo Interhospital Transfer: A Nationwide Linked Analysis. Crit Care Med 2018;46:e81–e86. [DOI] [PMC free article] [PubMed] [Google Scholar]
- 27.Helman DN, Morales DLS, Edwards NM et al. Left ventricular assist device bridge-to-transplant network improves survival after failed cardiotomy. The Annals of Thoracic Surgery 1999;68:1187–1194. [DOI] [PubMed] [Google Scholar]
- 28.Beurtheret S, Mordant P, Paoletti X et al. Emergency circulatory support in refractory cardiogenic shock patients in remote institutions: a pilot study (the cardiac-RESCUE program). Eur Heart J 2013;34:112–20. [DOI] [PubMed] [Google Scholar]
- 29.Vallabhajosyula S, Patlolla SH, Dunlay SM et al. Regional Variation in the Management and Outcomes of Acute Myocardial Infarction With Cardiogenic Shock in the United States. Circulation: Heart Failure 2020;13:e006661. [DOI] [PMC free article] [PubMed] [Google Scholar]
- 30.Thiele H, Zeymer U, Thelemann N et al. Intraaortic Balloon Pump in Cardiogenic Shock Complicating Acute Myocardial Infarction: Long-Term 6-Year Outcome of the Randomized IABP-SHOCK II Trial. Circulation 2018. [DOI] [PubMed] [Google Scholar]
- 31.O’Neill BP, Cohen MG, Basir MB et al. Outcomes Among Patients Transferred for Revascularization With Impella for Acute Myocardial Infarction With Cardiogenic Shock from the cVAD Registry. Am J Cardiol 2019;123:1214–1219. [DOI] [PubMed] [Google Scholar]
- 32.Lu DY, Adelsheimer A, Chan K et al. Impact of hospital transfer to hubs on outcomes of cardiogenic shock in the real world. Eur J Heart Fail 2021. [DOI] [PubMed] [Google Scholar]
- 33.McCarthy JJ, Carr B, Sasson C et al. Out-of-Hospital Cardiac Arrest Resuscitation Systems of Care: A Scientific Statement From the American Heart Association. Circulation 2018;137:e645–e660. [DOI] [PubMed] [Google Scholar]
- 34.Samsky M, Krucoff M, Althouse AD et al. Clinical and regulatory landscape for cardiogenic shock: A report from the Cardiac Safety Research Consortium ThinkTank on cardiogenic shock. American Heart Journal 2020;219:1–8. [DOI] [PMC free article] [PubMed] [Google Scholar]
- 35.Harhash AA, May TL, Hsu CH et al. Risk Stratification Among Survivors of Cardiac Arrest Considered for Coronary Angiography. J Am Coll Cardiol 2021;77:360–371. [DOI] [PubMed] [Google Scholar]
- 36.Fincke R, Hochman JS, Lowe AM et al. Cardiac power is the strongest hemodynamic correlate of mortality in cardiogenic shock: A report from the SHOCK trial registry. Journal of the American College of Cardiology 2004;44:340–348. [DOI] [PubMed] [Google Scholar]
- 37.Ranka S, Mastoris I, Kapur NK et al. Right Heart Catheterization in Cardiogenic Shock Is Associated With Improved Outcomes: Insights From the Nationwide Readmissions Database. Journal of the American Heart Association;0:e019843. [DOI] [PMC free article] [PubMed] [Google Scholar]
- 38.. <au>Rogers JG</au>, <au>Patel CB</au>, <au>Mentz RJ</au> et al. Palliative Care in Heart Failure: The PAL-HF Randomized, Controlled Clinical Trial. J Am Coll Cardiol 2017;70:331–341. [DOI] [PMC free article] [PubMed] [Google Scholar]
Associated Data
This section collects any data citations, data availability statements, or supplementary materials included in this article.