

Abstract
Purpose:
To evaluate how changes in visual acuity are associated with changes in quality of life (QoL) among patients with non-infectious uveitis taking antimetabolites.
Methods:
This secondary analysis of the multicenter First-line Antimetabolites as Steroid-sparing Treatment (FAST) Uveitis Trial involves 216 participants randomized to methotrexate or mycophenolate mofetil. Vision-related (NEI-VFQ and IND-VFQ) and health-related (PCS and MCS SF-36v2) QoL and visual acuity were measured at baseline and 6-month primary endpoint.
Results:
Visual acuity was significantly associated and correlated with all QoL measures (Spearman correlation coefficients=0.5, 0.5, 0.3, and 0.4 for NEI-VFQ, IND-VFQ, SF-36v2 MCS and PCS, respectively). All observed changes in QoL met or exceeded the minimal clinically important difference definition on each scale. Treatment group was not significantly associated with any QoL measure.
Conclusion:
By adding insight beyond visual acuity, QoL provides a more comprehensive picture of the patient experience during uveitis treatment.
Keywords: quality of life, vision related quality of life, health related quality of life, visual acuity, First-line Antimetabolites as Steroid-sparing Treatment (FAST) Uveitis Trial
Introduction
Uveitis is characterized by intraocular inflammation and is a major cause of vision loss and morbidity globally. The disease often occurs at a younger age than conditions such as cataract, glaucoma, and macular degeneration, and about 70 to 90 percent of uveitis cases affect the 20- to 60-year-old working group.1 Because of its early onset and effect on working age people, uveitis may be more costly to society than other causes of vision loss.2 Treatment outcomes for uveitis have primarily focused on changes in visual acuity and control of inflammation. However, metrics evaluating quality of life (QoL) for patients with eye disorders have more recently garnered greater attention.3 Health-related quality of life (HR-QoL), which measures perceived physical and mental health over time, adds a dimension of patient experience to traditional benchmarks. Vision-related quality of life (VR-QoL) measures provide additional insight through vision-targeted questions. Visual acuity alone may not fully capture quality of vision, as many patients with eye diseases can experience varying levels of decreased visual field, contrast sensitivity, and other symptoms.4 VR-QoL assesses measures beyond visual acuity, including the ability to conduct daily activities such as driving and reading that rely on peripheral vision, contrast, and color vision.3,5 Visual acuity and VR-QoL have been shown to be strongly related in patients with ocular diseases such as macular degeneration, glaucoma, and diabetic retinopathy.6,7 Limited available literature has similarly suggested a relationship between visual acuity and VR-QoL in patients with uveitis.3,8,9
While there is a current paucity of QoL research in patients with uveitis,1,3 it is particularly important to gather this information for uveitis patients, as treatment often involves a step-ladder approach of corticosteroids and various systemic immunosuppressive drugs to control inflammation.4 Systemic side effects from therapy could potentially affect a patient’s quality of life, in addition to the impact of uveitis symptoms on a patient’s daily functioning.10 In a limited number of studies, it has been found that uveitis patients have significantly decreased HR-QoL compared to that of the general population.8,11,12 Despite these findings, there have been few studies that evaluate changes in QoL associated with specific immunosuppressive therapies in severe non-infectious uveitis.13,14 One such study was conducted in Milan and found that HR-QoL measured by the Italian SF-36 was significantly related to visual acuity, but did not investigate VR-QoL.12
In the First-line Antimetabolites as Steroid-sparing Treatment (FAST) Uveitis Trial, 216 adults with non-infectious uveitis from nine referral eye centers worldwide were randomized to methotrexate or mycophenolate mofetil to compare effectiveness.15 Mycophenolate mofetil was found to not provide greater corticosteroid-sparing control of inflammation compared to methotrexate as a first-line corticosteroid-sparing treatment. Subjects in the trial also completed a VR-QoL and HR-QoL questionnaire at baseline and the 6-month primary endpoint, or treatment failure before 6 months. Our group has previously reported that on average, visual acuity and all QoL scores (NEI-VFQ, IND-VFQ, SF36-v2 PCS, and SF36-v2 MCS) improved significantly in patients from baseline to the primary endpoint, with no significant difference between treatment groups.16 To better understand the relationships between visual acuity and VR-QoL and HR-QoL in uveitis patients receiving antimetabolite immunosuppressive therapy, this secondary analysis assessed the association and correlation between QoL (NEI-VFQ, IND-VFQ, SF-36) and visual acuity for patients in the trial, as well as the association between VR-QoL and HR-QoL.
Methods
Study design
The First-line Antimetabolites as Steroid-sparing Treatment (FAST) Uveitis Trial (ClinicalTrials.gov: NCT01829295)15 was a National Eye Institute-supported, randomized clinical trial that enrolled patients from August 2013 to August 2017 at nine referral eye centers in India, the United States, Australia, Saudi Arabia, and Mexico. Participants were block randomized with a 1:1 allocation ratio to oral methotrexate (25 mg weekly) or oral mycophenolate mofetil (1.5 g twice daily) and followed for up to 12 months, where dosing was based on the recommended maximum dosage used for these medications for uveitis and was therefore not weight-based17 (Figure 1). Each patient additionally received a standardized oral prednisone taper along with the randomized antimetabolite.15 In this secondary analysis, we focused on QoL at baseline and the primary study endpoint, defined as 6 months after enrollment, or the time of treatment failure prior to 6 months. Treatment success was defined as controlled ocular inflammation in both eyes at 6 months, with 7.5 mg/day of prednisone and less than or equal to 2 drops/day of topical 1% prednisolone acetate. Controlled ocular inflammation was defined by the following: (1) less than or equal to 0.5+ anterior chamber cells by SUN criteria,18 less than or equal to 0.5+ vitreous haze clinical grading using the NEI scale,18 and no active retinal or choroidal lesions; and (2) no more than 7.5 mg of oral prednisone daily and less than or equal to 2 drops of prednisolone acetate 1% (or equivalent) per day; and (3) no declaration of treatment failure due to intolerability or safety concerns. Treatment failure could occur at any time before or at 6 months from intolerability or safety issues.
Figure 1.
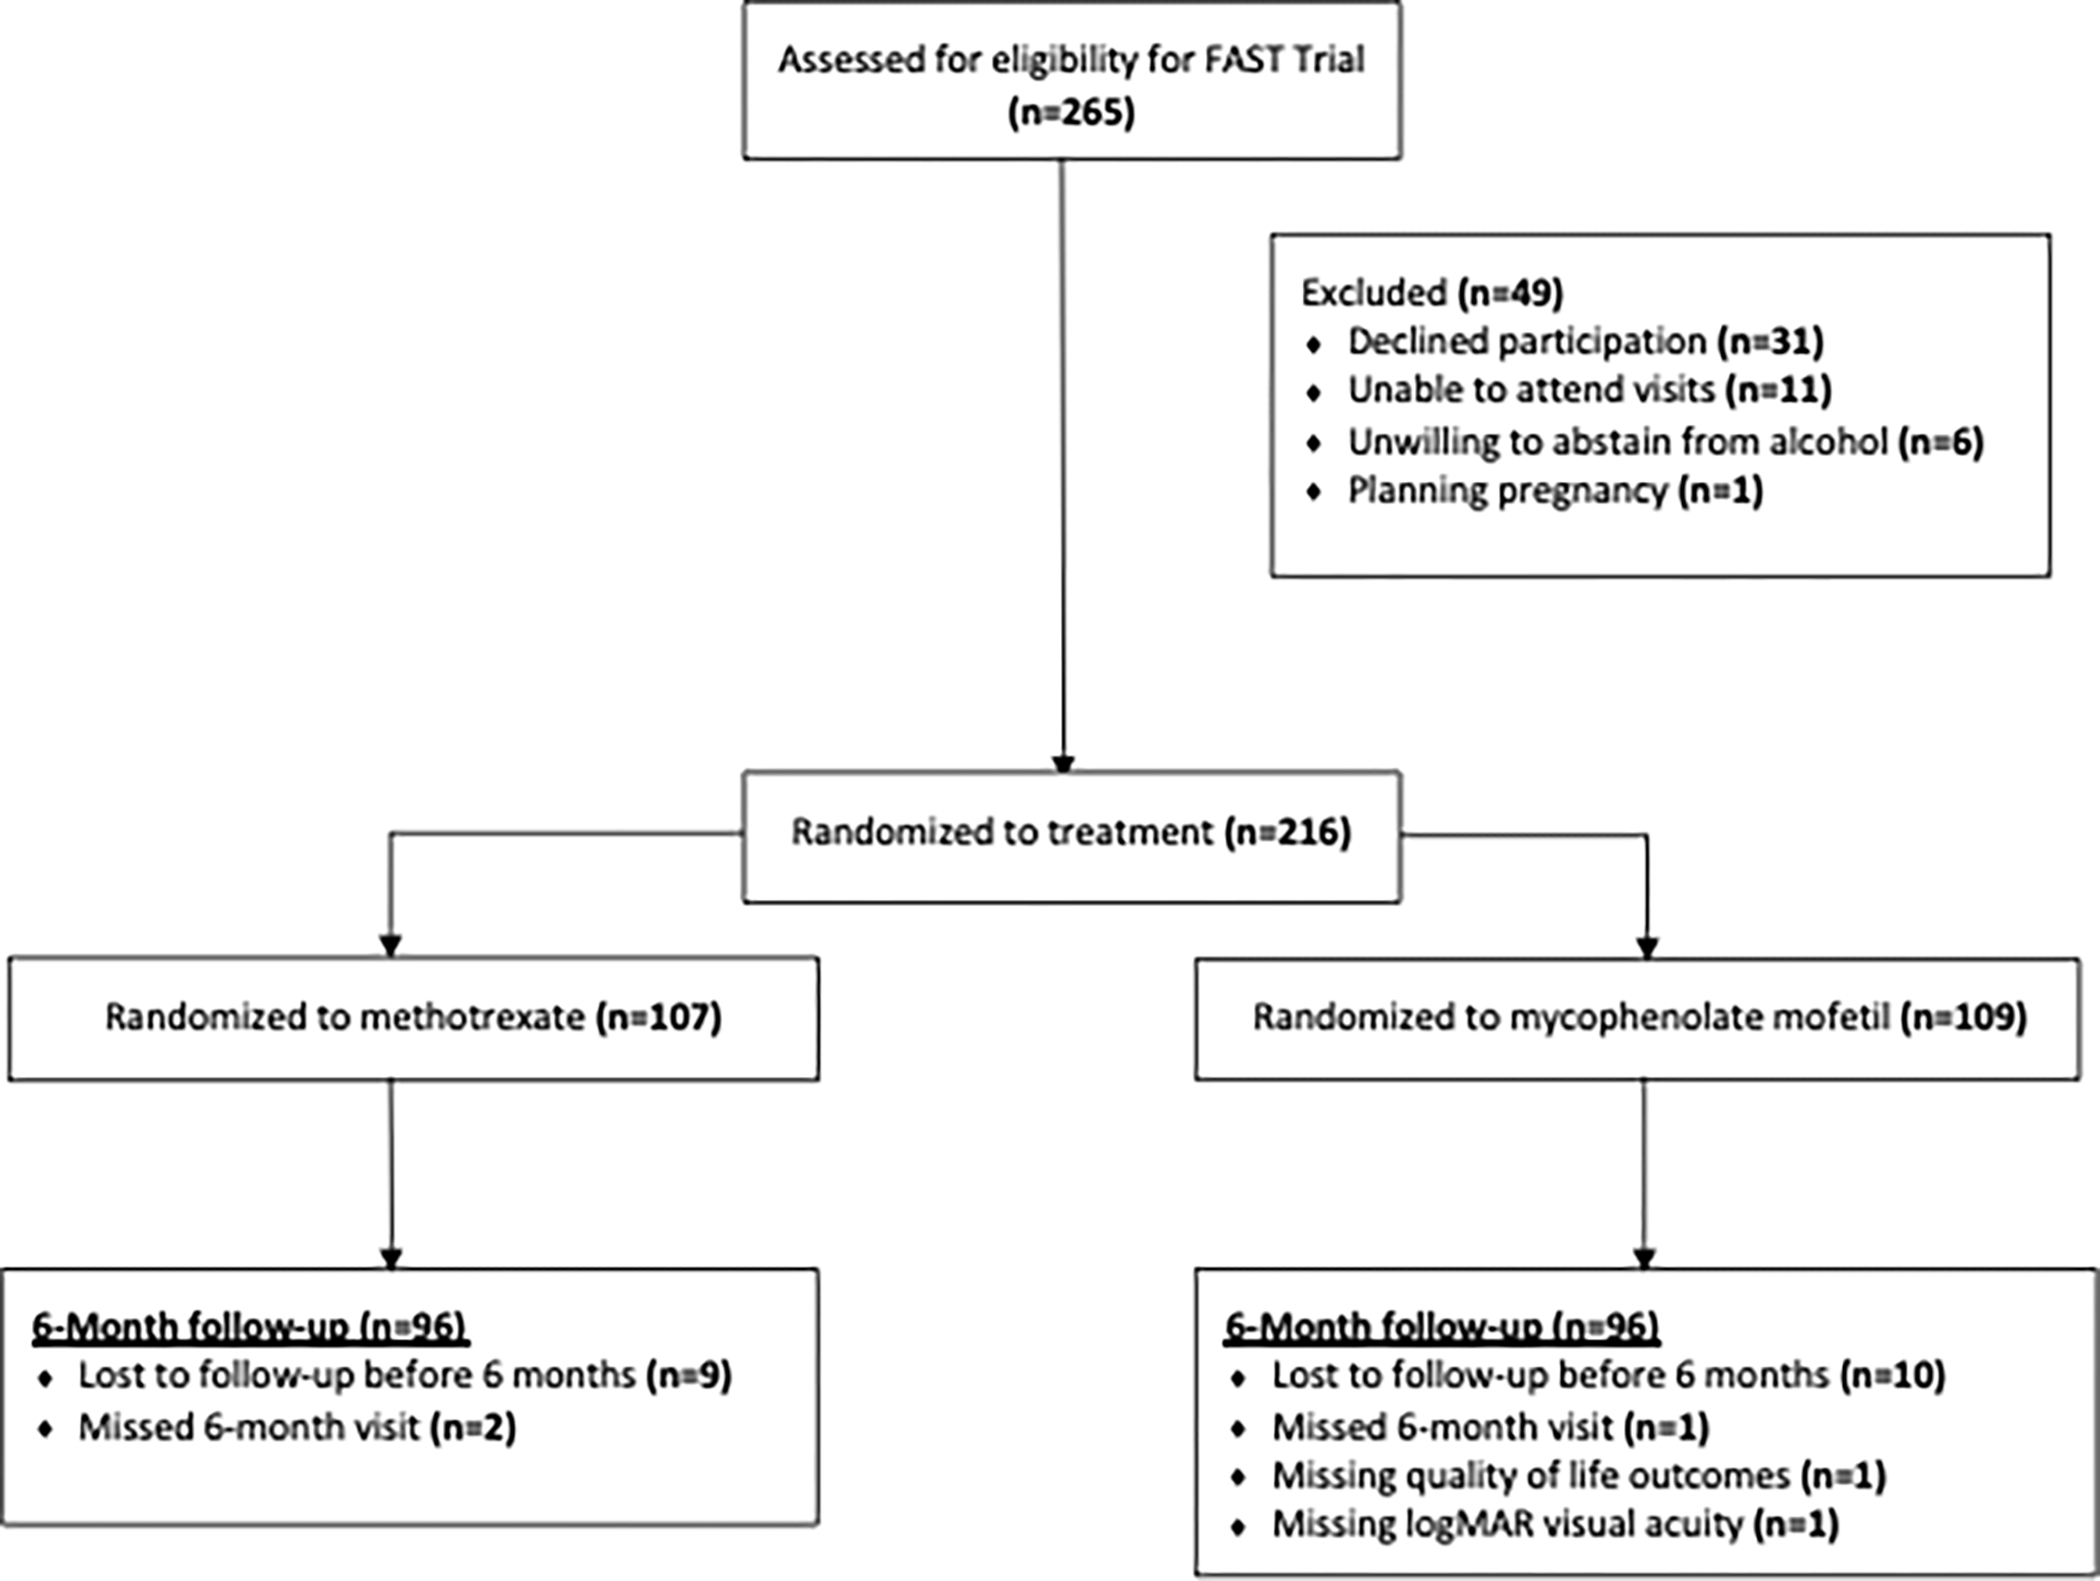
Flow of participants from the FAST Uveitis Trial included in this sub-analysis
Study eligibility
Patients who were eligible for the trial were aged sixteen and older, had active non-infectious intermediate, posterior, or pan-uveitis in at least one eye, and had reason to begin corticosteroid-sparing therapy. Approval from institutional review boards at all centers as well as informed consent from all participants was obtained. Research procedures adhered to the tenets of the Declaration of Helsinki. Additional details about study eligibility and design have been previously reported.15
Study outcomes
All QoL questionnaires were self-administered and given to participants in their preferred language in the absence of the treating physician by a study coordinator. If the patient was unable to complete the survey due to severely impaired visual acuity or function, the coordinator administered the questionnaires by reading the questions aloud to the patient and recording the patient’s answers on the appropriate questionnaire forms. Coordinators were trained not to rephrase or interpret questions for the patient in this case. Both the participant and study coordinator were unmasked to treatment assignment. Visual acuity examiners and treating physicians were masked to treatment group.
VR-QoL
VR-QoL was assessed using National Eye Institute Visual Functioning Questionnaire (NEI-VFQ)5 and a culturally-specific Tamil version for use in southern India, Indian Visual Functioning Questionnaire (IND-VFQ).19 These were selected because they are two of the few validated VR-QoL questionnaires at present20 and have been utilized in uveitis studies previously.9,10,21,22 All participants completed the NEI-VFQ, and participants enrolled in India also completed IND-VFQ questionnaires.
The NEI-VFQ contains 25 questions presented in a Likert scale format for rating the degree of severity of visual symptoms and resulting limitations. In addition to a composite score and a general health sub-scale, NEI-VFQ generates 11 sub-scales to further assess VR-QoL: general vision, ocular pain, near vision, distance vision, social functioning, mental health, role difficulties, dependency on others, driving, peripheral vision, and color vision.21 The score produced for each NEI VFQ-25 sub-scale, which ranges from to 0 (worst health) to 100 (best health), was the sum of the pre-coded numeric values of items within the scale, divided by the maximum possible score, and multiplied by 100.23 The composite score, which also ranges from 0 to 100, was the mean of the scores from each of the 11 sub-scales.21
The IND-VFQ contains 33 questions also presented in a Likert scale format. However, in contrast to the NEI-VFQ, it generates only 3 sub-scales to further assess QoL: general functioning, psychosocial impact, and visual symptoms. A composite score ranging from to 0 (worst health) to 100 (best health) was calculated as the mean of the scores from each category. Scoring of the IND-VFQ was conducted using recommendations from a previously reported Rasch analysis.24
HR-QoL
HR-QoL was assessed using the Medical Outcomes Study 36-Item Short Form Survey (SF-36v2)25, which was selected because it is the most validated measure of HR-QoL11 and has been used in prior uveitis studies.10–12,22 It contains 36 questions which are generally graded on a 5-point Likert scale. The questionnaire covers self-perception of both physical and mental health. The physical health domains are as follows: physical functioning, role limitations caused by physical health, bodily pain, and general health perceptions. The mental health domains are as follows: vitality (energy and fatigue), general mental health (psychological distress), role limitations due to emotional problems, and social functioning limitations due to emotional problems. Scores are normalized to a United States population and are coded, summed, and transformed to a scale from 0 (worst health) to 100 (best health).26 All SF-36v2 scores were calculated using QualityMetrics.27 In this analysis, we present the two components of SF-36v2 scores, physical component score (PCS) and mental component score (MCS). While SF-36 was developed under the Medical Outcomes Study (MOS) for participants at sites across the United States,28 we included SF-36 data for participants enrolled in India in our study, as the SF-36 questionnaire has also been used in numerous medical studies in India,29–31 and its validity and reliability in that population have been assessed.32
Visual Acuity
Visual acuity was measured in patients using a protocol adapted from the Age-Related Eye Disease Study.33 Best-corrected visual acuity (BCVA) was measured by masked examiners with a tumbling “E” chart, and a logarithm of the minimum angle of resolution (logMAR) value was obtained. The logMAR scale was developed to standardize visual acuity measurement. Each line contains 5 letters and the size of letters in each row is decreased in a uniform, step-wise fashion so that each line represents 0.10 log unit. The tumbling “E” chart was selected over other measures because some of the patients in India were unable to read English letters. The chart was located 4 meters from the participant and mounted on a standardized light box. All exams were performed in the same lanes within the same windowless rooms, and room lighting was measured with a photometer to maintain consistency.15 BCVA from the better-seeing uveitic eye was used in this analysis, as the better-seeing eye has often been thought to be more representative of overall visual acuity.
Statistical methods
To assess the correlation between QoL (both VR-QoL and HR-QoL) and visual acuity for patients in the trial, we determined the Spearman rank-order correlation between median visual acuity in the better-seeing eye obtained by logMAR at baseline and the primary endpoint and median QoL scores for each of the four measures (NEI-VFQ, IND-VFQ, SF-36v2 PCS, and SF-36v2 MCS) at baseline and the primary endpoint. We also determined the Spearman rank-order correlation between change in visual acuity and change in QoL. We used a Wilcoxon signed rank test to compare visual acuity at baseline and the primary endpoint.
To measure the association between visual acuity and QoL at the primary endpoint, we used linear mixed regression models. All multivariable models adjusted for randomized treatment, age, sex, study site as a random effect, baseline visual acuity, and respective baseline QoL, as was pre-specified in the FAST statistical analysis plan.15 To measure the association between VR-QoL and HR-QoL at the primary endpoint, linear mixed regression models were again employed, adjusting for treatment, age, sex, study site as a random effect, baseline NEI-VFQ, and baseline SF-36 scores. All statistical tests were two-sided using alpha=0.05, and all statistical analyses were conducted using R version 3.6.1 (R Project for Statistical Computing).
Results
Participant inclusion & baseline demographics
Of the 216 participants enrolled in the trial, 192 (88.9%) were included in this analysis because 1) these patients reached the primary endpoint and 2) they had complete visual acuity and QoL information. A complete case analysis was pre-specified for secondary analyses for the FAST Trial, which stated that any secondary analyses of the data would only include subjects who had available baseline and outcome data.15 Baseline demographic factors such as age and country, and clinical characteristics such as uveitis diagnosis and baseline oral prednisone dose are presented in Table 1. Because participants were randomized with a 1:1 allocation ratio to methotrexate or mycophenolate mofetil, we expected baseline characteristics to be balanced by treatment group. We found that all characteristics were balanced between the methotrexate and mycophenolate mofetil treatment groups except for sex; due to chance, females composed 72.9% of the methotrexate group and 60.4% of the mycophenolate mofetil group. Overall, the mean age of participants was 39.9 years, and most patients were enrolled in India (62.0%) followed by North America (25.5%). Additionally, most patients had a diagnosis of posterior/panuveitis (79.2%); the median oral prednisone dose at enrollment was 40.0 mg and the median maximum dose of oral prednisone in the 180 days prior to enrollment was 50.0 mg (Table 1). Additional participant demographic and clinical characteristics have been previously reported.15
Table 1.
Participant demographic and clinical characteristics at baseline, by treatment group
| Methotrexate (N=96) |
Mycophenolate Mofetil (N=96) |
Overall (N=192) |
|
|---|---|---|---|
|
| |||
| Sex | |||
| Female | 70 (72.9%) | 58 (60.4%) | 128 (66.7%) |
| Male | 26 (27.1%) | 38 (39.6%) | 64 (33.3%) |
| Age (years) | |||
| Mean (SD) | 38.1 (15.1) | 41.6 (14.3) | 39.9 (14.8) |
| Country | |||
| India | 60 (62.5%) | 59 (61.5%) | 119 (62.0%) |
| Australia | 10 (10.4%) | 6 (6.3%) | 16 (8.3%) |
| North America | 22 (22.9%) | 27 (28.1%) | 49 (25.5%) |
| Saudi Arabia | 4 (4.2%) | 4 (4.2%) | 8 (4.2%) |
| Occupation | |||
| Agriculture worker/farmer |
5 (5.2%) | 7 (7.3%) | 12 (6.23%) |
| Homemaker | 34 (35.4%) | 36 (37.5%) | 70 (36.5%) |
| Manual worker | 10 (10.4%) | 7 (7.3%) | 17 (8.9%) |
| Professional | 23 (24.0%) | 23 (24.0%) | 46 (24.0%) |
| Retired | 4 (4.2%) | 3 (3.1%) | 7 (3.6%) |
| Student | 12 (12.5%) | 9 (9.4%) | 21 (10.9%) |
| Tradesman | 5 (5.2%) | 3 (3.1%) | 8 (4.2%) |
| Unemployed | 3 (3.1%) | 8 (8.3%) | 11 (5.7%) |
| Education | |||
| Grade School | 25 (26.0%) | 27 (28.1%) | 52 (27.1%) |
| Secondary/high school | 39 (40.6%) | 38 (39.6%) | 77 (40.1%) |
| Undergraduate College | 11 (11.5%) | 11 (11.5%) | 22 (11.5%) |
| Graduate College | 12 (12.5%) | 8 (8.3%) | 20 (10.4%) |
| None | 9 (9.4%) | 12 (12.5%) | 21 (10.9%) |
| Anatomical Location | |||
| Intermediate | 18 (18.8%) | 22 (22.9%) | 40 (20.8%) |
| Posterior/Panuveitis | 78 (81.3%) | 74 (77.1%) | 152 (79.2%) |
| Oral prednisone (mg) | |||
| Maximum in past 180 days, median (IQR) | 50.0 (38.8, 60.0) | 50.0 (40.0, 75.0) | 50.0 (40.0, 60.0) |
| At baseline, median (IQR) | 40.0 (20.0, 50.0) | 40.0 (30.0, 60.0) | 40.0 (20.0, 55.0) |
Correlation between visual acuity and VR-QoL
LogMAR visual acuity in the better-seeing eye significantly improved from baseline to the primary endpoint (Wilcoxon signed rank test: p < 0.001). Furthermore, visual acuity and VR-QoL were found to be significantly correlated. The Spearman rank-order correlation between improvement in logMAR visual acuity from baseline to the primary endpoint in the better-seeing eye and NEI-VFQ composite score at baseline was 0.5 (p < 0.001) and NEI-VFQ at the primary endpoint was also 0.5 (p < 0.001) (Table 2), indicating that change in visual acuity is positively correlated with NEI-VFQ at baseline and at the primary endpoint. The correlation between change in visual acuity and change in NEI-VFQ composite score from baseline to the primary endpoint was 0.4 (p < 0.001) (Figure 2). In addition to composite score, NEI-VFQ sub-scales such as ocular pain, near vision, and distance vision were also evaluated, and an increase in every sub-scale was observed (Table 2). The median changes in logMAR visual acuity and NEI-VFQ from baseline to the primary endpoint were −0.1 (IQR: −0.3 to 0) and 12.2 (IQR 1.0 to 26.1), respectively.
Table 2.
Correlation between change in visual acuity and QoL (SF-36v2 and NEI-VFQ) at baseline and the primary endpoint
| Baseline | Primary Endpointa | ||||||||
|---|---|---|---|---|---|---|---|---|---|
| Median | IQR | Corr coef.b | p-valuec | Median | IQR | Corr coef.b | p-valuec | ||
|
| |||||||||
| logMAR (best eye) SF-36v2d |
0.2 | 0.02 to 0.5 | – | – | 0.02 | 0 to 0.2 | – | – | |
| MCS SF-36v2 | 40.9 | 36.6 to 48.7 | 0.3 | p<0.001 | 47.0 | 38.3 to 52.9 | 0.2 | p<0.001 | |
| PCS SF-36v2 |
44.0 | 39.4 to 52.0 | 0.5 | p<0.001 | 52.1 | 44.7 to 57.1 | 0.4 | p<0.001 | |
| NEI-VFQ d | |||||||||
| NEI-VFQ Composite score | 61.6 | 48.2 to 80.1 | 0.5 | p<0.001 | 81.4 | 68.6 to 92.9 | 0.5 | p<0.001 | |
| NEI-VFQ General Health score | 60.0 | 37.5 to 75.0 | 72.5 | 60.0 to 82.5 | |||||
| NEI-VFQ General Vision subscore | 60.0 | 50.0 to 70.0 | 80 | 65.0 to 85.0 | |||||
| NEI-VFQ Ocular Pain subscore | 62.5 | 37.5 to 87.5 | 75 | 62.5 to 100.0 | |||||
| NEI-VFQ Near Vision subscore | 70.0 | 56.7 to 86.7 | 86.7 | 76.7 to 96.7 | |||||
| NEI-VFQ Distance Vision subscore | 66.7 | 53.3 to 83.3 | 90.0 | 73.3 to 96.7 | |||||
| NEI-VFQ Vision specific: Social Functioning subscore | 73.3 | 53.3 to 93.3 | 93.3 | 80.0 to 100.0 | |||||
| NEI-VFQ Vision specific: Mental Health subscore | 60.0 | 37.5 to 75.0 | 75.0 | 50.0 to 91.2 | |||||
| NEI-VFQ Vision specific: Role difficulties subscore | 50.0 | 31.2 to 68.8 | 75.0 | 50.0 to 100.0 | |||||
| NEI-VFQ Vision specific: Dependency subscore | 50.0 | 25.0 to 81.2 | 87.5 | 50.0 to 100.0 | |||||
| NEI-VFQ Driving subscore | 78.3 | 55.4 to 87.9 | 86.7 | 78.3 to 93.3 | |||||
| NEI-VFQ Color Vision subscore | 80 | 60.0 to 100.0 | 100.0 | 100.0 to 100.0 | |||||
| NEI-VFQ Peripheral Vision subscore | 80 | 60.0 to 90.0 | 100 | 80.0 to 100.0 | |||||
Primary endpoint was defined as 6 months from the baseline visit (or the time of treatment failure prior to 6 months)
Correlation coefficients reported are based on the Spearman rank-order correlations between improvement in visual acuity in the better-seeing eye obtained by logMAR, and QoL at both baseline and primary endpoint
Reported p-values are for Spearman rank-order correlations
Quality of life scales: mental component score of the Medical Outcomes Study 36-Item Short Form Survey (MCS SF-36v2); physical component score of the Medical Outcomes Study 36-Item Short Form Survey (PCS SF-36v2); National Eye Institute Visual Functioning Questionnaire (NEI-VFQ) and its sub-scales
Figure 2.

Correlations between change in QoL and change in visual acuity
For patients enrolled in India (n = 119), the correlation between improvement in logMAR visual acuity in the better-seeing eye from baseline to the primary endpoint and IND-VFQ at baseline and IND-VFQ at the primary endpoint were both 0.5 (p < 0.001). The correlation between change in visual acuity and change in IND-VFQ from baseline to the primary endpoint was also 0.5 (p < 0.001) (Figure 2). For this subset of patients, the median logMAR visual acuity at baseline and primary endpoint were 0.3 (IQR: 0.2 to 0.6) and 0.02 (IQR 0 to 0.2) respectively, and the median change in logMAR visual acuity was −0.2 (IQR −0.4 to −0.02). The median IND-VFQ at baseline and the primary endpoint were 69.6 (IQR 42.0 to 80.2) and 91.1 (IQR 76.2 to 100.0), respectively, and the median change in IND-VFQ was 16.9 (3.9 to 41.7).
Correlation between visual acuity and HR-QoL
As with visual acuity and VR-QoL, visual acuity was found to also be significantly correlated with HR-QoL. The correlation between improvement in logMAR visual acuity in the better-seeing eye and SF36-v2 MCS score at baseline was 0.3 (p < 0.001) and SF36-v2 MCS score at the primary endpoint was 0.2 (p < 0.001) (Table 2). The correlation between change in visual acuity and change in SF36-v2 MCS from baseline to the primary endpoint was 0.3 (p < 0.001) (Figure 2), and the median change in SF36-v2 MCS was 3.0 (IQR: −3.8 to 12.1).
The correlation between improvement in logMAR visual acuity in the better-seeing eye and SF36-v2 PCS score at baseline was 0.5 (p < 0.001) and SF36-v2 PCS score at the primary endpoint was 0.4 (p < 0.001) (Table 2). The correlation between change in visual acuity and change in SF36-v2 PCS from baseline to the primary endpoint was 0.4 (p < 0.001) (Figure 2), and the median change in SF36-v2 PCS was 3.6 (IQR: −1.4 to 15.0).
Associations between visual acuity and QoL (VR-QoL and HR-QoL)
In a linear mixed model, every 5-letter improvement in visual acuity (0.1 unit decrease in logMAR) at the primary endpoint was associated with an improvement in the primary endpoint NEI-VFQ of 2.0 points (p < 0.001). Every 5-letter improvement in visual acuity at the primary endpoint was also associated with an improvement of 2.3 points in the primary endpoint IND-VFQ (p < 0.001). In terms of HR-QoL, every 5-letter improvement in visual acuity at the primary endpoint was associated with an increase in the primary endpoint SF36-v2 PCS score by 0.7 points (p < 0.001) and the primary endpoint SF36-v2 MCS score by 0.7 points (p < 0.005). Treatment group was not significantly associated with any of these measures of QoL (NEI-VFQ, IND-VFQ, SF36-v2 MCS, SF36-v2 PCS) (Table 3). All of these models adjusted for randomized treatment, age, sex, study site as a random effect, baseline visual acuity, and respective baseline QoL.
Table 3.
Association between visual acuity and QoL at the primary endpoint based on linear mixed modelsa
| Coef. | 95% CI | p-value | |
|---|---|---|---|
|
| |||
| MCS SF-36v2 at primary endpoint b,c | |||
| Visual Acuity at Primary Endpoint (unit: 5 lettersd) |
0.7 | 0.2 to 1.3 | 0.004 |
| MCS SF-36v2 at Baseline | 0.5 | 0.3 to 0.6 | <0.001 |
| Visual Acuity at Baseline (unit: 5 lettersd) |
−0.3 | −0.8 to 0.1 | 0.18 |
| Methotrexate (vs. mycophenolate) | −0.4 | −3.1 to 2.2 | 0.76 |
| Age (years) | −0.1 | −0.2 to -0.03 | 0.01 |
| Male | 0.9 | −2.0 to 3.7 | 0.55 |
| PCS SF-36v2 at primary endpoint b,c | |||
| Visual Acuity at Primary Endpoint (unit: 5 lettersd) |
0.7 | 0.4 to 1.1 | <0.001 |
| PCS SF-36v2 at Baseline | 0.4 | 0.2 to 0.5 | <0.001 |
| Visual Acuity at Baseline (unit: 5 lettersd) |
−0.2 | −0.5 to 0.2 | 0.30 |
| Methotrexate (vs. mycophenolate) | 0.6 | −1.2 to 2.4 | 0.53 |
| Age (years) | −0.1 | −0.2 to -0.1 | <0.001 |
| Male | 0.7 | −1.4 to 2.7 | 0.52 |
| NEI-VFQ at primary endpoint b,c | |||
| Visual Acuity at Primary Endpoint (unit: 5 lettersd) |
2.0 | 1.4 to 2.6 | <0.001 |
| NEI-VFQ at Baseline | 0.5 | 0.3 to 0.6 | <0.001 |
| Visual Acuity at Baseline (unit: 5 lettersd) |
−0.6 | −1.2 to 0.003 | 0.06 |
| Methotrexate (vs. mycophenolate) | 2.0 | −1.3 to 5.3 | 0.24 |
| Age (years) | −0.2 | −0.3 to -0.1 | 0.001 |
| Male | −1.5 | −5.0 to 2.1 | 0.43 |
| IND-VFQ at primary endpoint b,c | |||
| Visual Acuity at Primary Endpoint (unit: 5 lettersd) |
2.3 | 1.5 to 3.2 | <0.001 |
| IND-VFQ at Baseline | 0.2 | 0.04 to 0.3 | 0.006 |
| Visual Acuity at Baseline (unit: 5 lettersd) |
−0.2 | −1.1 to 0.6 | 0.65 |
| Methotrexate (vs. mycophenolate) | 4.0 | −0.8 to 8.9 | 0.11 |
| Age (years) | −0.2 | −0.4 to -0.1 | 0.009 |
| Male | −2.4 | −7.7 to 2.8 | 0.38 |
All multivariable models controlled for age, sex, study site as a random effect, baseline visual acuity, and baseline QoL
Quality of life scales: National Eye Institute Visual Functioning Questionnaire (NEI-VFQ); Indian Vision Function Questionnaire (IND-VFQ; Indian participants only); mental component score of the Medical Outcomes Study 36-Item Short Form Survey (MCS SF-36v2); physical component score of the Medical Outcomes Study 36-Item Short Form Survey (PCS SF-36v2)
Primary endpoint was defined as 6 months from the baseline visit (or the time of treatment failure prior to 6 months)
Unit of 5 letters corresponds to 0.1 logMAR
Association between VR-QoL and HR-QoL
An increase in NEI-VFQ score was associated with an increase in both MCS and PCS scales of the SF36-v2 at the primary endpoint. Every 10 unit increase in NEI-VFQ at the primary endpoint was associated with an average increase in the primary endpoint SF36-v2 PCS score by 3.2 points (95% CI: 2.6 to 3.8) (p < 0.001), and an average increase in the primary endpoint SF36-v2 MCS score by 4.4 points (95% CI: 3.7 to 5.2) (p < 0.001), adjusting for treatment, age, sex, study site as a random effect, baseline NEI-VFQ, and baseline SF36-v2 scores.
Discussion
In this sub-analysis, we focused on four relationships: a) correlation between visual acuity and VR-QoL, b) correlation between visual acuity and HR-QoL, c) associations between visual acuity and QoL (VR-QoL and HR-QoL), and d) association between VR-QoL and HR-QoL. We found that changes in VR-QoL and HR-QoL were significantly correlated and associated with changes in visual acuity. In addition, VR-QoL was associated with clinically and statistically significant improvements in HR-QoL. All observed improvements in QoL met or exceeded the minimal clinically important difference (MCID) definition for each scale (defined as: SF-36v2 MCID: 3–5 points34, NEI-VFQ MCID: 4–6 points35, and IND-VFQ MCID: ≥0.5 times the standard deviation of the mean (11.8 points)).36 Therefore, the relationship between visual acuity and QoL is expected to be highly meaningful clinically. Results were comparable for patients treated with methotrexate and mycophenolate mofetil.
We had hypothesized that VR-QoL and HR-QoL would be correlated with visual acuity, as patients’ perceptions of their health and vision would likely improve as visual acuity improved with uveitis treatment. We found these correlations were indeed positive and significant, suggesting that QoL improves as visual acuity improves. The Spearman coefficients between visual acuity and NEI-VFQ, IND-VFQ, and SF-36v2 MCS and PCS were relatively low (0.5, 0.5, 0.3, and 0.4, respectively), another expected and pertinent finding. While a relationship exists between visual acuity and QoL, visual acuity cannot be used as a direct proxy for QoL given the low correlation. In other words, visual acuity and QoL capture different patient experiences and aspects of health. These results reinforce that QoL provides critical insights beyond visual acuity about the effects of treatment on patients with uveitis and should be collected in patients undergoing treatment.
This sub-analysis also produced important findings with regards to VR-QoL specifically. Along with composite NEI-VFQ score, each sub-scale of NEI-VFQ also showed an improvement from baseline to primary endpoint, indicating that various aspects of these patients’ vision-related health improved. Therefore, assessing these measures provides a more comprehensive picture of visual outcomes beyond a single logMAR measurement. Additionally, NEI-VFQ and the culturally-specific IND-VFQ showed comparable correlations and associations with visual acuity. In line with prior analyses of this data that found NEI-VFQ and IND-VFQ scores were highly correlated among participants enrolled in India at baseline and the primary endpoint,16 our findings suggest that the two VR-QoL scores were comparable among participants enrolled in India.
Our findings here build on the results of previous work. A sub-analysis of the Multicenter Uveitis Steroid Treatment (MUST) Trial found that HR-QoL measures such as EQ-5D and SF-36 PCS were not as sensitive to changes in visual acuity compared to VR-QoL,22 which is supported by our finding of a higher correlation coefficient between visual acuity and VR-QoL compared to that between visual acuity and HR-QoL measures. In the MUST trial, improvements in visual acuity were associated with significant improvements in NEI-VFQ at 6 months in patients with active intermediate, posterior, or pan-uveitis, consistent with our results. Every 5-letter improvement in visual acuity (0.1 unit decrease in logMAR) at primary endpoint was associated with an improvement in primary endpoint NEI-VFQ of 2.7, similar to the improvement in primary endpoint NEI-VFQ of 2.0 that was observed in our analysis.22 Prior work from our group on a pilot study that included 80 patients in India found that every 5-letter improvement in visual acuity was associated with an improvement in IND-VFQ of 3.2, consistent with the improvement in primary endpoint IND-VFQ of 2.3 that was observed in our analysis.37
While the FAST Trial had a randomized design and masked outcomes that contributed to its internal validity and a diverse patient population that contributed to its external validity, there are limitations to this work. Our analysis focused on the better-seeing eye because we expected it would be most representative of overall visual acuity, although we may have missed some additional benefit by not considering visual acuity from both eyes. Furthermore, SF-36v2 and NEI-VFQ questionnaires, both developed originally in English, may not measure QoL consistently across patients from all geographical locations, an important consideration because the majority of subjects were in India. However, it is reassuring that the correlations and associations between visual acuity and VR-QoL were similar for both NEI-VFQ and IND-VFQ questionnaires in participants enrolled in India. Finally, loss to follow-up could have impacted results, although this was only approximately 10% and balanced between treatment groups.
In summary, tracking quality of life is an important component of assessing outcomes in patients with uveitis because of disease symptoms and possible therapy side effects. This sub-analysis of a clinical trial comparing antimetabolites for uveitis found that visual acuity is significantly correlated and associated with HR-QoL and VR-QoL at a clinically meaningful level. The relatively low correlations suggest that QoL measures add highly useful insights into health status beyond visual acuity. Including these measures in future studies will help us gain a comprehensive picture of the experience of patients undergoing treatment for uveitis.
Acknowledgements and Financial Disclosure
c. Other Acknowledgements:
The authors would like to acknowledge the Data and Safety Monitoring Committee members: Maureen G. Maguire, PhD (chair), William E. Barlow, PhD, Steven Yeh, MD, Albert T.Vitale, MD, Jaqueline J. Glover, PhD, and Narsing A. Rao, MD. The authors would also like to acknowledge the NEI Program Official, Donald F. Everett, MA.
a. Funding/Support:
This study received support from NEI cooperative agreement U10 EY021125 (Acharya). The Department of Ophthalmology at University of California, San Francisco is supported by an unrestricted grant from the Research to Prevent Blindness Foundation, a core grant (EY06190) from the NEI, and That Man May See Foundation. The sponsors had no role in the design or conduct of this research.
Abbreviations and Acronyms:
- QoL
quality of life
- VR-QoL
vision-related quality of life
- HR-QoL
health-related quality of life
- FAST
First-line Antimetabolites as Corticosteroid Sparing Treatment
- NEI-VFQ
National Eye Institute Visual Functioning Questionnaire
- IND-VFQ
Indian Visual Functioning Questionnaire
- SF-36v2
Medical Outcomes Study 36-Item Short Form Survey
- PCS
physical component score
- MCS
mental component scor
- 95% CI
95% confidence interval
- MCID
minimal clinically important difference
Footnotes
b. Disclosure of Interest: The authors report there are no competing interests to declare.
Conflict of Interest: No conflicting relationship exists for any author.
Trial Registration: ClinicalTrials.govIdentifier:NCT01829295 (FAST Uveitis Trial)
Trial Registration Date: April 11, 2013
References
- 1.Durrani OM, Meads CA, Murray PI. Uveitis: A potentially blinding disease. Ophthalmologica. 2004;218(4):223–236. doi: 10.1159/000078612 [DOI] [PubMed] [Google Scholar]
- 2.Thorne JE, Skup M, Tundia N, et al. Direct and indirect resource use, healthcare costs and work force absence in patients with non-infectious intermediate, posterior or panuveitis. Acta Ophthalmol. 2016;94(5):e331–e339. doi: 10.1111/aos.12987 [DOI] [PMC free article] [PubMed] [Google Scholar]
- 3.Frick KD, Drye LT, Kempen JH, et al. Associations among visual acuity and vision- and health-related quality of life among patients in the multicenter uveitis steroid treatment trial. Invest Ophthalmol Vis Sci. 2012;53(3):1169–1176. doi: 10.1167/iovs.11-8259 [DOI] [PMC free article] [PubMed] [Google Scholar]
- 4.Pasadhika S, Rosenbaum JT. Update on the use of systemic biologic agents in the treatment of noninfectious uveitis. Biologics. 2014;8:67–81. doi: 10.2147/BTT.S41477 [DOI] [PMC free article] [PubMed] [Google Scholar]
- 5.Mangione CM. Development of the 25-list-item National Eye Institute Visual Function Questionnaire. Archives of Ophthalmology. 2001;119(7):1050. doi: 10.1001/archopht.119.7.1050 [DOI] [PubMed] [Google Scholar]
- 6.Brown MM, Brown GC, Sharma S, Busbee B. Quality of life associated with visual loss: A time tradeoff utility analysis comparison with medical health states. Ophthalmology. 2003;110(6):1076–1081. doi: 10.1016/S0161-6420(03)00254-9 [DOI] [PubMed] [Google Scholar]
- 7.Dong LM. Health- and vision-related quality of life among patients with choroidal neovascularization secondary to age-related macular degeneration at enrollment in randomized trials of submacular surgery: SST report no. 4. Am J Ophthalmol. 2004;138(1):91–108. doi: 10.1016/j.ajo.2004.02.011 [DOI] [PubMed] [Google Scholar]
- 8.Murphy CC, Greiner K, Plskova J, Frost NA, Forrester JV., Dick AD. Validity of using vision-related quality of life as a treatment end point in intermediate and posterior uveitis. British Journal of Ophthalmology. 2007;91(2):154–156. doi: 10.1136/bjo.2006.105528 [DOI] [PMC free article] [PubMed] [Google Scholar]
- 9.Venkataraman A, Rathinam S. A pre- and post-treatment evaluation of vision-related quality of life in uveitis. Indian J Ophthalmol. 2008;56(4):307. doi: 10.4103/0301-4738.39662 [DOI] [PMC free article] [PubMed] [Google Scholar]
- 10.Kempen JH, Jabs DA. Quality of life and risks associated with systemic anti-inflammatory therapy versus fluocinolone acetonide intraocular implant for intermediate uveitis, posterior uveitis, or panuveitis: Fifty-four-month results of the Multicenter Uveitis Steroid Treatment Trial and Follow-up Study. Ophthalmology. 2015;122(10):1976–1986. doi: 10.1016/j.ophtha.2015.06.043 [DOI] [PMC free article] [PubMed] [Google Scholar]
- 11.Schiffman RM, Jacobsen G, Whitcup SM. Visual Functioning and General Health Status in Patients With Uveitis. [DOI] [PubMed] [Google Scholar]
- 12.Miserocchi E, Modorati G, Mosconi P, Colucci A, Bandello F. Quality of life in patients with uveitis on chronic systemic immunosuppressive treatment. Ocul Immunol Inflamm. 2010;18(4):297–304. doi: 10.3109/09273941003637510 [DOI] [PubMed] [Google Scholar]
- 13.Jalil A, Yin K, Coyle L, Harper R, Jones NP. Vision-related quality of life and employment status in patients with uveitis of working age: A prospective study. Ocul Immunol Inflamm. 2012;20(4):262–265. doi: 10.3109/09273948.2012.684420 [DOI] [PubMed] [Google Scholar]
- 14.Kaleemunnisha S, Sudharshan S, Biswas J. Quality of life in non-infectious uveitis patients on immunosuppressive therapy. Middle East Afr J Ophthalmol. 2014;21(3):225–231. doi: 10.4103/0974-9233.134675 [DOI] [PMC free article] [PubMed] [Google Scholar]
- 15.Rathinam SR, Gonzales JA, Thundikandy R, et al. Effect of Corticosteroid-Sparing Treatment with Mycophenolate Mofetil vs Methotrexate on Inflammation in Patients with Uveitis: A Randomized Clinical Trial. JAMA - Journal of the American Medical Association. 2019;322(10):936–945. doi: 10.1001/jama.2019.12618 [DOI] [PMC free article] [PubMed] [Google Scholar]
- 16.Kelly NK, Chattopadhyay A, Rathinam SR, et al. Health- and Vision-Related Quality of Life in a Randomized Controlled Trial Comparing Methotrexate and Mycophenolate Mofetil for Uveitis. Ophthalmology. Published online 2021. doi: 10.1016/j.ophtha.2021.02.024 [DOI] [PMC free article] [PubMed] [Google Scholar]
- 17.Jabs DA, Rosenbaum JT, Foster CS, et al. PERSPECTIVE Guidelines for the Use of Immunosuppressive Drugs in Patients With Ocular Inflammatory Disorders: Recommendations of an Expert Panel; 2000. [DOI] [PubMed] [Google Scholar]
- 18.Jabs DA, Nussenblatt RB, Rosenbaum JT, Group S of UN SUN W. Standardization of uveitis nomenclature for reporting clinical data. Results of the First International Workshop. Am J Ophthalmol. 2005;140(3):509–516. doi: 10.1016/j.ajo.2005.03.057 [DOI] [PMC free article] [PubMed] [Google Scholar]
- 19.Gupta SK, Viswanath K, Thulasiraj RD, et al. The development of the Indian vision function questionnaire: Field testing and psychometric evaluation. British Journal of Ophthalmology. 2005;89(5):621–627. doi: 10.1136/bjo.2004.050732 [DOI] [PMC free article] [PubMed] [Google Scholar]
- 20.Seddon J, Fong D, Massof RW, Rubin GS. PUBLIC HEALTH AND THE EYE Visual Function Assessment Questionnaires. Vol 45. [DOI] [PubMed] [Google Scholar]
- 21.Sheppard J, Joshi A, Betts KA, et al. Effect of adalimumab on visual functioning in patients with noninfectious intermediate uveitis, posterior uveitis, and panuveitis in the VISUAL-1 and VISUAL-2 Trials. JAMA Ophthalmol. 2017;135(6):511–518. doi: 10.1001/jamaophthalmol.2017.0603 [DOI] [PMC free article] [PubMed] [Google Scholar]
- 22.Sugar EA, Burke AE, Venugopal V, Thorne JE, Holbrook JT. Responsiveness of Vision-Specific and General Quality of Life Metrics to Ocular and Systemic Events in Patients with Uveitis. Ophthalmology. 2020;127(12):1710–1718. doi: 10.1016/j.ophtha.2020.07.038 [DOI] [PMC free article] [PubMed] [Google Scholar]
- 23.Schippert AC, Jelin E, Moe MC, Heiberg T, Grov EK. The Impact of Age-Related Macular Degeneration on Quality of Life and Its Association With Demographic Data: Results From the NEI VFQ-25 Questionnaire in a Norwegian Population. Gerontol Geriatr Med. 2018;4:233372141880160. doi: 10.1177/2333721418801601 [DOI] [PMC free article] [PubMed] [Google Scholar]
- 24.Finger RP, Kupitz DG, Holz FG, et al. The impact of the severity of vision loss on vision-related quality of life in india: An evaluation of the IND-VFQ-33. Invest Ophthalmol Vis Sci. 2011;52(9):6081–6088. doi: 10.1167/iovs.11-7388 [DOI] [PubMed] [Google Scholar]
- 25.Ware J SC. The MOS 36-Item Short-Form Health Survey (SF-36): Conceptual Framework and Item Selection. Med Care. 1992;30(6). [PubMed] [Google Scholar]
- 26.Brazier JE, Harper R, B Jones NM, Thomas KJ, Usherwood T, Westlake L. GENERAL PRACTICE Validating the SF-36 Health Survey Questionnaire: New Outcome Measure for Primary Care. [DOI] [PMC free article] [PubMed] [Google Scholar]
- 27.Maruish M, DeRosa M. A guide to the integration of certified Short Form survey scoring and data quality evaluation capabilities. Published online 2009. [Google Scholar]
- 28.Tarlov AR, Ware JE Jr, Greenfield S, Nelson EC, Perrin E, Zubkoff M. The Medical Outcomes Study: An Application of Methods for Monitoring the Results of Medical Care. JAMA. 1989;262(7):925–930. doi: 10.1001/jama.1989.03430070073033 [DOI] [PubMed] [Google Scholar]
- 29.Aarthy R, Mikocka-Walus A, Pradeepa R, Anjana RM, Mohan V, Aston-Mourney K. Quality of Life and Diabetes in India: A Scoping Review. Indian J Endocrinol Metab. 2021;25(5):365–380. doi: 10.4103/ijem.ijem_336_21 [DOI] [PMC free article] [PubMed] [Google Scholar]
- 30.Janani K, Jain M, Vargese J, et al. Health-related quality of life in liver cirrhosis patients using SF-36 and CLDQ questionnaires. Clin Exp Hepatol. 2018;4(4):232–239. doi: 10.5114/ceh.2018.80124 [DOI] [PMC free article] [PubMed] [Google Scholar]
- 31.Varma GR, Yadlapalli K, Babu B. Health-related quality of life of elderly living in the rural community and homes for the elderly in a district of India: Application of the short form 36 (SF-36) health survey questionnaire. Z Gerontol Geriatr. 2009;43:259–263. doi: 10.1007/s00391-009-0077-x [DOI] [PubMed] [Google Scholar]
- 32.Sinha R, van den Heuvel WJA, Arokiasamy P. Validity and Reliability of MOS Short Form Health Survey (SF-36) for Use in India. Indian J Community Med. 2013;38(1):22–26. doi: 10.4103/0970-0218.106623 [DOI] [PMC free article] [PubMed] [Google Scholar]
- 33.The Age-Related Eye Disease Study (AREDS): Design Implications AREDS Report No. 1; 2006. [DOI] [PMC free article] [PubMed]
- 34.Walters SJ, Brazier JE. What is the relationship between the minimally important difference and health state utility values? The case of the SF-6D. Health Qual Life Outcomes. 2003;1:4. doi: 10.1186/1477-7525-1-4 [DOI] [PMC free article] [PubMed] [Google Scholar]
- 35.Suñer IJ, Kokame GT, Yu E, Ward J, Dolan C, Bressler NM. Responsiveness of NEI VFQ-25 to changes in visual acuity in neovascular AMD: Validation studies from two phase 3 clinical trials. Invest Ophthalmol Vis Sci. 2009;50(8):3629–3635. doi: 10.1167/iovs.08-3225 [DOI] [PubMed] [Google Scholar]
- 36.Finger RP, Kupitz DG, Fenwick E, et al. The Impact of Successful Cataract Surgery on Quality of Life, Household Income and Social Status in South India. PLoS One. 2012;7(8). doi: 10.1371/journal.pone.0044268 [DOI] [PMC free article] [PubMed] [Google Scholar]
- 37.Niemeyer KM, Gonzales JA, Rathinam SR, et al. Quality-of-Life Outcomes From a Randomized Clinical Trial Comparing Antimetabolites for Intermediate, Posterior, and Panuveitis. Am J Ophthalmol. 2017;179:10–17. doi: 10.1016/j.ajo.2017.04.003 [DOI] [PMC free article] [PubMed] [Google Scholar]