

Abstract
Objectives:
We investigated the relationship between the cognitive status of participants’ spouses and participants’ own cognitive outcomes, controlling for mid-life factors.
Methods:
Participants (n=1,845; baseline age 66–90 years) from the prospective Atherosclerosis Risk in Communities Study were followed from 2011 to 2019. We used linear regression and Cox proportional hazard models to estimate whether spouses of people with MCI/dementia had lower cognitive functioning and elevated risk of incident dementia.
Results:
Having a spouse with MCI/dementia was associated with a deficit in cognitive function (b = −0.09 standard deviations; 95% CI = −0.18, 0.00). Adjustment for mid-life risk factors attenuated this association (b = −0.02 standard deviations; 95% CI = −0.10, 0.06). We observed no significant relationship between spousal MCI/dementia status and incident dementia (hazard ratio = 0.97; 95% CI = 0.69, 1.38).
Discussion:
Spousal cognitive status is not associated with poor cognitive outcomes independent of mid-life factors.
Keywords: cognitive decline, dementia, caregiving, spouse, prospective cohort
Introduction
Due to projections of rising dementia prevalence in the United States and limited treatment options currently available, it is important to identify modifiable risk factors implicated in the etiology of late-life health outcomes (Alzheimer’s Association, 2021). Several studies have shown that spouses of people with MCI or dementia have lower cognitive functioning and higher risk of dementia than spouses who of people with normal cognition, even if those people have other physical health conditions that require caregiving (Dassel et al., 2017; de Vugt et al., 2006; Norton et al., 2010; Wu-Chung et al., 2022). The reasons for this association are not clear, which makes it difficult to design interventions to improve cognitive outcomes for spouses of people with MCI/dementia.
Caregiver stress is the most common explanation offered for the association between having a spouse living with dementia and one’s own dementia risk. Although there are some perceived benefits to caregiving (Roth et al., 2015), much research documents the social, emotional, financial, and physical burdens that caregivers of people with MCI or dementia face (Dassel & Carr, 2016; Fonareva & Oken, 2014; Ory et al., 1999; Välimäki et al., 2016). Among caregivers of people with dementia, 59% reported high emotional stress and 38% reported high physical stress (Alzheimer’s Association, 2021). This stress is chronic, since people frequently live 4–8 years following a dementia diagnosis, and some live for much longer (Brookmeyer et al., 2002). A recent systematic review proposed a biopsychosocial framework connecting spousal caregiving with stress-related changes in the brain (e.g., via chronic inflammation) and cognitive dysfunction (Wu-Chung et al., 2022). An implication of this model is that intervening to alleviate the stress of spousal caregiving may lower risk of cognitive dysfunction as these caregivers age.
Despite the predominance of the theoretical model described above, there may be an alternative explanation for the concordance between spouse’s cognitive aging outcomes: shared risk factors. Mid-life social, behavioral, and cardiometabolic factors including low education, smoking, alcohol consumption, physical inactivity, obesity, hypertension, and diabetes, and high cholesterol are strongly related to late-life cognitive health (Livingston et al., 2020). Prior studies support the notion that assortative mating, partner influence, and shared environments contribute to concordance in these risk factors between spouses (Appiah et al., 2019; Cobb, Godino, et al., 2016; Cobb, McAdams-DeMarco, et al., 2016; Di Castelnuovo et al., 2009; McAdams DeMarco et al., 2011; Smits, 2003). Therefore, as previous studies have noted (Norton et al., 2010; Vitaliano et al., 2011), the spouse of a person with MCI or dementia may have lower cognitive function and increased dementia risk because both individuals share a common elevated risk profile, not because of caregiver stress. The shared risk factor model provides a possible explanation for the finding in a previous study that dementia caregivers had higher risk of cognitive decline than other types of caregivers (Dassel et al., 2017); if caregiver stress was the primary mediating pathway, it is difficult to explain this unique burden on dementia caregivers specifically.
Prior studies did not attempt to disentangle the importance of shared risk factors versus caregiver stress as drivers of the concordance between spouses’ late-life cognitive health, perhaps because they did not have access to prospective data from mid to late life. From a public health and clinical perspective, it is important to distinguish between these pathways. If shared risk factors are confounding the relationship, that would suggest that behavioral and lifestyle interventions in mid-life aimed at improving healthy cognitive aging should target both individuals and their spouses to have maximal impact. On the other hand, if caregiver stress and subsequent biological stress pathways mediate the relationship, interventions should be developed to mitigate these negative impacts among caregivers.
In previous studies, having a spouse with cognitive impairment was associated with both lower cognitive functioning (Dassel et al., 2017; de Vugt et al., 2006) and greater risk of incident dementia (Norton et al., 2010). Alzheimer’s Disease and AD-related dementia have a long natural history, and declines in cognitive functioning can occur for years before dementia is diagnosed (Wilson et al., 2012). Therefore, both outcomes are relevant for understanding the cognitive health of spouses of people with MCI/dementia.
In the current study, we address two research questions: (1) Is having a spouse with MCI or dementia associated with lower cognitive function and elevated risk of incident dementia for the non-impaired spouse? (2) Is this association confounded by shared risk factors present in midlife, before either spouse had dementia?
Our conceptual model is depicted in Figure 1. We predict that there will be a significant association between a participant’s spouse’s cognitive status and cognitive outcomes for the participant. The shared risk factor model hypothesizes that this association is explained by pre-existing social, behavioral, and cardiometabolic risk factors that are correlated within spouse pairs (measured at mid-life, before either spouse had cognitive impairment). If true, this would suggest that any association between spousal caregiving and cognitive outcomes would be attenuated and no longer significant after adjusting for midlife risk factors. On the other hand, the caregiver stress model hypothesizes that having a spouse with MCI or dementia induces a stress response in the caregiver. If true, this would suggest that an association between spousal caregiving and cognitive outcomes would persist after adjusting for midlife risk factors.
Figure 1.

Conceptual Diagram of Hypothesized Relationships
There may be modification in the relationships depicted if Figure 1 by sex. Previous research has shown that, in heterosexual couples, wives exhibit greater caregiving-related stress than husbands do (Arbel et al., 2019; Gibbons et al., 2014), and caregiving wives are less likely to seek and receive support (Brown & Chen, 2008). Therefore, we explicitly consider whether the answers to our research questions above differ between male and female participants.
Methods
Data
Prospective data from spouse pairs in the Atherosclerosis Risk in Communities (ARIC) study were used to address our research questions. The ARIC cohort enrolled 15,792 mostly Black and White participants aged 45–64 in 1987–89. Participants were recruited from communities near examination centers in suburbs of Minneapolis, Minnesota; Forsyth County, North Carolina; Jackson, Mississippi; and Washington County, Maryland. The institutional review boards at each participating institution approved study protocols and all participants provided written informed consent at each visit. Cohort members are contacted regularly by telephone (once per year prior to 2012, twice per year since), tracked continually for hospitalizations and mortality, and have been invited to participate in seven in-person clinic examinations through 2019. Assessments to ascertain cognitive status began at Visit 5, which occurred in 2011–13. This examination served as the baseline for our analyses, though we adjusted for some mid-life covariates collected at earlier examinations.
The steps taken to arrive at the analytic sample are described in Figure 2. The ARIC cohort, at baseline, included 9,014 individuals clustered in 4,507 male-female spouse pairs, of which 4,050 individuals participated in the Visit 5 examination. The sample was further limited to those with normal cognitive function at the time of that examination, whose spouse was still alive, who had not divorced or separated prior to Visit 5, whose spouse’s cognitive status was known, and who were not missing baseline cognitive data. The analysis was performed using the remaining 1,845 individuals. We provide a table in the online supplement (eTable 1) comparing mid-life (Visit 1) characteristics of ARIC participants based on whether they were excluded or included in our analytic sample. On average, participants who were included in our analytic sample were younger, more highly educated, and healthier than those who were excluded, which is expected considering that participants had to survive and be cognitively normal at Visit 5 to be included.
Figure 2.
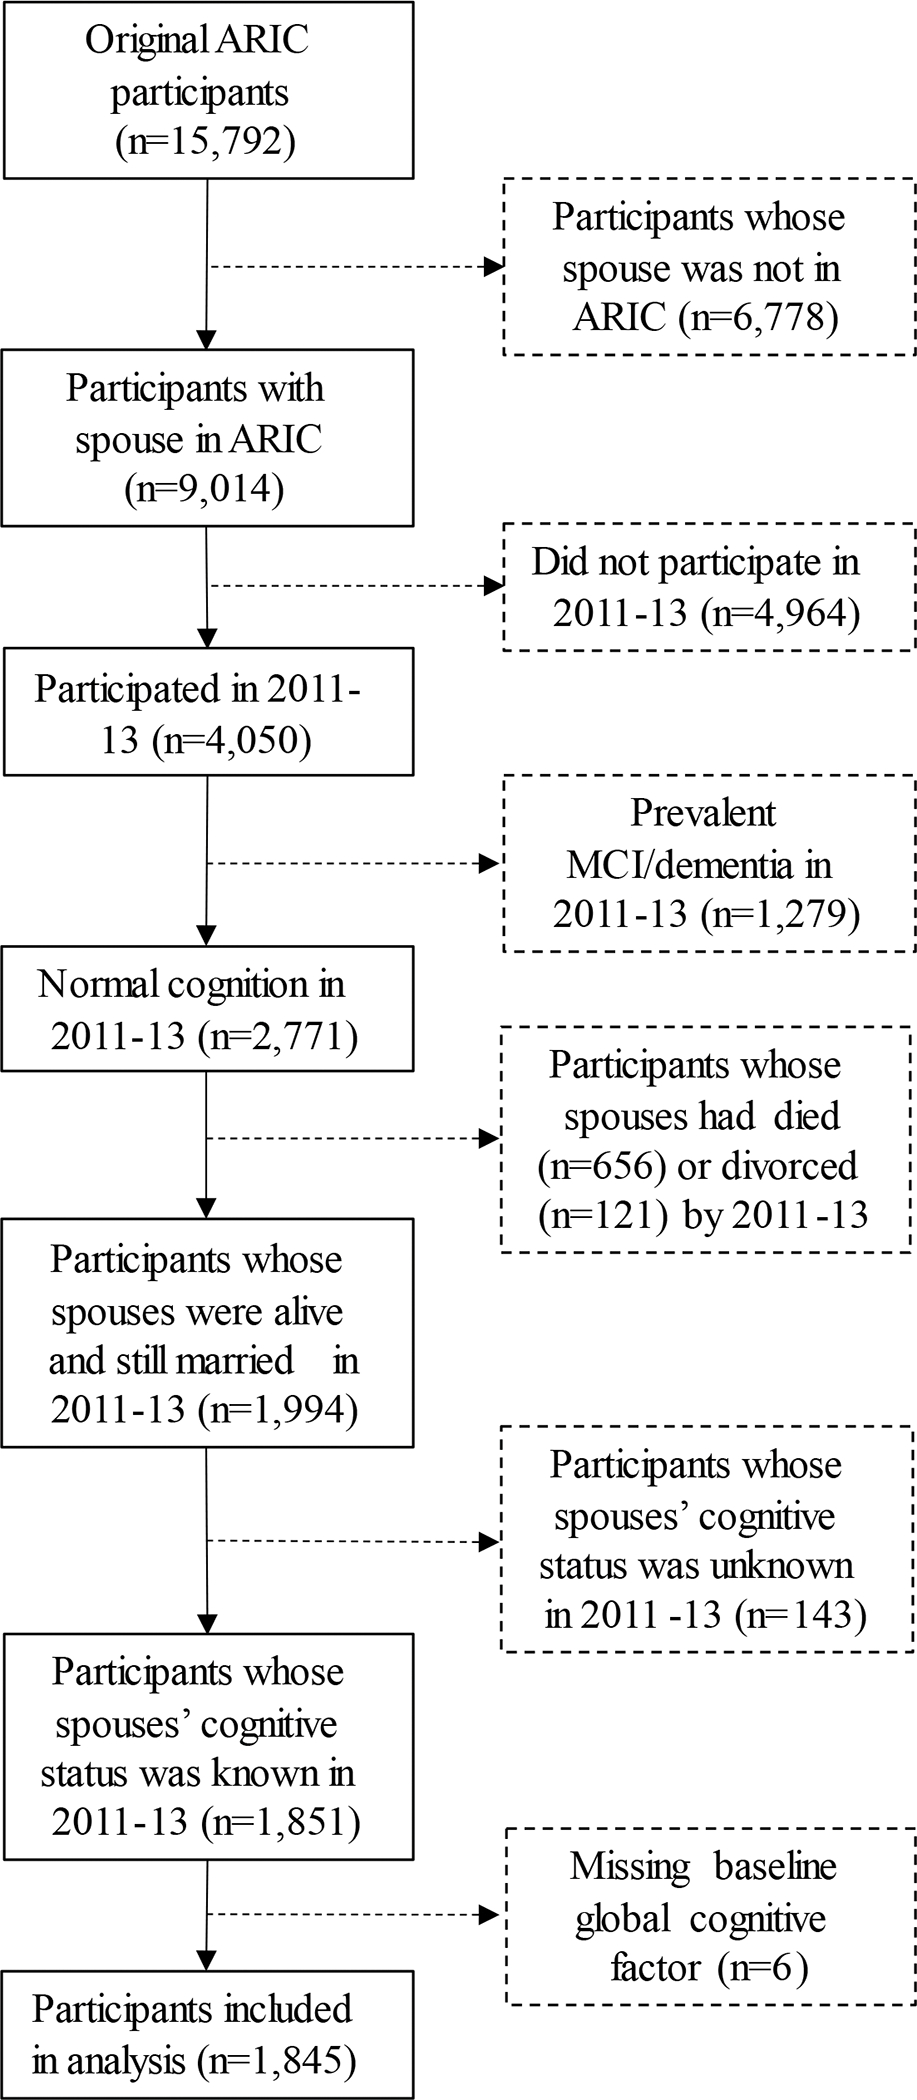
Sample Exclusion Criteria
Although both spouses in each couple were ARIC participants, whether both, just one, or neither of the spouses were included in the analytic sample depended on each individual’s own characteristics, while each participant’s “exposure” status depended on the characteristics of his or her spouse. For instance, if at Visit 5 a wife did not have dementia but her husband did, the wife (who was “at risk” for incident dementia) was included in the analytic sample while the husband was not (because he was not “at risk” for incident dementia). The wife was considered “exposed” to a spouse with dementia. If both participants in a couple were ascertained to have dementia at Visit 5, both individuals were excluded from the analytic sample. If both participants in a couple were cognitively normal at Visit 5, both were included in the analytic sample because they are both “at risk” for developing incident dementia. The exposure status both was “unexposed” because they both had a cognitively normal spouse.
Measures
Spousal Cognitive Status
The primary exposure variable in this analysis was whether the participant was married to a person with MCI or dementia. Spouse pairs were identified at Visit 1 (1987–89) using the household roster for ARIC participants. Annual follow up data was used to identify couples who had divorced or separated prior to Visit 5. At Visit 5, all individuals completed an in-person cognitive assessment consisting of memory, language/executive function, semantic fluency, and processing speed (Schneider et al., 2015). Those with low cognitive scores (<1.5 standard deviations below population-specific norms) underwent a full neurological examination. Two experts independently classified each participant as being cognitively normal, having MCI, or having dementia. Differences were adjudicated by the ARIC Neurocognitive Classification Committee. A detailed description of the criteria for ascertaining MCI or dementia in ARIC has been provided elsewhere (Knopman et al., 2016). For those whose spouses did not complete an in-person examination at Visit 5, we used information from a leveled dementia classification adjudicated by the ARIC Neurocognitive Classification Committee that relies on information from validated phone screeners and hospital discharge codes (Knopman et al., 2016). A participant was classified as married to a person with MCI or dementia if his or her spouse was ascertained to have either of these conditions at or before Visit 5. No direct questions about caregiving responsibilities were asked in the ARIC study at the time of Visit 5.
Global cognitive function
At Visit 5 (2011–13), Visit 6 (2016–17), and Visit 7 (2018–19), ARIC participants completed 10 cognitive assessments: Digit Symbol Substitution, Delayed Word Recall, Phonemic Fluency, Logical Memory, Digit Span, incidental learning, Trail Making parts A and B, phonemic fluency, and the Boston naming test. These validated assessments measure memory, language/executive function, and processing speed. Using confirmatory factor analysis, a latent factor was derived from these individual tests to measure global cognition (Gross et al., 2015). This score was standardized to have a mean 0 and standard deviation 1 at Visit 5.
Incident dementia
Following previous ARIC study analyses, we used several sources to ascertain incident dementia from Visit 5 (2011–13) to Visit 7 (2018–19) (Knopman et al., 2016): i) for those who completed in-person examinations at Visits 6 and 7, dementia status was ascertained via neuropsychological examination, ii) twice-yearly participants were called by telephone and the Six Item Screener (Callahan et al., 2002) conducted, with follow-up proxy completion of the AD8 screening tool (Galvin et al., 2005) when appropriate, and iii) surveillance via hospital discharge codes and death records, which were gathered as part of the cohort’s standard procedures. Observation time for incident dementia analyses began at the date of Visit 5 examination and ended at the date of dementia diagnosis, death, or loss to follow-up.
Mid-life covariates
To evaluate whether shared risk factors confounded the association between individuals’ cognitive status and their spouse caregivers’ cognitive outcomes, we controlled for several mid-life factors that predict late-life cognitive health. Each mid-life factor was measured at Visit 1 (1987–89). Education was self-reported as highest level of education, which was recoded into three categories (< high school, high school, or college). Smoking was based on self-reports about whether participants had ever smoked cigarettes and whether they currently smoked cigarettes; we used these data to create a variable indicating never, former, and current smokers. Alcohol consumption habits were self-reported, and we categorized participants as never, former, or current drinkers. Physical activity was determined using the Baecke questionnaire (Baecke et al., 1982), which asked participants to report how frequently they participated in sports and walking in the previous year; these measures were converted to minutes per week of moderate and vigorous exercise. We categorized participants as inactive (0 minutes/week), somewhat active (1–74 minutes/week vigorous or 1–149 minutes per week moderate or 1–149 minutes/week vigorous and moderate), and active (≥75 minutes/week vigorous or ≥150 minutes/week moderate or ≥150 minutes/week vigorous and moderate). Body mass index (BMI) was calculated from measured weight and height and categorized as normal (<25 kg/m2), overweight (25–29.9 kg/m2), or obese (≥30 kg/m2). Systolic (SBP) and diastolic (DBP) blood pressure were assessed using the average of three measurements with a random-zero sphygmomanometer. Blood pressure was categorized as normal (SBP <120 mm Hg and DBP <80 mm Hg, untreated), prehypertensive (SBP 120–139 mm Hg, untreated; or DBP 80–89 mm Hg, untreated), or hypertensive (SBP ≥140 mm Hg; DBP ≥90 mm Hg; or BP lowering medications). Fasting blood drawn from ARIC participants was used to measure glucose and total cholesterol. Fasting blood glucose was categorized as normal (<100 mg/dL, untreated), prediabetic (100–125 mg/dL, untreated), or diabetic (≥126 mg/dL or diabetes medication). Total cholesterol was categorized as poor (≥240 mg/dL), intermediate (<200 mg/dL treated or 200–239 mg/dL untreated), or ideal (<200 mg/dL untreated).
A small number (n=30) of participants in our analytic sample were missing data on one or more mid-life risk factors. In order to retain as many cases as possible, we imputed missing data using Stata’s MICE command (Royston & White, 2011). The results we present are based on 10 imputed data sets.
Additional demographic covariates
We also adjusted our statistical models for baseline age (measured at Visit 5), sex, and field site. Racial identity is nearly entirely confounded with field site in the ARIC sample used in these analyses (100% of participants from Mississippi were Black; >95% of participants from North Carolina, Minnesota, and Maryland were White), so we did not separately adjust our models for race.
Statistical analysis
We first described the means (for continuous measures) and frequencies (for categorical measures) of all variables in our analysis. We further compared the distribution of characteristics of participants who were married to people with MCI/dementia and those who were not. We tested for significant differences between exposure groups using t-tests and chi-squared tests for continuous and categorical variables, respectively.
The shared risk factor model is based on the hypothesis that spouse pairs are concordant on mid-life risk factors for cognitive health. To test this hypothesis in the ARIC study population, we calculated the correlation between spouse pairs on mid-life education, smoking, alcohol consumption, physical activity, BMI, hypertension, diabetes, and cholesterol. Because these variables are ordinal, we expressed correlation using Spearman’s Rho, which ranges from 1 (perfect positive correlation between ranks) to −1 (perfect negative correlation between ranks) (Spearman, 1904).
We estimated the association between the exposure (being married to a person with MCI/dementia) and change in cognitive function using linear mixed effects models. Each participant had up to three observations of global cognitive function between Visits 5–7. Of the 1,845 participants who attended visit 5 and were included in our analysis, 1,280 (69%) took part in Visit 6 an average of 4.9 years later, and 1,170 (63%) participated in Visit 7 an average of 6.6 years later. A strength of mixed effects models is that participants are retained in the analysis even if they did not complete each observation (Hox et al., 2010). The mixed effects models included a person-level random intercept to account for the correlation of observations on the same individual over time. We did not include any person-level random coefficients because random coefficients generally require more observations to estimate than we had available (Hox et al., 2010). These models took the basic form:
| (1) |
where cognitive function () measured for participant at Visit was modeled as a function of that participant’s spouse’s cognitive status at Visit 5 (). The trend in cognitive function over time was estimated using a time variable () that indexes the years since Visit 5 at each observation. Additionally, we tested for differences in the slope of cognitive change over time by interacting spousal cognitive status with time (). The person-level random intercept is represented by and the observation-level error term is represented by .
We estimated three separate linear mixed effects regression models for global cognitive function. Model 1 was based on equation 1 above, with additional adjustment for baseline age, sex, and field site. In Model 2, to partially test the shared risk factor model, we further adjusted for education. Finally, in Model 3, we fully tested the shared risk factor model by adjusting for mid-life smoking, alcohol consumption, physical activity, BMI, hypertension, diabetes, and cholesterol. To account for the non-independence of ARIC spouse pairs for whom both members were included in the analyses, we clustered the standard errors of our regression models at the spouse pair level.
To examine the relationship between our exposure and incident dementia, we estimated Cox proportional hazard models. Person-time accrued from the date of the participant’s Visit 5 clinic examination until incident dementia, loss-to-follow-up, death or December 31, 2019. These models followed the same progression as described above, with a base model (adjusted for age, sex, and field site), a partial shared risk factor model (adjusted for education), and a full shared risk factor model (adjusted for mid-life smoking, alcohol consumption, physical activity, BMI, hypertension, diabetes, and cholesterol). We adjusted standard errors for clustering at the spouse pair level.
For our main analyses, participants married to people with MCI or dementia were combined into a single exposure category. However, as a sensitivity check, we performed supplementary analyses in which we considered as separate exposures having a spouse with MCI or dementia. We also performed supplementary analyses to examine heterogeneity in the exposure-outcome relationship between men and women (tested using interaction terms). Additionally, we conducted a sensitivity check for our incident dementia analyses that only considered dementia cases ascertained via in-person examination or phone screener, excluding those whose dementia was only ascertained via hospital discharge or death records.
All analyses were conducted using Stata version 14.
Results
Descriptive Analyses
Descriptive statistics for the sample are shown in Table 1. The mean age at baseline was 74.9 years (range = 66–90 years). Approximately 53% of the sample were female. Slightly more than one-quarter of sample participants were married to people with MCI/dementia at Visit 5. There were several statistically significant differences in the distribution of participant characteristics by spousal cognitive status. Participants married to people with MCI/dementia were older (75.7 vs. 74.5 years, p<0.001), more likely to be female (59.8% vs. 51.0%, p<0.001), less likely to be college educated (40.2% vs. 51.2%, p<0.001), and less likely to meet recommended physical activity levels in midlife (40.0% vs. 46.9%, p=0.03). Participants married to people with MCI/dementia also had approximately 0.2 standard deviations lower cognitive function scores than other participants at every Visit in late life (p<0.05). During the observation window, 159 participants (8.6% of the sample) developed dementia. There were no significant bivariate differences by spousal cognitive status in the proportion of those who developed dementia.
Table 1.
Descriptive Statistics: Atherosclerosis Risk in Communities Cohort
| By Participant’s Spouse’s Cognitive Status |
||||
|---|---|---|---|---|
| Variable | Full Sample (N=1,845) | Normal (N=1,338) | MCI/Dementia (N=507) | P-valuea |
|
| ||||
| Participant’s Spouse’s Cognitive Status, N (%) | ||||
| Normal | 1,338 (72.5) | |||
| MCI/Dementia | 507 (27.5) | |||
| Age, M ± SD | 74.9 ± 4.5 | 74.5 ± 4.4 | 75.7 ± 4.8 | <0.001 |
| Sex, N (%) | <0.001 | |||
| Male | 860 (46.6) | 656 (49.0) | 204 (40.2) | |
| Female | 985 (53.4) | 682 (51.0) | 303 (59.8) | |
| Field Site | 0.87 | |||
| Minneapolis, MN | 712 (38.6) | 517 (38.6) | 195 (38.5) | |
| Washington County, MD | 508 (27.5) | 365 (27.3) | 143 (28.2) | |
| Forsyth County, NC | 432 (23.4) | 319 (23.8) | 113 (22.3) | |
| Jackson, MS | 193 (10.5) | 137 (10.2) | 56 (11.1) | |
| Education, N (%) | <0.001 | |||
| <High School | 176 (9.6) | 115 (8.6) | 61 (12.1) | |
| High School | 776 (42.2) | 535 (40.1) | 241 (47.7) | |
| College | 886 (48.2) | 683 (51.2) | 203 (40.2) | |
| Midlife Smoking, N (%) | 0.57 | |||
| Never | 945 (51.3) | 682 (51.1) | 263 (52.0) | |
| Former | 634 (34.4) | 456 (34.2) | 178 (35.2) | |
| Current | 262 (14.2) | 197 (14.8) | 65 (12.9) | |
| Midlife Alcohol Consumption, N (%) | 0.10 | |||
| Never | 402 (21.9) | 275 (20.6) | 127 (25.2) | |
| Former | 228 (12.4) | 170 (12.7) | 58 (11.5) | |
| Current | 1,209 (65.7) | 890 (66.7) | 319 (63.3) | |
| Midlife Physical Activity, N (%) | 0.030 | |||
| 0 minutes/week | 513 (27.8) | 361 (27.0) | 152 (30.0) | |
| 1–74 minutes/week vigorous or 1–149 minutes/week moderate | 501 (27.2) | 349 (26.1) | 152 (30.0) | |
| ≥75 minutes/week vigorous or ≥150 minutes/week moderate | 830 (45.0) | 627 (46.9) | 203 (40.0) | |
| Midlife BMI, N (%) | 0.45 | |||
| Normal | 751 (40.8) | 552 (41.3) | 199 (39.3) | |
| Overweight | 746 (40.5) | 543 (40.6) | 203 (40.1) | |
| Obese | 345 (18.7) | 241 (18.0) | 104 (20.6) | |
| Midlife Hypertension, N (%) | 0.38 | |||
| Normal | 1,033 (56.3) | 757 (56.9) | 276 (54.9) | |
| Prehypertension | 449 (24.5) | 329 (24.7) | 120 (23.9) | |
| Hypertension | 352 (19.2) | 245 (18.4) | 107 (21.3) | |
| Midlife Diabetes, N (%) | 0.99 | |||
| Normal | 1,118 (60.9) | 810 (60.8) | 308 (61.1) | |
| Prediabetes | 650 (35.4) | 473 (35.5) | 177 (35.1) | |
| Diabetes | 69 (3.8) | 50 (3.8) | 19 (3.8) | |
| Midlife Total Cholesterol, N (%) | 0.41 | |||
| Poor | 352 (19.3) | 249 (18.8) | 103 (20.6) | |
| Moderate | 698 (38.3) | 501 (37.8) | 197 (39.4) | |
| Ideal | 774 (42.4) | 574 (43.4) | 200 (40.0) | |
| V5 Cognitive Factor Score, M ± SD | 0.0 ± 1.0 | 0.1± 1.0 | −0.1 ± 1.0 | <0.001 |
| V6 Cognitive Factor Score, M ± SD | −0.3 ± 1.1 | −0.3 ± 1.1 | −0.5 ± 1.1 | 0.012 |
| V7 Cognitive Factor Score, M ± SD | −0.3 ± 1.1 | −0.3 ± 1.1 | −0.5 ± 1.2 | 0.014 |
| Incident Dementia Cases, N (%) | 159 (8.6) | 110 (8.2) | 49 (9.7) | 0.32 |
P-values come from t-tests (for continuous variables) or chi-squared tests (for categorical variables) for significant differences by spouse’s cognitive status.
The correlations in mid-life risk factors between spouse pairs are provided in eTable 2 (online appendix). Spearman’s Rho for all variables—except diabetes and cholesterol—was positive and significant, indicating that spouses are concordant on these risk factors. The strength of the correlation is modest for education (ρ = 0.46) and alcohol (ρ = 0.61) while it is relatively weak for all other variables (ρ ≤ 0.25). These results somewhat support the hypothesis that spouses share risk factors for poor cognitive outcomes before these outcomes are apparent in either spouse.
Linear Mixed Effects Models of Global Cognitive Function
Table 2 shows coefficients from linear mixed effect regression models estimating the association between spousal cognitive status and global cognitive function. In Model 1, compared to participants with cognitively healthy spouses, participants married to people with MCI or dementia scored about 1/10th of a standard deviation lower on cognitive assessments (β = −0.09, CI = −0.18, 0.00). There was a significant decline in cognitive function over time between Visits 5 and 7, equal (β = −0.07, CI = −0.08, −0.07). However, the (spouse cognitive status) X (time) interaction term was not significant, indicating that participants married to people with MCI/dementia did not experience steeper cognitive decline over time than other participants. In Model 2, after adjusting for education, the estimated effect of spousal MCI/dementia status on baseline cognitive functioning attenuated toward the null and was no longer significant (β = −0.03, CI = −.11, 0.05). This coefficient did not change much after further adjustment for other mid-life risk factors in Model 3 (β = −0.02, CI = −.10, 0.06).
Table 2.
Association between participant’s spouse’s MCI/dementia status and participant’s cognitive decline: Atherosclerosis Risk in Communities Cohort, 2011–2019 (n=1,845)
| Model 1 | Model 2 | Model | ||||
|---|---|---|---|---|---|---|
| b | 95% CI | b | 95% CI | b | 95% CI | |
|
| ||||||
| Participant’s Spouse’s | ||||||
| Cognitive Status | ||||||
| Normal | 0 (Ref) | 0 (Ref) | 0 (Ref) | |||
| MCI/Dementia | −0.09* | (−0.18, 0.00) | −0.03 | (−0.11, 0.05) | −0.02 | (−0.10, 0.06) |
| Time | −0.07 | (−0.08, −0.07) | −0.07*** | (−0.08, −0.07) | −0.07*** | (−0.08, −0.07) |
| Time × Spouse MCI/Dementia | 0.00 | (−0.01, 0.01) | 0.00 | (−0.01, 0.01) | 0.00 | (−0.01, 0.01) |
Note: All models adjust for age, field site, and sex. Model 2 adjusts for educational attainment. Model 3 adjusts for educational attainment, smoking, alcohol consumption, physical activity, BMI, hypertension, diabetes, and total cholesterol. All models adjust standard errors for clustering within spouse pairs.
p<0.05
p<0.01
p<0.001
In supplementary analyses, we did not observe significant sex differences in our results (eTable 3). We also conducted supplementary analyses in which participants married to people with MCI and dementia were considered as separate exposure categories (eTable 4). The coefficients for these two groups did not significantly differ.
Cox Models of Incident Dementia
The association between spouse MCI/dementia status and dementia risk, estimated from Cox proportional hazard models, is shown in Table 3. The median follow-up time in the sample was 6.6 years. Approximately 8% of the sample (N=159) developed dementia during the observation window. Compared to participnats with cognitively healthy spouses, participants married to people with MCI or dementia did not have significantly different risk of dementia (hazard ratio [HR] = 0.97; CI = 0.69, 1.38). This estimated coefficient did not substantively change after adjusting for education (Model 2) or other mid-life risk factors (Model 3).
Table 3.
Association between participant’s spouse’s MCI/dementia status and participant’s incident dementia: Atherosclerosis Risk in Communities Cohort, 2011–2019 (n=1,845)
| Model 1 | Model 2 | Model 3 | ||||
|---|---|---|---|---|---|---|
| HR | 95% CI | HR | 95% CI | HR | 95% CI | |
|
| ||||||
| Participant’s Spouse’s | ||||||
| Cognitive Status | ||||||
| Normal | 1 (Ref) | 1 (Ref) | 1 (Ref) | |||
| MCI/Dementia | 0.97 | (0.69, 1.38) | 0.90 | (0.63, 1.28) | 0.92 | (0.64, 1.31) |
Note: All models adjust for age, field site, and sex. Model 2 adjusts for educational attainment. Model 3 adjusts for educational attainment, smoking, alcohol consumption, physical activity, BMI, hypertension, diabetes, and total cholesterol. All models adjust standard errors for clustering within spouse pairs.
p<0.05
p<0.01
p<0.001
We also conducted supplementary analyses for incident dementia to examine differences by sex (eTable 5) and type of spousal cognitive impairment (eTable 6). We did not observe any significant differences in the relationship between the exposure and incident dementia across these sub-groups.
We conducted sensitivity analyses using dementia cases ascertained only via in-person examination or telephone screener (n=134). Results from these analyses closely resemble our main results, showing no significant association between spouse’s cognitive status and incident dementia (eTable 7).
Discussion
In this study, we investigated whether individuals married to people with MCI or dementia experienced lower cognitive function or elevated dementia risk than individuals married to people with normal cognition. We found that having a spouse with MCI or dementia was associated with a slight but statistically significant deficit in baseline cognition in late life, which was explained by differences in midlife risk factors. However, contrary to our expectations, having a spouse with MCI or dementia was not associated with elevated risk of incident dementia over a median follow up of 6.6 years.
Multiple hypotheses have been proposed to explain why individuals married to people with cognitive impairment would have worse cognitive outcomes. The shared risk factor model, which emphasizes the correlation of mid-life risk factors, was supported by our finding that education level, smoking, alcohol consumption, physical activity, BMI, and hypertension were all correlated between spouses at mid-life. In multivariable regression analyses, we found that education accounted for most of the association between spousal MCI/dementia status and global cognition. This suggests that the “shared risk factor” model provides the best explanation of the relationship between individuals’ cognitive impairment and their spouses’ low cognitive function.
An alternative hypothesis to explain poor cognitive outcomes among those married to people with MCI/dementia is the “caregiver stress” model, which emphasizes the psychological burden of caregiving responsibilities that frequently fall on non-impaired spouses. We did not have sufficient data about stress pathways in ARIC to explicitly test this model. However, our main finding—that there is no independent association between spousal cognitive status and participants’ own cognitive outcomes net of midlife risk factors—suggests that the “caregiver stress” model is not supported. There is no residual association between spousal cognitive status and a person’s own cognitive dysfunction for caregiver stress to explain, even if we did have data to measure it.
Our finding that being married to a person with MCI or dementia is associated with lower cognitive function coheres with previous research. One study found that spouse caregivers (N=54) performed significantly worse than control subjects (N=108) on tests of memory, processing speed, and executive function (de Vugt et al., 2006). Another study compared spouse caregivers of people with dementia (N=192) to spouse caregivers of people without dementia (N=1,063) (Dassel et al., 2017). The authors found that, compared with spouse non-dementia caregivers, spouse dementia caregivers had significantly worse decline in cognitive function during the two years prior to and two years following death of their spouse. Our study builds on this evidence by replicating the core finding in a different and larger sample.
However, our study did not replicate previous reports that spouses of people with dementia have elevated risk for incident dementia. A previous study examined whether individuals married to people with dementia (N=229) had higher dementia risk than individuals married to people without dementia (N=2,213) among 1,221 spouse pairs in rural Utah followed for a median of 3.3 years (Norton et al., 2010). The authors reported that caring for a spouse with dementia significantly increased risk of dementia for the index participant. It is possible that the discordant findings between the current study and the previous study is due to differences in the demographic characteristics of sample participants or in the measurement of dementia. Future research should attempt to replicate this finding in other samples to clarify the relationship between spousal cognitive status and dementia risk.
Our study had notable strengths. The ARIC cohort provides rich mid-life and late-life data for a large number of spouse pairs. Data collected across the life course allowed us to control for a rich set of potentially confounding mid-life risk factors, unlike previous studies (Dassel et al., 2017; de Vugt et al., 2006; Norton et al., 2010). Additionally, the ARIC cohort contains data on both global cognition and incident dementia, allowing us to estimate the relationship between spouse status and multiple relevant cognitive outcomes.
Despite these strengths, our study had several limitations. Because of the time span between Visit 1 and Visit 5 (our analytic baseline) in this study, there may have been selective attrition that threatens the generalizability of our results. Our results only pertain to individuals who survive dementia-free to late life. As shown in eTable 1 (online supplement), our analytic sample was healthier than the broader ARIC cohort at baseline. However, we note that the crude prevalence of MCI and dementia at ARIC Visit 5 was similar to that estimated from cross-sectional, nationally representative data (i.e., the Health and Retirement Study) collected at a similar time frame (Langa et al., 2017). An additional limitation is that ARIC did not collect data about spouse caregiving responsibilities, so we were unable to examine whether the relationship between spouse status and cognitive outcomes varied by level of caregiving responsibilities. Since ascertainment of cognitive status before Visit 5 was limited, we were not able to measure how long participants had been caring for a spouse with cognitive impairment, which may modify the association with cognitive outcomes. Also, ARIC was unable to identify people in homosexual marriages or those cohabiting without being legally married. Diversity in family types is increasing among Americans (Manning & Brown, 2011), and future research should consider whether these results are consistent among same-sex and cohabiting couples.
Conclusion
Individuals married to people with MCI or dementia exhibit lower cognitive functioning than those married to people with normal cognition. However, this relationship appears to be confounded by the prevalence of shared mid-life cognitive risk factors, especially education—not mediated by stress-related consequences of caregiving. Because of homogamy and intergenerational transmission of education, educational attainment levels tend to cluster within families. Individuals with some evidence of cognitive impairment and low educational attainment should be prioritized for dementia screening. Policies to promote education may have long-term beneficial impacts by reducing the societal burden of dementia.
Supplementary Material
References
- Alzheimer’s Association. (2021). 2021 Alzheimer’s disease facts and figures. Alzheimer’s & Dementia: The Journal of the Alzheimer’s Association, 17(3), 327–406. 10.1002/alz.12328 [DOI] [PubMed] [Google Scholar]
- Appiah D, Schreiner PJ, Selvin E, Demerath EW, & Pankow JS (2019). Spousal diabetes status as a risk factor for incident type 2 diabetes: A prospective cohort study and meta-analysis. Acta Diabetologica, 56(6), 619–629. 10.1007/s00592-019-01311-y [DOI] [PMC free article] [PubMed] [Google Scholar]
- Arbel I, Bingham KS, & Dawson DR (2019). A Scoping Review of Literature on Sex and Gender Differences Among Dementia Spousal Caregivers. The Gerontologist, 59(6), e802–e815. 10.1093/geront/gny177 [DOI] [PubMed] [Google Scholar]
- Baecke JA, Burema J, & Frijters JE (1982). A short questionnaire for the measurement of habitual physical activity in epidemiological studies. The American Journal of Clinical Nutrition, 36(5), 936–942. 10.1093/ajcn/36.5.936 [DOI] [PubMed] [Google Scholar]
- Brookmeyer R, Corrada MM, Curriero FC, & Kawas C (2002). Survival following a diagnosis of Alzheimer disease. Archives of Neurology, 59(11), 1764–1767. 10.1001/archneur.59.11.1764 [DOI] [PubMed] [Google Scholar]
- Brown J, & Chen S (2008). Help-Seeking Patterns of Older Spousal Caregivers of Older Adults with Dementia. Issues in Mental Health Nursing, 29(8), 839–852. 10.1080/01612840802182854 [DOI] [PubMed] [Google Scholar]
- Callahan CM, Unverzagt FW, Hui SL, Perkins AJ, & Hendrie HC (2002). Six-Item Screener to Identify Cognitive Impairment among Potential Subjects for Clinical Research. Medical Care, 40(9), 771–781. [DOI] [PubMed] [Google Scholar]
- Cobb LK, Godino JG, Selvin E, Kucharska-Newton A, Coresh J, & Koton S (2016). Spousal Influence on Physical Activity in Middle-Aged and Older Adults: The ARIC Study. American Journal of Epidemiology, 183(5), 444–451. 10.1093/aje/kwv104 [DOI] [PMC free article] [PubMed] [Google Scholar]
- Cobb LK, McAdams-DeMarco MA, Gudzune KA, Anderson CAM, Demerath E, Woodward M, Selvin E, & Coresh J (2016). Changes in Body Mass Index and Obesity Risk in Married Couples Over 25 Years: The ARIC Cohort Study. American Journal of Epidemiology, 183(5), 435–443. 10.1093/aje/kwv112 [DOI] [PMC free article] [PubMed] [Google Scholar]
- Dassel KB, & Carr DC (2016). Does Dementia Caregiving Accelerate Frailty? Findings From the Health and Retirement Study. The Gerontologist, 56(3), 444–450. 10.1093/geront/gnu078 [DOI] [PubMed] [Google Scholar]
- Dassel KB, Carr DC, & Vitaliano P (2017). Does Caring for a Spouse With Dementia Accelerate Cognitive Decline? Findings From the Health and Retirement Study. The Gerontologist, 57(2), 319–328. 10.1093/geront/gnv148 [DOI] [PubMed] [Google Scholar]
- de Vugt ME, Jolles J, van Osch L, Stevens F, Aalten P, Lousberg R, & Verhey FRJ (2006). Cognitive functioning in spousal caregivers of dementia patients: Findings from the prospective MAASBED study. Age and Ageing, 35(2), 160–166. 10.1093/ageing/afj044 [DOI] [PubMed] [Google Scholar]
- Di Castelnuovo A, Quacquaruccio G, Donati MB, de Gaetano G, & Iacoviello L (2009). Spousal Concordance for Major Coronary Risk Factors: A Systematic Review and Meta-Analysis. American Journal of Epidemiology, 169(1), 1–8. 10.1093/aje/kwn234 [DOI] [PubMed] [Google Scholar]
- Fonareva I, & Oken BS (2014). Physiological and functional consequences of caregiving for relatives with dementia. International Psychogeriatrics / IPA, 26(5), 725–747. 10.1017/S1041610214000039 [DOI] [PMC free article] [PubMed] [Google Scholar]
- Galvin JE, Roe CM, Powlishta KK, Coats MA, Muich SJ, Grant E, Miller JP, Storandt M, & Morris JC (2005). The AD8: A brief informant interview to detect dementia. Neurology, 65(4), 559–564. 10.1212/01.wnl.0000172958.95282.2a [DOI] [PubMed] [Google Scholar]
- Gibbons C, Creese J, Tran M, Brazil K, Chambers L, Weaver B, & Bédard M (2014). The Psychological and Health Consequences of Caring for a Spouse With Dementia: A Critical Comparison of Husbands and Wives. Journal of Women & Aging, 26(1), 3–21. 10.1080/08952841.2014.854571 [DOI] [PubMed] [Google Scholar]
- Gross AL, Power MC, Albert MS, Deal JA, Gottesman RF, Griswold M, Wruck LM, Mosley TH, Coresh J, Sharrett AR, & Bandeen-Roche K (2015). Application of latent variable methods to the study of cognitive decline when tests change over time. Epidemiology (Cambridge, Mass.), 26(6), 878–887. 10.1097/EDE.0000000000000379 [DOI] [PMC free article] [PubMed] [Google Scholar]
- Hox JJ, Moerbeek M, & van de Schoot R (2010). Multilevel analysis: Techniques and applications, second edition. Routledge. [Google Scholar]
- Knopman DS, Gottesman RF, Sharrett AR, Wruck LM, Windham BG, Coker L, Schneider ALC, Hengrui S, Alonso A, Coresh J, Albert MS, & Mosley TH (2016). Mild cognitive impairment and dementia prevalence: The Atherosclerosis Risk in Communities Neurocognitive Study. Alzheimer’s & Dementia: Diagnosis, Assessment & Disease Monitoring, 2(1), 1–11. 10.1016/j.dadm.2015.12.002 [DOI] [PMC free article] [PubMed] [Google Scholar]
- Langa KM, Larson EB, Crimmins EM, Faul JD, Levine DA, Kabeto MU, & Weir DR (2017). A Comparison of the Prevalence of Dementia in the United States in 2000 and 2012. JAMA Internal Medicine, 177(1), 51–58. 10.1001/jamainternmed.2016.6807 [DOI] [PMC free article] [PubMed] [Google Scholar]
- Livingston G, Huntley J, Sommerlad A, Ames D, Ballard C, Banerjee S, Brayne C, Burns A, Cohen-Mansfield J, Cooper C, Costafreda SG, Dias A, Fox N, Gitlin LN, Howard R, Kales HC, Kivimäki M, Larson EB, Ogunniyi A, … Mukadam N (2020). Dementia prevention, intervention, and care: 2020 report of the Lancet Commission. The Lancet, 396(10248), 413–446. 10.1016/S0140-6736(20)30367-6 [DOI] [PMC free article] [PubMed] [Google Scholar]
- Manning WD, & Brown SL (2011). The Demography of Unions Among Older Americans, 1980–Present: A Family Change Approach. In Settersten RA & Angel JL (Eds.), Handbook of Sociology of Aging (pp. 193–210). Springer. 10.1007/978-1-4419-7374-0_13 [DOI] [Google Scholar]
- McAdams DeMarco M, Coresh J, Woodward M, Butler KR, Kao WHL, Mosley TH, Hindin M, & Anderson CAM (2011). Hypertension status, treatment, and control among spousal pairs in a middle-aged adult cohort. American Journal of Epidemiology, 174(7), 790–796. 10.1093/aje/kwr167 [DOI] [PMC free article] [PubMed] [Google Scholar]
- Norton MC, Smith KR, Østbye T, Tschanz JT, Corcoran C, Schwartz S, Piercy KW, Rabins PV, Steffens DC, Skoog I, Breitner JCS, & Welsh-Bohmer KA (2010). Greater Risk of Dementia When Spouse Has Dementia? The Cache County Study. Journal of the American Geriatrics Society, 58(5), 895–900. 10.1111/j.1532-5415.2010.02806.x [DOI] [PMC free article] [PubMed] [Google Scholar]
- Ory MG, Hoffman RR III, Yee JL, Tennstedt S, & Schulz R (1999). Prevalence and Impact of Caregiving: A Detailed Comparison Between Dementia and Nondementia Caregivers. The Gerontologist, 39(2), 177–186. 10.1093/geront/39.2.177 [DOI] [PubMed] [Google Scholar]
- Roth DL, Dilworth-Anderson P, Huang J, Gross AL, & Gitlin LN (2015). Positive Aspects of Family Caregiving for Dementia: Differential Item Functioning by Race. The Journals of Gerontology: Series B, 70(6), 813–819. 10.1093/geronb/gbv034 [DOI] [PMC free article] [PubMed] [Google Scholar]
- Royston P, & White IR (2011). Multiple Imputation by Chained Equations (MICE): Implementation in Stata. Journal of Statistical Software, 045(i04). https://ideas.repec.org/a/jss/jstsof/v045i04.html [Google Scholar]
- Schneider ALC, Sharrett AR, Gottesman RF, Coresh J, Coker L, Wruck L, Selnes OA, Deal J, Knopman D, & Mosley 6, T. H. (2015). Normative Data for Eight Neuropsychological Tests in Older Blacks and Whites from the Atherosclerosis Risk in Communities (ARIC) Study. Alzheimer Disease and Associated Disorders, 29(1), 32–44. 10.1097/WAD.0000000000000042 [DOI] [PMC free article] [PubMed] [Google Scholar]
- Smits J (2003). Social closure among the higher educated: Trends in educational homogamy in 55 countries. Social Science Research, 32(2), 251–277. 10.1016/S0049-089X(02)00049-2 [DOI] [Google Scholar]
- Spearman C (1904). The Proof and Measurement of Association between Two Things. The American Journal of Psychology, 15(1), 72–101. 10.2307/1412159 [DOI] [PubMed] [Google Scholar]
- Välimäki TH, Martikainen JA, Hongisto K, Väätäinen S, Sintonen H, & Koivisto AM (2016). Impact of Alzheimer’s disease on the family caregiver’s long-term quality of life: Results from an ALSOVA follow-up study. Quality of Life Research: An International Journal of Quality of Life Aspects of Treatment, Care and Rehabilitation, 25(3), 687–697. 10.1007/s11136-015-1100-x [DOI] [PubMed] [Google Scholar]
- Vitaliano PP, Murphy M, Young HM, Echeverria D, & Borson S (2011). Does Caring for a Spouse with Dementia Promote Cognitive Decline? A Hypothesis and Proposed Mechanisms. Journal of the American Geriatrics Society, 59(5), 900–908. 10.1111/j.1532-5415.2011.03368.x [DOI] [PubMed] [Google Scholar]
- Wilson RS, Segawa E, Boyle PA, Anagnos SE, Hizel LP, & Bennett DA (2012). The natural history of cognitive decline in Alzheimer’s disease. Psychology and Aging, 27(4), 1008–1017. 10.1037/a0029857 [DOI] [PMC free article] [PubMed] [Google Scholar]
- Wu-Chung EL, Leal SL, Denny BT, Cheng SL, & Fagundes CP (2022). Spousal caregiving, widowhood, and cognition: A systematic review and a biopsychosocial framework for understanding the relationship between interpersonal losses and dementia risk in older adulthood. Neuroscience & Biobehavioral Reviews, 134, 104487. 10.1016/j.neubiorev.2021.12.010 [DOI] [PMC free article] [PubMed] [Google Scholar]
Associated Data
This section collects any data citations, data availability statements, or supplementary materials included in this article.