

Summary
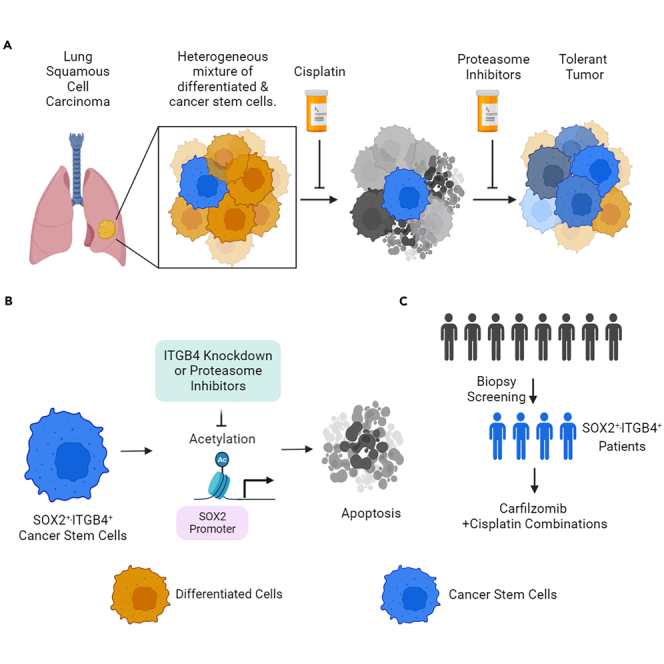
This study investigates the role of integrin β4 (ITGB4) and stemness-associated factor SOX2 in platinum resistance in lung squamous cell carcinoma (LUSC). The expression of SOX2 and ITGB4 is found to be high in all LUSC subtypes, but the impact of ITGB4 expression on overall patient survival varies by subtype. Cancer stem cells (CSCs) isolated from LUSC patients were found to be resistant to cisplatin, but knocking down ITGB4 or SOX2 sensitized them to cisplatin. Carfilzomib (CFZ) synergized with cisplatin and suppressed CSC growth by inhibiting ITGB4 and SOX2 expression. Additionally, CFZ was found to inhibit SOX2 expression epigenetically by inhibiting histone acetylation at the SOX2 promoter site. CFZ also suppressed the growth of SOX2-dependent small cell lung cancer cells in vitro and in vivo. The study highlights the unique function of CFZ as a transcriptional suppressor of SOX2, independent of its proteasome inhibitory function.
Subject areas: Molecular biology, Cell biology, Cancer, Transcriptomics
Graphical abstract
Highlights
-
•
Overexpression of SOX2 and ITGB4 contributes to cisplatin resistance in LUSC
-
•
Knocking down ITGB4 reduces SOX2, but silencing SOX2 has no effect on ITGB4
-
•
Carfilzomib suppresses SOX2 by inhibiting histone acetylation at SOX2 promoter
-
•
Carfilzomib is a promising therapeutic against SOX2-driven LUSC and SCLC
Molecular biology; Cell biology; Cancer; Transcriptomics.
Introduction
Non-small cell lung cancer (NSCLC) constitutes 85% of lung cancer and is a major contributor to the healthcare burden worldwide. Although several effective therapies are available and patients initially respond well to the treatment, in most cases they develop drug resistance. Conventionally, the development of drug resistance is thought to be genetic but emerging evidence suggests that non-genetic mechanisms, especially phenotypic plasticity, play an important role. Indeed, phenotypic plasticity is now recognized as one of the new hallmarks of cancer.1
Consistent with the propensity for plasticity, tumors having a higher percentage of cells capable of undergoing phenotypic transitions are more likely to be heterogeneous and have variable responses to stress.2 Epithelial to mesenchymal transition (EMT) in NSCLC is a classic example of phenotypic plasticity observed in cancer.3,4 However, there is significant variation in the degree of phenotypic plasticity, and a small fraction of the mesenchymal population harbors stem cell-like properties referred to as cancer-initiating cells or cancer stem cells (CSCs).5 CSCs are highly dynamic in nature and can adapt to the changing microenvironment easily to overcome drug toxicity, remain dormant, or invade different organs to create niches for the metastatic tumor to grow and flourish.6,7,8,9 Typically, the surface markers CD44 and CD133 are used to identify the CSC population in the tumor milieu.10,11 In addition, other relevant markers like SOX2, SOX4, SOX9, ALDH1A1, OCT4, and NANOG are also used in conjunction.12 Interestingly, SOX2, one of the key factors for pluripotency,13,14 was found to be highly amplified in 40% of the lung squamous cell carcinoma (LUSC) cases (C-Bio portal Pan-Cancer analysis, Figure 1A). Further, there is a correlation between longer overall survival for LUSC cases with high SOX2 amplification and expression versus low or no SOX2 expression.15 Thus, it remains elusive as to whether SOX2 drives the CSC phenotype in LUSC and whether these CSCs contribute to drug resistance.
Figure 1.

Increased SOX2 gene amplification and protein overexpression in LUSC
(A) Analysis conducted on the C-Bio portal Pan-Cancer Analysis revealed SOX2 gene amplification in 39.4% of LUSC.
(B) The GEPIA interactive software was used to determine the expression of stem cell markers SOX2, EPCAM, CD133, CD44, and ITGB4 in the LUSC TCGA dataset. The significant changes in expression between normal and tumor tissue were determined (∗p < 0.01).
(C and D) The gene expression analysis of SOX2 and ITGB4 was performed on different sub-histologies of LUSC within the TCGA dataset, utilizing the GEPIA interactive software. The analysis demonstrated a statistically significant association (∗p < 0.01).
(E) The overall survival of LUSC subtypes expressing median high or low levels of ITGB4 normalized to SOX2 expression was investigated. Except for the basal subtype, the overall survival was poor for all other subtypes.
(F) Immunofluorescence analysis was performed on a LUSC tumor microarray, demonstrating variations in the expression and spatial distribution of ITGB4 and SOX2. The SOX2 protein was represented by red fluorescence, ITGB4 by yellow fluorescence, and DAPI staining was used for blue visualization.
Unlike in lung adenocarcinoma (LUAD), the treatment options for irresectable LUSC are limited to chemotherapy, where carboplatin or cisplatin is given in combination with gemcitabine. Many platinum-treated patients experience therapeutic failure and tumor recurrence likely due to the presence of a higher percentage of CSCs.16 We previously showed that integrin β4 (ITGB4) and paxillin (PXN), key components of the focal adhesion complex, play a critical role in platinum resistance in LUAD. Thus, heterogeneous NSCLC cells that upregulate the expression of ITGB4 and PXN epigenetically can switch phenotypes from cisplatin sensitive to tolerant.17 Further, Bierie et al. (2017) reported that triple-negative breast cancer tumors harbor a CD44 and ITGB4 subpopulation of cells, and the cells that have low ITGB4/high CD44 expression exhibit mesenchymal phenotype compared to high ITGB4/high CD44-expressing cells that exhibited more epithelial-like properties.18 However, no studies comparing the co-expression of SOX2 and ITGB4 have been reported thus far, and the significance of ITGB4 expression in SOX2-driven CSCs in NSCLC remains unappreciated.
In the present study, we have used tumor tissue from LUSC patients to isolate the CSCs and elucidated the significance of ITGB4 and SOX2 expression in maintaining the stemness phenotype and resistance to cisplatin treatment. Furthermore, we identified the proteasome inhibitor CFZ to effectively inhibit SOX2 expression in LUSC cells which is independent of its proteasomal inhibitory function. Additionally, we also demonstrated the effect of CFZ in effectively suppressing SOX2/ITGB4 expression in neuroendocrine small cell lung cancer (SCLC) cells that are resistant to platinum.
Results
SOX2 and stem cell markers are upregulated in LUSC
We used the web-based Gene Expressing Profiling Interactive Analysis (GEPIA) server to compare the expression of stem cell markers (SOX2, CD133, CD44), integrin (ITGB4), and the epithelial cell marker (EPCAM) between tumor and normal tissues including LUSC TCGA dataset.19 Of all the markers, ITGB4 and SOX2 had significantly higher expression in tumor tissue (Figures 1B and S1A). Further, the expression of SOX2 and ITGB4 was also determined to be high across all LUSC subtypes, basal, classical, primitive, and secretory (Figures 1C and 1D),20 but the impact of ITGB4 expression on the overall survival of patients under these histologies was variable. Higher expression correlated with poor survival for the classical, primitive, and secretory subtypes, but no significant effect was seen on the basal subtype (Figure 1E). Further, we determined the spatial expression of SOX2 and ITGB4 in the formalin-fixed paraffin-embedded (FFPE) tumor tissue arrays generated from ten de-identified LUSC patients and found inter-patient heterogeneity in the expression of both the proteins (Figure S1B). The zoomed images from the region of interest (ROI) across four patient samples represented in Figure 1F highlighted the marked difference in the expression of these genes. For example, the tissue from sample 4 has high nuclear SOX2 and minimal ITGB4 expression, sample 3 has nuclear SOX2 and high membranous expression of ITGB4, sample 10 has high nuclear and cytoplasmic expression of SOX2 with variable ITGB4 expression, and sample 6 has minimal expression of SOX2 but high expression of ITGB4.
Generation of LUSC primary cell lines from patient-derived tumor tissue
To determine the significance of ITGB4 and SOX2 expression in stemness and response to chemotherapy, we isolated and enriched primary cells from two de-identified patient-derived tumor tissues (IRB 23297) and cultured them in a specialized medium without serum at 37°C under hypoxic condition (5% oxygen) (Figure 2A Schematic). The City of Hope (COH) 1 and COH2 cells were analyzed by flow cytometry for EPCAM, CD44, and CD133. More than 99% of cells were positive for EPCAM, and 97% of these positive cells were positive for the stemness marker CD44 but not positive for CD133. The cells were sorted for EPCAM and CD44, and the gating strategy used for the sorting is shown in the Figures 2B, S2A and S2B. RNA extracted from these cells was used to determine the expression of other stem cell markers using quantitative PCR (qPCR). COH2 had higher expression of SOX2 and ALDH1A1 compared to COH1 and normal lung cell line, BEAS2B, whereas EPCAM and ITGB4 expression was significantly higher in COH1 cells (Figure 2C). Immunoblotting analyses also validated that expression of ITGB4 in the COH2 cells was less compared to COH1 cells, whereas the SOX2 expression was significantly higher compared to both BEAS2B and COH1 (Figure 2D). Since the COH2 cells more closely resembled the expression criteria of CSCs, namely low ITGB4, and high SOX2, we used these cells for determining their spheroid formation potential. BEAS2B and COH2 cells were seeded separately at a density of 100 cells/well in a six-well ultra-low attachment plate and incubated in a specialized medium with 5% O2 (see STAR Methods). COH2 cells formed spheroids whereas the BEAS2B cells failed to do so, suggesting that COH2 cells have stem cell-like properties to form colonies under suspension conditions (Figure 2E).
Figure 2.

Patient-derived cells exhibited the stem cell-like phenotype
(A) Schematic representation illustrating the process of tumor tissue processing, isolation, and characterization of patient-derived primary cell lines.
(B) Flow cytometry analysis demonstrating the expression of cancer stem cell surface markers EPCAM, CD133, and CD44.
(C) Quantitative PCR analysis revealing the expression levels of stem cell markers, including SOX2, CD44, ALDH1A1, EPCAM, ITGB4, and PXN, in two primary patient-derived cell lines. Statistical significance was determined using ordinary one-way ANOVA (∗p < 0.05, ∗∗p < 0.001, ∗∗∗p = 0.0001, ∗∗∗∗p < 0.0001).
(D) Immunoblotting analysis showcasing variations in the expression of stem cell markers among the BEAS2B, COH1, and COH2 cell lines.
(E) Spheroid formation assay depicting the ability of COH2 cells to form spheroids in specialized media, while BEAS2B cells failed to form spheroids, indicating a stemness phenotype in COH2 cells.
(F and G) Cell viability assay was conducted on COH2 primary cells in both attached and spheroid conditions after a 3-day treatment with cisplatin. The results are presented as mean ± SD. Statistical analysis was performed using one-way ANOVA (∗∗p < 0.01).
(H) Western blot analysis was performed on COH2 cells following treatment with increasing concentrations of cisplatin for 3 days, revealing no significant changes in the expression of SOX2 or ITGB4.
COH2 cells are resistant to chemotherapy
The sorted primary COH2 cells were treated with increasing concentrations of cisplatin, and after 72 h of drug treatment, cell viability was determined using the Cell Counting Kit 8 (CCK8) assay for 2D cultures and titer glow for the 3D (spheroid) cultures. COH2 cells had approximately a 30% reduction in viability in response to 10 μM cisplatin in 2D and a 20% reduction in 3D (Figures 2F and 2G). The half maximal inhibitory concentration (IC50) value was calculated to be 19 μM in a 2D assay and 35 μM in a 3D assay suggesting the COH2 cells are resistant to cisplatin. We treated these cells with increasing concentrations of cisplatin, and changes in protein expression were determined by immunoblotting. The data showed no significant change in the expression of the stem cell markers SOX2, EPCAM, ALDH1A1, ITGB4, or PXN, which we previously observed to contribute to cisplatin resistance21 (Figure 2H). The outcomes confirm our hypothesis that cells with a higher proportion of CSC-like cells exhibit a poorer response to chemotherapy.
Subclonal response to chemotherapy
Next, we isolated subclones from these COH2 cells by serially diluting the cells and seeding at a density of 1 cell/100 μL of media in each well of a 96-well plate (Figure 3A). We generated 8 subclones from COH2 parental cells of which 4 clones grew attached to the plate in 2D and the remaining 4 clones grew as 3D spheroids (Figures 3B and 3C). SOX2 expression varied among the subclones compared to the parental population (Figures 3D and 3E). A cell viability assay done using 10 μM cisplatin showed no significant decrease in cell viability of any of the subclones (Figures 3F and 3G). Thus, ∼8% of the population (8 of 96 single cells) was able to survive and proliferate as cisplatin-resistant subclones. Further, no significant change in the protein expression of SOX2, EPCAM, ITGB4, PXN, or FAK was observed in subclone 1 treated with cisplatin for 72 h (Figure 3H) suggesting that subclone 1 is resistant to cisplatin and recapitulates the property of the parental cell. The short tandem repeat profiling was done to confirm the authentcicity of the parnetal mix cells and sublcones (Table S1).
Figure 3.

Subclones retain cisplatin-resistant phenotype, and ITGB4 knockdown sensitizes the primary cells to cisplatin
(A) Schematic representation illustrating the isolation of single clones from the primary patient-derived cell line.
(B and C) Representative images demonstrating the differential growth patterns of subclones derived from single cells.
(D and E) Immunoblotting analysis depicting the differences in the expression of SOX2 and ITGB4 in the subclones compared to the mixed parental cells.
(F and G) Cell viability assay (CCK8 assay) was conducted on subclones in both attached and spheroid conditions after a 3-day treatment with cisplatin. The subclones exhibited a resistant phenotype similar to parental cells. Results are presented as mean ± SD. Statistical significance was determined using one-way ANOVA (ns, not significant).
(H) Western blot analysis was performed after 3 days of cisplatin treatment on subclone 1, revealing no significant changes in the expression of SOX2 or ITGB4.
(I) Immunoblotting analysis conducted after 72 h of transfection with siRNA targeting SOX2, siRNA targeting ITGB4, or both, in COH2 cells. ITGB4 knockdown resulted in suppressed SOX2 expression. The numbers below each immunoblot represent the percentage difference in intensity compared to the control. The band intensity was normalized to actin and then compared to the control.
(J) The knockdown of ITGB4 or SOX2 in COH2 cells sensitized the cells to cisplatin. Statistical significance was determined using ordinary one-way ANOVA.
(K) Stable cell lines expressing ITGB4 shRNA were generated using COH2 cells. Immunoblotting confirmed ITGB4 knockdown and a reduction in SOX2 expression. The numbers below each immunoblot represent the percentage difference in intensity compared to the control.
(L) These stable cell lines expressing ITGB4 shRNA exhibited high sensitivity to cisplatin. The bar graph represents the mean ± SD. Statistical significance was determined using one-way ANOVA (∗∗∗p = 0.0001, ∗∗∗∗p < 0.0001).
Knocking down ITGB4 or SOX2 sensitizes COH2 cells to cisplatin
Next, we inhibited the expression of SOX2 and ITGB4 in COH2 cells and determined the knockdown effect on cisplatin resistance. Knocking down SOX2 or ITGB4 increased their sensitivity to cisplatin treatment (Figure 3J) and reduced their spheroid forming ability (Figures S3A and S3B). However, ITGB4 knockdown had a stronger effect because its inhibition also reduced the expression of SOX2 whereas the SOX2 knockdown inhibited the expression of PXN but had no effect on ITGB4 expression (Figure 3I). To validate the effect of ITGB4 expression on SOX2 we generated COH2 stable cell lines using either of the two short hairpin RNAs (shRNAs) against ITGB4 (Figure 3K). Immunoblotting confirmed the reduction in SOX2 expression upon ITGB4 knockdown (Figure 3K), whereas it has the opposite effect on ALDH1A1 and CD44 expression. Additionally, the cell lines with stable ITGB4 knockdown exhibited increased sensitivity to cisplatin treatment, as shown in Figure 3L. These findings imply that reducing ITGB4 levels impacts SOX2 expression and could serve as an upstream regulatory factor for SOX2. Moreover, the suppression of both genes may heighten the cells' susceptibility to cisplatin.
Knocking down ITGB4 attenuates SOX2 expression by inhibiting histone acetylation
We previously observed that the expression of the stemness marker SOX2 was influenced by ITGB4 while the expression of ALDH1 and CD44 remained unaffected. This raises the question of whether ITGB4 can regulate the expression of SOX2 in differentiated cell lines or just in primary cells. To investigate this further, we screened commercial LUSC cell lines for the regulation of SOX2 by ITGB4. Additionally, we selected SCLC cell lines as a negative control. SCLC embodies tumor cells that exhibit a neuroendocrine phenotype, and SOX2 is associated with this phenotype.22,23,24,25 We screened various SCLC cell lines for ITGB4 and SOX2 expression and identified SBC5 as the cell line that matches the criteria. Likewise, among LUSC cell lines, SOX2 was detected only in H520 cells with minimal expression of ITGB4 (Figure 4A). The cisplatin IC50 for H520 was calculated to be 6.2 μM, and for SBC5 it was 13.6 μM (Figure 4B). Immunoblotting analysis after cisplatin treatment on SBC5 and H520 cells showed no significant change in the expression of ITGB4 or SOX2, but the drug-induced toxicity caused an increase in expression of cleaved PARP and -γ-H2AX (Figure 4C).
Figure 4.

Inhibition of SOX2 expression by ITGB4 knockdown
(A) Western blot analysis revealing the expression levels of SOX2 and ITGB4 in different cell lines of LUSC and SCLC. H520 and SBC5 cell lines exhibit higher expression of SOX2 and lower expression of ITGB4.
(B) Cell viability assays were performed on H520 and SBC5 cells after 3 days of cisplatin treatment. The IC50 value indicates that SBC5 is resistant to cisplatin.
(C) Immunoblotting data showed no significant reduction in the expression patterns of SOX2 and ITGB4 after 3 days of cisplatin treatment.
(D and E) The knockdown of SOX2 sensitizes H520 and SBC5 cells to lower concentrations (2μM) of cisplatin. Results are presented as mean ± SD. Statistical significance was determined using one-way ANOVA (ns, not significant, ∗∗p < 0.001, ∗∗∗∗p < 0.0001).
(F) Immunoblots confirmed reduced expression of SOX2 in the H520 and SBC5 cells with no significant change in ITGB4 expression.
(G and H) H520 and SBC5 cells with ITGB4 knockdown exhibited sensitivity to cisplatin treatment at a lower concentration of 2μM. Results are presented as mean ± SD. Statistical significance was determined using one-way ANOVA (ns, not significant, ∗∗p < 0.001, ∗∗∗∗p < 0.0001).
(I) Immunoblots confirmed ITGB4 knockdown in both H520 and SBC5 cell lines in addition to reduced expression of SOX2 and YAP1. The percentage reduction compared to the control is quantified and mentioned below each immunoblot.
(J) Chromatin immunoprecipitation was performed using H3K27Ac and H3Kme4 antibodies on H520 control and ITGB4 knockdown cell lines. A significant reduction in histone acetylation was observed at the SOX2 promoter site. Results are presented as mean ± SD. Statistical significance was determined using one-way ANOVA (ns-not significant, ∗∗∗p = 0.0001).
H520 and SBC5 cells were used to generate stable cell lines expressing two different shRNAs against SOX2, and these cells were highly sensitive to cisplatin treatment even at the lowest dose of 2 μM (Figures 4D and 4E). The SOX2 knockdown was validated by immunoblotting, but no change in ITGB4 expression was observed (Figure 4F). Again, H520 and SBC5 cells were used to generate stable cell lines expressing shRNA against ITGB4. Both stable lines were sensitive to cisplatin (Figures 4G and 4H), and immunoblotting recapitulated the previous results; knocking down ITGB4 decreased the expression of SOX2 in both cell lines. In addition, we observed a decrease in YAP1 expression (Figure 4I).
In our previous study, we observed that histone acetylation at the promoter site of USP1 is inhibited upon ITGB4 and PXN knockdown.17 We used H520 cells stably transfected with shITGB4 to perform chromatin immunoprecipitation (ChIP) assay, using Histone 3 Lysine 27 acetylation and Histone 3-Methylation 4 antibodies. qPCR was done on the ChIP-DNA as described.26 The results showed reduced histone acetylation at the SOX2 promoter, whereas histone methylation remained unchanged (Figure 4J). Thus. ITGB4 knockdown may regulate SOX2 expression epigenetically by affecting the histone acetylation.
Proteasome inhibitors mediated inhibition of primary cell growth and drug synergy
Next, we screened several small-molecule inhibitors that could increase the sensitivity of COH2 cells to cisplatin and determined the respective IC50 values. Interestingly, the second generation proteasome inhibitors CFZ and ixazomib (IXA) had IC50 values of 43.4 nM and 72.5 nM, respectively, followed by dasatinib and pacritinib (IC50 < 500 nM). All other small molecules used in the screen had an IC50 >1μM (Table S2). The growth inhibition curves of COH2 induced by CFZ and IXA in 2D and 3D were determined, and for both the inhibitors, IC50 was calculated to be higher in 3D compared to 2D cultures (Figures 5A and 5B). Further, among the two inhibitors the CFZ was found to be effective at lesser concentration compared to IXA.
Figure 5.

Sensitivity of primary cell lines to proteasome inhibitors
(A) CCK8 assay performed on COH2 cells after 3 days of treatment with increasing concentrations of carfilzomib (CFZ) or ixazomib (IXA) in 2D culture.
(B) CCK8 assay conducted on COH2 cells treated with increasing concentrations of CFZ or IXA in 3D culture. Data are presented as mean ± SD (n = 3), and IC50 values were calculated using GraphPad Prism 9.0.
(C) Immunoblotting analysis of SOX2, ITGB4, ALDH1A1, EPCAM, and cytokeratin in COH2 cells after 3 days of CFZ and IXA treatment at their respective IC50 doses. The normalized changes in protein expression are indicated below each immunoblot. Treatment with the drugs resulted in reduced expression of SOX2 and ITGB4.
(D) CCK8 assay showing the significant inhibition of Clone 1 cell viability after 3 days of CFZ treatment. Mean ± SD shown, with statistical significance determined by one-way ANOVA (ns, not significant, ∗∗∗∗p < 0.0001).
(E) Immunoblot and densitometry analysis revealed reduced SOX2 expression following CFZ treatment at IC50 dose for 3 days.
(F) Evaluation of the inhibitory effect of the cisplatin and CFZ combination using synergy experiments. The average synergy score was calculated using Bliss analysis. A synergy score ≥10 indicates synergism.
(G) COH2 cells treated with the cisplatin and CFZ combination exhibited inhibition of CD44, EPCAM, SOX2, and ITGB4 expression, as shown by immunoblotting.
(H and I) CCK8 assay was performed on H520 and SBC5 cells after 3 days of CFZ or IXA treatment in 2D culture. Data are presented as mean ± SD (n = 3), and IC50 values were calculated for both inhibitors. CFZ demonstrated efficacy at lower doses. Analysis was performed using GraphPad Prism 9.0.
Next, we treated the COH2 cells with increasing concentrations of CFZ or IXA and determined the changes in the expression of SOX2, and other stem cell markers. Both the proteasome inhibitors suppressed the expression of SOX2, ALDH1A1, ITGB4, and FAK and induced the expression of the DNA damage indicator γ-H2AX. However, no change was observed in the expression of EPCAM, cytokeratin, and actin (Figure 5C). Likewise, subclone 1 derived from the COH2 cell mix was also treated with CFZ, and the results confirmed increased sensitivity to the drug at a nanomolar concentration (Figure 5D) and a concentration-dependent reduction in SOX2 and ITGB4 expression (Figure 5E). Thus, both the heterogeneous mixture of COH2 cells and subclones generated from single cells respond similarly to CFZ by reducing SOX2 and ITGB4 expression.
Finally, we determined the synergy between CFZ and cisplatin treatment in COH2 cells (Figure 5F). We used 8 concentrations of both the drugs and 49 different combinations, and the results suggest that 6.25 nM of CFZ has a synergistic inhibitory effect with 1.5, 3.1, and 6.25 μM of cisplatin. We also observed a significant drop in the expression of SOX2, ITGB4, EPCAM, CD44, and ALDH1A1 upon treatment of the COH2 cells with IC50 concentration of CFZ, or both CFZ and cisplatin (Figure 5G). Next, we also tested the sensitivity of H520 and SBC5 cells to CFZ and IXA using the CCK8 assay and found that these cells were susceptible to the proteasome inhibitors at a nanomolar concentration (Figures 5H and 5I). Together, these results suggest that CFZ or IXA can be used as small-molecule inhibitors against SOX2 and ITGB4-dependent platinum-refractory squamous cell carcinomas.
CFZ selectively inhibits SOX2-overexpressing cells
In primary cell lines, we observed heterogeneity in the growth pattern as well as cell morphology. To correlate the phenotypic heterogeneity with SOX2 expression, we performed immunofluorescence staining of SOX2. COH2 cells were seeded on iBIDI microchamber slides with a glass bottom. The adherent cells were treated with 40 or 80 nM of CFZ, and after 3 days of treatment, the cells were fixed using formaldehyde, followed by staining with an anti-SOX2 antibody. The fluorescent images (green) showed SOX2 localization in the nucleus but also revealed heterogeneity in the SOX2 expression within cells. The bigger cells showed a higher expression of SOX2, while cells with smaller cell sizes had a lower expression of SOX2 (Figure 6A, fluorescent images). Next, we also determined the changes in SOX2 expression by treating these cells with two different concentrations of CFZ (40 or 80 nM). Interestingly, CFZ preferably inhibited cells having the higher expression of SOX2 (Figure 6A, bar graph).
Figure 6.

CFZ reduced SOX2 expression by inhibiting promoter activity
(A) Immunofluorescent images of COH2 cells treated with 40 nM and 80 nM CFZ for 3 days, showing differential expression of SOX2 (Green) among cells. High SOX2-expressing cells are indicated by white arrows, and low SOX2-expressing cells are indicated by red arrows. Blue represents DAPI staining. Scale bar: 100 μm. Quantification of high SOX2 expression cell numbers using QuPath. Data presented as mean ± SD (n = 10), ∗∗p < 0.01 one-way ANOVA.
(B–D) Time course measurement of SOX2 mRNA expression in COH2, H520, and SBC5 cells after 6 h of CFZ treatment up to 24 h using qPCR.
(E) qPCR assay measuring changes in SOX2 mRNA expression in COH2, H520, and SBC5 cells after 6 h of CFZ or Act D treatment. Both drugs significantly reduced SOX2 expression.
(F and G) qPCR measurement of ALDH1A1, CD44, and EPCAM mRNA expression in COH2 and H520 cells after 6 h of CFZ or Act D treatment. No significant reduction was observed in these markers.
(H–J) COH2, H520, and SBC5 were transfected with p-GL3-SOX2 promoter expressing plasmid. A significant reduction in promoter activity was observed after treatment with ActD and CFZ (IC50 dose, 12 h, and 24 h), but not with cisplatin. Data represented as mean ± SD (n = 3).
(K) CFZ or IXA treatment significantly inhibits the binding of acetylated H3K27 at the SOX2 promoter site in COH2 cells, correlating with the reduction in its transcription.
(L) SOX2 chromatin immunoprecipitation (ChIP) reveals the binding of SOX2 at the promoter region of PXN and ITGB4.
Statistical significance was determined using one-way or two-way ANOVA, with p values as follows: ∗∗p < 0.01, ∗∗∗p < 0.001, ∗∗∗∗p < 0.0001, and NS (not significant).
CFZ inhibits SOX2 transcription
Although the results across three different cell types suggest CFZ inhibits the expression of SOX2, it was unclear whether decreased expression was due to a decrease in cell viability, increased SOX2 degradation, or reduced transcription. To address these questions, we treated COH2 cells with IC50 concentration of CFZ and harvested the cells at several time points from 6 to 24 h for RNA extraction, cDNA synthesis, and qPCR assay using TaqMan probes. The results suggested that in the presence of CFZ, a decrease in SOX2 expression mRNA could be seen as early as 6 h, and by 12 h, the expression was reduced by 80% (Figure 6B). To generalize the effect of CFZ we treated H520 and SBC5 cell lines with CFZ and observed reduction in SOX2 mRNA as early 6 h (Figures 6C and 6D). The overall data suggest that CFZ is inhibiting SOX2 expression at the transcriptional level.
The involvement of CFZ in transcriptional regulation was unique and had not been studied before. Therefore, we sought to compare the transcriptional inhibition of SOX2 induced by CFZ and another known transcriptional inhibitor, namely Actinomycin D (Act D). CFZ or Act D treatment of COH2 cells inhibited SOX2 expression by 90% within 6 h of treatment. Likewise, in H520, Act D inhibited expression by 93% and CFZ inhibited expression by 70% within 6 h whereas, in SBC5, the inhibition induced by either drug was ∼64% and 80%, respectively (Figure 6E). We also determined the changes in mRNA expression of other stem cells markers like ALDH1A1, EPCAM, or CD44 by qPCR and did not find any significant reduction in expression (Figures 6F and 6G). These data suggest that CFZ-mediated reduction in SOX2 expression is due to transcriptional inhibition but not due to increased degradation of SOX2.
CFZ inhibits SOX2 promoter activity by inhibiting H3K27 acetylation
To determine the mechanism of transcriptional regulation of SOX2 by CFZ, we used the luciferase-based promoter activity assay from ThermoFisher Scientific (Pierce and Firefly Luciferase Glow Assay). COH2, H520, and SBC5 cells were transfected with the PGL3-SOX2 using the Jet primer transfection reagent. After 24 h of transfection, the cells were harvested and seeded in a 96-well plate at a density of 50,000 cells/well. After 24 h of seeding, the cells were treated with Act D or CFZ, and the luciferase activity was measured at 12 h and 24 h post-treatment. The luciferase assay showed a significant reduction in promoter activity upon CFZ treatment across all the cell lines (Figures 6H–6J).
Next, we also performed the ChIP assay using the acetylated H3K27 antibody against the COH2 cells treated with cisplatin, CFZ, or IXA for 6 h. The cisplatin treatment did not induce any significant changes, whereas the CFZ- or IXA-treated cells had a significant reduction in the histone acetylation at the SOX2 promoter site (Figure 6K, cisplatin - blue bar, CFZ - red bar, and IXA - orange bar). Further, we also found that SOX2 binds to the promoter sites of ITGB4 and PXN, suggesting its role in regulating the expression of these genes (Figure 6L). Thus, these results reveal an unexplored role of CFZ in the transcriptional regulation of SOX2 epigenetically.
CFZ and actinomycin D act differently
CFZ-mediated inhibition of SOX2 expression within 6 h of treatment raised the possibility that its effect on transcriptional inhibition may not be limited to SOX2. To identify other genes inhibited by CFZ, we treated the COH2, H520, and SBC5 cells with CFZ for 6 h and extracted total RNA for performing RNA sequencing (RNA-seq) analysis. As a positive control, we also treated the cells with Act D for 6 h and extracted RNA for sequencing and analysis. The number of affected genes can vary for the same set of samples with different p value calculations (see “STAR Methods”), but there were consistently more downregulated genes than upregulated genes with almost all analysis strategies used (Figure S5, Supplemental Information, and Data S1). Using a multivariate model with 18 samples per comparison across cell lines (drug treatment and control, triplicates, adjust for differences between 3 cell lines), the changes in the gene expression concerning Act D or CFZ treatment are represented as a heatmap in Figure 7A. Using a single variable model with 6 samples per comparison for differential expression (drug treatment and control, triplicates, per cell line), the expression of ∼4,000 genes was suppressed in COH2 cells upon Act D treatment and ∼1,000 genes were suppressed upon CFZ treatment (Figure 7B). A similar pattern of gene expression changes was observed for the H520 and SBC5 cell lines (Figure 7B). Overall, the results suggest that proteasome inhibitor CFZ can also act at the transcriptional level.
Figure 7.

Differential regulation of gene expression by CFZ or SOX2
(A) Heatmap illustrating the differential gene expression changes in response to Act D or CFZ treatment.
(B) Volcano plot depicting the differentially expressed genes with a 2-fold change in expression and <0.05 false discovery rate (FDR). Significant changes were observed primarily in downregulated genes compared to upregulated genes.
(C) Venn diagram representing the overlap and uniqueness between the upregulated or downregulated genes within the cell line in response to Act D or CFZ treatment. 461 downregulated genes overlap between the treatment for the primary cells.
(D) Venn diagram representing the overlap and uniqueness between the down-regulated genes across all the cells in response to Act D or CFZ treatment. About 911 genes were found to overlap across all the cell lines in response to Act D treatment, and 171 genes overlapped for the CFZ treatment.
(E) The heatmap displays the significant downregulation of histone expression following CFZ treatment.
Next, we tested the number of overlapping genes regulated by both molecules. The analysis revealed that the number of overlapping genes that are upregulated is very low compared to overlapping genes that are downregulated (Figures 7C and S5). However, a significant number of genes remain unique for both treatments, again suggesting that both the molecules act on different gene targets. Further, we analyzed the changes in the gene expression across the three cell lines to identify the common targets of Act D and CFZ. 911 overlapping genes are suppressed by Act D, and 171 genes are suppressed by CFZ (Figure 7D). Since the significant changes were induced within 6 h of Act D or CFZ treatment, we discerned changes in histone expression. Indeed, we found a significant reduction in the histone expression across cell lines upon CFZ treatment, whereas they were high in the case of Act D treatment (n = 18, Figure 7E). Thus, the results suggest CFZ could regulate transcription, and the mechanism may be different from that of Act D.
CFZ treatment inhibits gene sets associated with DNA binding and transcription
We used RNA-seq data to determine the gene ontology (GO)-based enrichment analysis using the Enrichr platform. We selected genes that were downregulated by CFZ treatment for the GO term enrichment contributing to molecular functions (MFs). The gene sets contributing to MFs, like transcriptional regulation and DNA binding, were enriched in the COH2 cells (represented as red and green circles in Figure 8A). The gene sets contributing to glycosyltransferase were enriched across all the cell lines (Figures 8B and 8C). However, the MF that showed significant enrichment in the H520 and SBC5 cells was different from that of the COH2 cells (Figures 8B and 8C). The variation could be due to the difference in the cell types where COH2 was enriched for stem cell markers; and the H520 and SBC5 are a mix of heterogeneous cells. However, these results do not exclude the possibility that transcriptional regulation and DNA binding genes are affected in H520 and/or SBC5 (Supplemental Information and Data S1 and S2). There is a noticeable similarity between cell lines for the enriched genes, as shown in Figure S6. A subset of candidates with relatively greater COH2-specific differences is shown in Figure S7.
Figure 8.

Identifying differential expression of SOX2 regulated genes and validating cisplatin/CFZ synergy in vivo
(A–C) The downregulated gene list resulting from CFZ treatment was analyzed to identify enriched molecular functions (MF) in COH2, H520, and SBC5 cells. COH2 cells exhibited enriched MF associated with transcriptional regulation (red), DNA binding (green), and enzymatic activity (blue).
(D–F) The downregulated genes from differential gene expression analysis, along with chromatin immunoprecipitation data, were utilized to predict the functional status of transcription factors (TFs). The stemness-associated factors KLF4 and SOX2 were enriched in all three cell lines and predicted to be inactive after CFZ treatment. Additionally, COH2 cells displayed enrichment of multiple TFs associated with stemness, which were also predicted to be inactive.
(G) Screening 775 known targets across all cell lines revealed 16 overlapping genes in the three cell lines (Venn diagram). Heatmap analysis indicated significant downregulation of these genes upon CFZ treatment.
(H and I) Athymic nude (nu/nu) mice were implanted with H520 NSCLC cells and subsequently treated with cisplatin (5 mg/kg.b.w), CFZ (4 mg/kg.b.w), or their combination. Changes in tumor area (mm2) and weight (g) were measured. The combination treatment significantly affected tumor size and weight. Statistical significance was determined using one-way ANOVA (∗∗∗∗p < 0.0001).
(J and K) The data represent changes in tumor area and weight of SBC5-generated xenografts after treatment with CFZ and cisplatin. Statistical significance was determined using one-way ANOVA (∗∗∗∗p < 0.0001).
Next, we used downregulated genes from each cell line to determine the transcription factors (TFs) known to regulate their expression. Based on the combined score and adjusted p value of less than 0.05, we selected the TFs that enriched among downregulated genes (Figures 8D–8F). However, precise identification of TFs based on RNA-seq data can have some limitations (Figure S8, Data S1, and STAR Methods). Interestingly, the stemness-associated TFs (red circles) KLF4 and SOX2 were the common factors across all the cell lines. As expected, the COH2 cells had a majority of TFs contributing to stemness which correlates well with the phenotype of these cells. These cells were enriched for the stemness marker (CD44) since they were cultured in the serum-free media which supports stem cell growth. Next, we also analyzed the gene targets of SOX2 across the three cell lines using ChIP -X enrichment analysis (CHEA). There are 775 known targets of SOX2, and the targets that were significantly inhibited are represented in the Venn diagram shown in Figure 8G. Altogether, 16 genes overlapped across all the cell lines, and their expression is represented as a heatmap. This list includes genes such as PEG10, a well-known marker for neuroendocrine development, and FSCN, known for CSC maintenance. Thus, the analysis suggests that CFZ could suppress the expression of histones, TFs, and genes important in stemness.
CFZ and cisplatin combination is more effective in vivo than either drug alone
We used the H520 and SBC5 cell lines to generate cell line-derived xenografts in nude mice for in vivo studies. The animals were injected with 1 million cells of H520 or SBC5, and after palpable tumors were observed, the mice were randomly divided into 4 groups, each containing 5 mice. The animals were treated with corn oil, cisplatin 5 mg.kg.bw or CFZ 4 mg.kg.bw, or a combination of cisplatin 5 mg.kg.bw + CFZ 4 mg.kg.bw. The average weight gain among the 4 groups was measured throughout the experiment, and no significant changes in the body weight were observed, suggesting the drugs had no gross toxic effects. The changes in the tumor area were measured from the day drug treatment was started until the end of the study, 56 days later. The average tumor area of corn oil-treated H520 xenograft was determined to be 220 mm2 at the end of the study, whereas the area for both the single drug was 75 mm2, and the area for the combination was 50 mm2 (Figures 8H and S9). Thus, the data suggest there is a significant inhibitory effect of the combination compared to the single drug. Similarly, the tumor weight measured after 56 days also showed a significant reduction for the group treated with the drug combination compared to the single drug (Figure 8I). Likewise, a similar effect of the drug combination on the tumor area and weight was found in the xenografts generated using SBC5 cells (Figures 8J and 8K). These data indicated that the CFZ and cisplatin combination had a stronger inhibitory effect on the xenografts that are unresponsive to cisplatin alone.
Discussion
Cancer is a heterogeneous mixture of cells with CSCs representing a small fraction. The term CSCs was introduced by Sajiro Makino and represent cells in a de-differentiated state that possess the property to self-renew and generate the differentiated phenotype contributing to tumor growth.27,28 CSCs may arise due to mutations in stem cells or the progenitor cells during the development which help them to proliferate while maintaining the stemness properties and contribute to tumor growth by generating the differentiated cells. Alternatively, differentiated cells may acquire mutations or epigenetically induce the expression of stemness factors and reach a de-differentiated state resembling CSCs, or in other words, these cells switch their phenotype.29 Cellular reprogramming experiments14 wherein terminally differentiated cells (fibroblasts) were reprogrammed into pluripotent stem cells by overexpressing the four TFs SOX2, OCT3, KLF4, and c-MYC support the phenotypic switching hypothesis. Mikkelsen et al. performed a similar experiment, and their study suggests that overexpression of these four factors induces complete de-differentiation in approximately 1.2% of the cells that carry the properties of embryonic stem cells. However, a majority of the fraction (∼20%) showed a partial de-differentiation and remained in an intermediary state, expressing some of the phenotypes of stem cells.30,31 Thus, it can be interpreted that even though all the cells were engineered to express these factors, only some of them can undergo complete or partial de-differentiation. Further, it can be hypothesized that CSCs do not pre-exist but that any differentiated cell that undergoes genetic (mutation) or non-genetic changes including epigenetic changes leading to higher expression of these stemness-associated transcriptional factors could reprogram itself to have more stem cell-like properties which resonate well with the stochastic model of induced pluripotent cell generation.30
One of these factors, SOX2, is known to be amplified in LUSC, ovarian, and esophageal cancer suggesting a higher propensity of these tumors to have CSC-like populations. A salient feature of CSCs is to recreate the heterogeneity in the cell population and to evade drug therapy.29,32,33 In our previous study, we reported that cells sorted for low ITGB4 expression could recreate the heterogeneous population of cells having a low, high, or intermediate expression of ITGB4; however, the reverse was not true within the experimental timeline. Similarly, Bierie et al. reported that low ITGB4-expressing breast cancer cells can exhibit mesenchymal phenotype, whereas those with high expression exhibit epithelial-like properties.18 We also reported that NSCLC cells that have high ITGB4 and PXN expression could contribute to cisplatin resistance.17,21 These results encouraged us to explore the relationship between the ITGB4 expression and CSC-like cells in LUSC.
Here, we showed higher expression of ITGB4 across the classical, primitive, and secretory subtypes of LUSC and its correlation with poor survival. Further, we identified variability in the expression of ITGB4 and SOX2 across patient samples where some have high expression of both SOX2 and ITGB4 and others express either of the genes. We took a unique approach where, instead of using the cell lines, we used the leftover tumor tissues to isolate the primary cells from two de-identified patients (COH1 and COH2) and understand the role of ITGB4 in CSCs and cisplatin resistance. Interestingly these primary cells proliferated as spheroids and eventually attached to the surface and grew as 2D, and to our surprise, 99% of the COH1 and COH2 expressed the stem cell markers CD44 and EPCAM. We continued the study with COH2 as it showed a higher expression of SOX2, and we expected it to exhibit a more stemness like phenotype. Indeed, these cells were able to form spheroids in serum-free media under hypoxic conditions where the normal BEAS2B cells failed, and they were also resistant to cisplatin treatment. We performed serial dilution experiments to generate subclones from single cells, and only 8% of the cells were able to develop subclones. While some grew in 2D, some grew as spheroids. Moreover, all the subclones that expressed SOX2 could grow in serum-free media and were resistant to cisplatin. These results fit the property of CSCs in that they could recreate the entire population from a single cell while maintaining heterogeneity. However, the COH2 cells failed to develop tumors in the nude mice, and several factors, such as the lack of matrix proteins that could mimic the human microenvironment, may have contributed to this failure.
We also explored the role of ITGB4 in primary cells. ITGB4 knockdown using small interfering RNA (siRNA) or shRNA increased the sensitivity of the primary cells to cisplatin. But interestingly, the ITGB4 knockdown in primary cells suppressed the expression of SOX2. A similar result of SOX2 inhibition on knocking down ITGB4 was also obtained when the H520 squamous cell line harboring the SOX2 amplification was used. To further validate the correlation, we used the SBC5 SCLC cell line and found the same results. However, the knockdown of SOX2 in the H520 or SBC5 cell lines did not affect the ITGB4 expression but did increase the sensitivity to cisplatin. Further, we found that ITGB4 knockdown resulted in reduced H3K27 acetylation at the SOX2 promoter, and this epigenetic change may have contributed to the change in SOX2 expression. Thus, the results suggest that targeting ITGB4 in SOX2-expressing CSCs could suppress the SOX2 expression and sensitize the cells to cisplatin. In addition, it also suggests that primary cells having SOX2 and ITGB4 expression can have a different phenotype than those with only ITGB4 or SOX2, which needs to be elucidated in future studies.
Currently, there are no known small molecules that can be specifically used to target ITGB4. However, in our previous studies, we have shown that the proteasome inhibitor CFZ can effectively suppress the expression of both ITGB4 and PXN in LUAD.21 In this study, we tested several Food and Drug Administration (FDA)-approved drugs and proteasome inhibitors against primary cells and found that CFZ and IXA were effective at nanomolar concentrations. Specifically, CFZ treatment inhibited the expression of ITGB4 and SOX2, resulting in increased sensitivity to cisplatin. Within 6 h of treatment, CFZ successfully suppressed SOX2 expression, while other stemness-associated genes remained unaffected. Interestingly, the effect of CFZ was consistent in both SOX2-amplified squamous cells and neuroendocrine cell lines. Mechanistically, CFZ inhibited histone acetylation at the promoter site, ultimately leading to reduced SOX2 expression. This role of CFZ as a transcriptional suppressor of SOX2 has never been studied before.
An in-depth analysis of the RNA-seq data indicated that genes associated with molecular functions like transcription and DNA binding were significantly downregulated in COH2 cells by CFZ. Further, based on the differential gene expression data a Z score analysis was done to determine the functional state of TFs, which suggested that SOX2, NANOG, POU5F1, SALL4, and KLF4, were significantly inhibited in the COH2 cells. Among these TFs, SOX2 and KLF4 were also predicted to be low in the H520 and SBC5 cell lines. Through differential gene expression analysis, 16 overlapping targets of SOX2 were identified across the three cell lines, which are known to contribute to stemness and were notably suppressed by CFZ treatment. Moreover, in vivo, studies involving H520 and SBC5 cells suggested that a combination of CFZ and cisplatin could significantly inhibit tumors driven by SOX2 and ITGB4. These findings lead to the conclusion that CFZ could effectively suppress the expression of SOX2, thereby sensitizing cisplatin-resistant CSCs in multiple cancer types. Finally, the present study also suggests that cisplatin and CFZ can act synergistically to attenuate the switch to the aggressive and drug-resistant neuroendocrine phenotype in SCLC for which there are no medical options at present. The present study also supports the involvement of non-genetic mechanisms in cancer underscoring the genetic/non-genetic duality of drug resistance in cancer.34
Limitations of the study
CFZ treatment suppressed SOX2 expression and correlated with the histone acetylation marks at the SOX2 promoter site. However, a detailed understanding of the mechanism by which CFZ suppresses histone acetylation needs additional analysis.
STAR★Methods
Key resources table
| REAGENT or RESOURCE | SOURCE | IDENTIFIER |
|---|---|---|
| Antibodies | ||
| Polyclonal Integrin β4 Antibody | Cell signaling | Cat# 4707; RRID: AB_2129049 |
| Polyclonal FAK Antibody | Cell signaling | Cat# 3285; RRID: AB_2269034 |
| Monoclonal SOX2 Antibody | Cell signaling | Cat# 3579: RRID: AB_219567 |
| Monoclonal Cytokeratin −19 Antibody | Cell signaling | Cat# 13092: RRID: AB_2722626 |
| Polyclonal Phospho-Histone H2A.X (Ser139) | Cell signaling | Cat# 2577: RRID: AB_2118010 |
| Monoclonal CD133 Antibody | Cell signaling | Cat# 64326: RRID: AB_272112 |
| Mouse Monoclonal YAP (63.7) Antibody | Santa Cruz | Cat# sc-101199; RRID: AB_1131430 |
| Mouse Monoclonal EP-CAM (C10) Antibody | Santa Cruz | Cat# sc-25308: RRID: AB_62531 |
| Mouse Monoclonal GAPDH Antibody | Santa Cruz | Cat# sc-51907: RRID: AB_629537 |
| Mouse Monoclonal β-Actin Antibody | Sigma Aldrich | Cat# A5441; RRIB: AB_476744 |
| Polyclonal ALDH1A1 Antibody | Sigma Aldrich | Cat# HPA002123: RRID: AB_1844722 |
| Mouse Monoclonal Paxillin (5H11) Antibody | Invitrogen | Cat# AHO0492: RRID: AB_2536312 |
| Rat Monoclonal CD44 Antibody | Invitrogen | Cat# MA1-10225: RRID: AB_11154299 |
| CD44-APC | Biolegend | Cat# 338805; RRID: AB_1501202 |
| CD133-Alexa Flour 488 | Cell Signaling | Cat# 38725S; RRID: AB_2799139 |
| SOX2-Alexa Flour 488 | Invitrogen | Cat# 53-9811-82; RRID: AB_2574479 |
| EpCam-PE-Cy7 | Invitrogen | Cat# 25-9326-41; RRID: AB_2573541 |
| Mouse IgG1 kappa Isotype control, PE-Cy7 | invitrogen | Cat# 25-4714-80; RRID: AB_657914 |
| ITGB4 Alexa Flour 488 | Santa Cruz | Cat# SC13543; RRID: AB_626838 |
| DAPI mounting media | Thermofisher | Cat# P36941 |
| CD44-APC | Biolegend | Cat#338805; RRID: AB_1501202 |
| CD133-Alexa Flour 488 | Cell Signaling | Cat#38725S; RRID: AB_2799139 |
| ITGB4 | Cell Signaling | Cat#14803; RRID: AB_2798620 |
| Anti-Mouse Alexaflour 568 | Invitrogen | Cat#A-11004; RRID: AB_2534072 |
| Anti-Rabbit Alexaflour 647 | Invitrogen | Cat# A-3153; RRID: AB_2536183 |
| Goat Anti-Mouse IgG1 | Southernbiotech | Cat# 1070–05; RRID: AB_2650509 |
| Goat Anti-Mouse IgG2a | Southernbiotech | Cat# 1080–05; RRID: AB_2734756 |
| Goat Anti-Rabbit | Southernbiotech | Cat# 4030–05; RRID: AB_2687483 |
| Bacterial and virus strains | ||
| NEB® 5-alpha Competent E. coli (High Efficiency) | New England Biolabs | #C2987H |
| NEB®10-beta Competent E. coli | New England Biolabs | #C3019H |
| Biological samples | ||
| Lung squamous de-identified tumor tissue | City of Hope Biorepository | N/A |
| Chemicals, peptides, and recombinant proteins | ||
| Human FGF-10 | PeproTech | #100-26-25UG |
| Human R-Spondin-3 | PeproTech | #120-44-100UG |
| Human Noggin | PeproTech | #120-10C-50UG |
| Human Heregulinbeta-1 | PeproTech | #100-03-100UG |
| Human Noggin | PeproTech | #100-10c |
| Human FGF-10 | PeproTech | #100-26-50UG |
| Human Noggin | PeproTech | #120-10C-50UG |
| Y27632 | Selleckchem | #S1049 |
| N-Acetylcysteine | Sigma-Aldrich | #:A9165 |
| B27 supplement | Gibco | #:17504-44 |
| A8301 | TOCRIS | #:2939 |
| Nicotinamide | Sigma-Aldrich | #N0636 |
| Primocin | Invitrogen | #Ant-pm-1 |
| Carfilzomib | Selleckchem | #S2853 |
| Ixazomib | Selleckchem | #S2180 |
| Cisplatin | Selleckchem | #S1166 |
| Critical commercial assays | ||
| Live cell imaging assays | Sartorius | SX3- image analysis |
| Chromatin immunoprecipitation | Millipore Sigma | #17-10086 |
| Promoter luciferase assay | Thermofisher | #16176 |
| CCK8 assay | Dojindo | # CK04 |
| cell titer glow 3D assay | Promega | #G9681 |
| Deposited data | ||
| Processed data submitted | This Paper | GEO- GSE227899 |
| Experimental models: Cell lines | ||
| BEAS2B | BEAS2B | RRID: CVCL_0168 |
| H520 | H520 | RRID: CVCL_1566 |
| H2170 | H2170 | RRID: CVCL_1535 |
| HEK293 | HEK293 | RRID: CVCL_0045 |
| SBC5 | SBC5 | RRID: CVCL_1679 |
| Experimental models: Mouse models | ||
| Athymic Nude Mouse [Crl:NU(NCr)-Foxn1nu] | Charles River | NA |
| Oligonucleotides | ||
| small interfering RNA SOX2 | Origene | SR321861 |
| small interfering RNA ITGB4 | Origene | SR303473 |
| Short hairpin RNA SOX2 | Origene | TL309173 |
| Short hairpin RNA ITGB4 | Origene | TL312080 |
| Recombinant DNA | ||
| PGL3-SOX2 | Addegene | RRID: Addgene_101761 |
| Software and algorithms | ||
| STAR | Dobin et al. 201335 | https://github.com/alexdobin/STAR |
| htseq-count | Anders et al. 201536 | https://htseq.readthedocs.io/en/release_0.11.1/ |
| GenomicRanges | Lawrence et al. 201337 | Bioconductor package |
| edgeR-robust | Zhou et al. 201438 | Bioconductor package (edgeR) |
| DESeq2 | Love et al. 201439 | Bioconductor package |
| Goseq | Young et al. 201040 | Bioconductor package |
| Enrichr | Chen et al. 201341 | https://maayanlab.cloud/Enrichr/ |
| heatmap.3.R | GitHub code | https://github.com/obigriffith/biostar-tutorials/blob/master/Heatmaps/heatmap.3.R |
| Vennerable | GitHub code | https://github.com/js229/Vennerable |
| Other | ||
| ALDH1A1 | Thermofisher | Hs00946916_m1 |
| CD133 | Thermofisher | Hs01009259_m1 |
| CD44 | Thermofisher | Hs01075864_m1 |
| EPCAM | Thermofisher | Hs00901885_m1 |
| SOX2 | Thermofisher | Hs01053049_s1 |
| SOX4 | Thermofisher | Hs04987498_s1 |
| SOX9 | Thermofisher | Hs00165814_m1 |
| ITGB4 | Thermofisher | Hs00236216_m1 |
| PXN | Thermofisher | Hs01104424_m1 |
| YAP1 | Thermofisher | Hs00902712_g1 |
Resource availability
Lead contact
Further information and requests for resources and reagents should be directed to and will be fulfilled by the lead contact, Dr. Ravi Salgia (rsalgia@coh.org).
Materials availability
This study did not generate new unique reagents.
Experimental model and subject details
Patient-derived cell lines
The primary cell lines were established from surgically resected tumor tissue from de-identified patients who were diagnosed with LUSC at the City of Hope Cancer Research Hospital (IRB-23297). The tumor dissociation kit from Miltenyi Biotech (Cat #:130-095-929, SanJose, CA, USA) was used to homogenize the tissue and isolate the cells. After obtaining the single cells, RBC lysis buffer 10X (Biolegend, Cat #:420301, San Diego, CA, USA) was used in 1X condition to deplete the RBC according to the protocol. EasySep TM Dead Cell Removal (Annexin V) kit (Stemcell, Cat #:17899, Vancouver, BC, Canada) and EasySep TM CD45 Depletion kit II (Stemcell, Cat #:17898) were used to remove dead and immune cells. The isolated cells were cultured in customized media which contains the following components advanced DMEM/F12 (Invitrogen, Cat #:12634-034, Waltham, MA, USA) supplemented with R-spondin3 (R&D, Cat #:3500-RS/CF,Minneapolis,MA,USA) 250 ng/mL, Neuregulin1 (Peprotech, Cat #:100-03) 5 nM, FGF7 (Peprotech, Cat #:100-19) 5 ng/mL, FGF10 (Peprotech, Cat #:100-26) 5 ng/mL, EGF (Peprotech, Cat #:af-100-15) 5 ng/mL, Noggin (Peprotech, Cat #:120-10C) 100 ng/mL, A8301 (Tocris, Cat #:2939) 500 nM, Y27632 (Abmole, Cat #:Y27632, Houston, TX, USA) 5 nM, B27 supplement (Gibco, Cat #:17504-44) 1X, N-Acetylcysteine (Sigma-Aldrich, Cat #:A9165, St.Louis, MO, USA) 1.255 mM, Nicotinamide (Sigma-Aldrich, Cat #:N0636) 500 nM, GlutaMax (Invitrogen, Cat #:1263-034) 1X HEPES (Invitrogen, Cat #:15630-56) 10 mM, Primocin (Invitrogen, Cat #:Ant-pm-1) 50 μg/mL.42 Primary cells are cultured at 37°C, 5% O2, and 5% CO2. All in vitro experiments, including primary patient cells COH1, and COH2, were performed with cells that were within 15 passages. The STR profile of the primary cell lines was also matched with the tumor tissue before the in vitro experiments. The STR profile is provided in the Supplemental Table.
Cell line and reagents
Human epithelial Cell (BEAS2B), lung squamous carcinoma (H520, H2170), small cell lung cancer (SBC5, H69), and HEK293 cells were used in this study and were cultured in RPMI 1640 (Corning, Manassas, VA, USA) supplemented with 10% fetal bovine serum (R&D, Cat #: S11550H), 1% of L-glutamine (Corning, Cat #: 25-005-CI), penicillin/streptomycin (Corning, Cat #:30002312), sodium bicarbonate (Corning, Cat #:19718005) and sodium pyruvate (Corning, Cat #:32919014). The cells were cultured at 37°C, 20%O2, and 5% CO2 conditions. All cells were tested for mycoplasma using the PlasmoTestTM Mycoplasma Detection kit (InvivoGen, Cat #: rep-mys-50, San Diego, CA, USA). Cisplatin was purchased from Sigma-Aldrich (Cat #:1134357-100MG) and dissolved in H2O. Carfilzomib (CFZ) and Ixazomib (IXA) were purchased from Selleck Chemicals (Cat #: S2853 and Cat #: S2180, respectively, Houston, TX, USA) and were dissolved in DMSO (ATCC, Cat #: 67-68-5). ActD was purchased from Sigma-Aldrich (Cat #: A1410-5mg). DMSO was used as vehicle control.
Method details
Cell viability assay (CCK-8) and drug screening assay
Cells were seeded at a density of 5000 cells per well in 96 well plates (Cyto One, Cat #: CC7682-7596, Ocala, FL, USA) for cell viability assay or 2500 cells per well in 384 well plates (Thermo Fisher Scientific, Cat #: 164688, Waltham, MA, USA) for drug screening assay. Following overnight incubation, test compounds or vehicles are added at 2X concentration using an automated BioMEK NXP Pintool (Beckman Coulter, Indianapolis, IN, USA) and then incubated for 72 h. Cell viability was measured using CCK-8 assay, which is based on the principle of bioreduction of WST-8 to soluble formazan dye by live cells (Dojindo, Cat #: CK04, Rockville, MD, USA). Absorbance was recorded at 450 nm using a spectrophotometer (Tecan SPARK 10M, Hombrechtikon, Switzerland). The percentage change in viability was determined compared to the untreated cells, and a non-linear regression model with a sigmoidal dose-response by GraphPad Prism 9.0 was plotted. A minimum of three biological replicates were conducted, and the data generated was used to determine the half maximal (50%) inhibitory concentration (IC50) values for the primary cells as well as the cell lines.
Cell titer glows 3D assay
Primary patient-derived cells were harvested and seeded at a density of 2500 cells per well in 20 μL of conditioned media on the 384 well ultra-low attachment plate (Corning, Cat #: 4516) to form spheroids. Upon verification of spheroids after 24 h, drugs or vehicles were added as 2X concentration using an automated BioMEK NXP Pintool. Plates were incubated for an additional 72 h at the same condition. 40 μL of Cell Titer-Glo 3D (Promega Corp, Cat #: G9681, Madison, WI, USA) was added to the plate manually and put in an orbital shaker for 5 min at 300 rpm, following a 30 min incubation at room temperature, luminescence was quantified using TECAN plate reader. A minimum of three biological replicates were conducted, and the data generated was used to determine the half maximal (50%) inhibitory concentration (IC50) values for the primary cells as well as the cell lines.
Synergy assay
A synergy assay was performed to determine whether combining proteasome inhibitors and cisplatin could synergistically enhance the drug effect. The primary cells were seeded in 96 well plates and allowed to attach overnight. Once attached cells were treated with increasing concentrations of carfilzomib (0,3.125, 6.25, 12.5, 25, 50, 100, 200 (nM) of carfilzomib or cisplatin (1.25,3.125, 6.25, 12.5, 25, 50, 100 (μM) or combination of both carfilzomib and cisplatin for 72 h. The cell growth index was determined using CCK8, as described above. The resulting cell growth data generated from three biological replicates were used to calculate combination index (CI) values by using an R package called Synergy Finder.43 To calculate the synergetic effect, we use the Highest Single Agent,44 Loewe additivity,45 Bliss independence (Bliss, 1939), and Zero Interaction Potency.46 models to quantify the degree of drug synergy. The drug dose-response matrix was used to calculate individual CI values. The interaction between cisplatin and CFZ was considered antagonistic for Bliss scores of less than −10, additive effect for scores between −10 and 10, and synergistic for Bliss score larger than 10.
Quantitative real-time PCR
Total RNA was extracted from cells using Qiagen RNeasy Plus Mini Kit (Qiagen, Cat #: 74134), and then 0.5 μg of RNA was used for cDNA synthesis using qScript cDNA supermix (Quanta Bio, Cat #: 101414-106). The multiplex qPCR reactions were performed using the Quantstudio 7 via Taqman Universal PCR Master Mix (Thermo Fisher Scientific, Cat #: A444359) with TaqMan Probe (EPCAM, SOX2, ITGB4, CD44, PXN, ALDH1A1) according to the manufacturer’s instruction. Endogenous 18S RNA or Actin was used as housekeeping control. A list of used TaqMan Probe information was shown in key resources table.
Immunoblotting
Cells were collected and washed twice with ice-cold Dulbecco’s phosphate-buffered saline (DPBS), and whole cell lysate was generated on ice with 1X RIPA lysis (EMD Millipore, Cat #: 3432697, Burlington, MA, USA) supplemented with protease inhibitors and phosphatase inhibitors cocktail (ThermoFisher Scientific, Cat #: 1861281). Lysates were sonicated at 4°C followed by 15 min centrifugation at 13,000 rpm. The clear supernatant was harvested, and protein concentration was determined using the modified Bradford assay (Bio-Rad, Cat #: 5000113) and denatured in 1X reducing Laemmli buffer (Boston Bio Products, Cat #: H20M1, Milford, MA, USA) for SDS PAGE at 95°C for 5 min. Nitrocellulose membranes (Bio-Rad, Cat #: 1620115, Hercules, CA, USA) were used for protein transfer. Protein blots were blocked with 5% non-fat milk in TBS-T for 1 h and then probed with primary antibodies overnight in the cold room followed by secondary antibodies at room temperature for 2 h. A list of the antibodies used in this study is provided in key resources table. All antibodies were diluted with 2.5% bovine serum albumin (BSA)/Tris-buffered saline with Tween 20 (TBS-T).
Flow cytometry and fluorescence active cell sorting (FACS)
Cells were counted, and 1×10⁶ cells per sample were resuspended in 100 μL of staining buffer (1X PBS +2% FBS). Fluorescently labeled antibodies were used to stain the cells for 30 min on ice, and then antibodies were washed twice with 1X PBS. A list of used antibodies was shown as shown in key resources table. For flow cytometry Attune NxT (Thermo Fisher Scientific) was used, whereas cell sorting was done using BD FACS Aria Fusion Cell Sorter (BD Bioscience, San Jose, CA, USA). The gating strategy was provided in the supplemental information, and data were analyzed by FlowJo software 10.6.1.
Promotor luciferase reporter assay
COH2, H520, and SBC5 cells were seeded at a density of 3.0×10⁵ cells/well in 6 well plates and incubated overnight. PGL3-SOX2 promoter plasmid was purchased from Addgene (Cat #: 101761, Watertown, MA, USA). Transfection was performed with jetPrime (Polyplus, Cat #: 101000027, Graffenstaden, France) using 3 μg/well (COH2) and 4 μg/well (H520, SBC5) of plasmid DNA. After 12 h post transfection, the cells were harvested, counted, and seeded at a density of 2.0×10⁵ cells/well in a white 96-well assay plate (Corning, Cat #: 3917, New York, USA) and transparent 96-well plate. After cells adhered to the plate, ActD/CFZ/Cisplatin were added at IC50 concentration individually, or in combination and cultured for 12h/24h. The luciferase activity was measured using PierceTM Firefly luciferase Glow Assay Kit (ThermoFisher Scientific, Cat #: 16176), and cell viability was measured using CCK8. The luciferase activity and cell viability were correlated to determine the cages.
ITGB4, SOX2 knockdown, and stable cell line generation
The small interfering RNA oligonucleotides for SOX2, and ITGB4 were purchased from Origene (Cat #:SR321861, Cat #:SR302473CL). Cells (2×10⁵) were transfected with 20 nM of siRNA using jetPrime reagent (Polyplus), and 72 h of post transfection, the cells were harvested for western and qPCR analysis. Likewise, short hairpin RNAs (s) against human ITGB4, and SOX2 were purchased from Origene (Cat# TL309173 and Cat# TL312080). Cells (5×10⁵) were transfected with 4 μg transiently with jetPrime (Polyplus), and expression was determined using immunoblotting and qPCR analyses. Retroviral particles were prepared by GP293 cells. The viral supernatants were collected and incubated with the target cells for 72 h in the presence of polybrene. To generate stable clones, puromycin (1 μg/ml) was used to be selected for at least two weeks.
Immunofluorescence staining of tissues and cells
The formalin fixed paraffin embedded (FFPE) tumor tissue microarray was obtained from the City of Hope Pathology Core. The tissue was deparaffinized, and the antigen was retrieved using the pH 6.0 antigen retrieval buffer purchased from BIOCARE Medical (Cat# RV1000M, Reveal Decloaker) at high pressure and heat. The tissue section was blocked in 5% BSA and 0.3% Triton X- for 1h, followed by primary antibody incubation at 4°C overnight, using the anti-ITGB4 (Cat # 14803, Cell signaling Technology, USA) and anti-SOX2 antibodies (sc-365823, Santacruz Biotechnology, USA). Next, the tissues were incubated with anti-mouse (Goat anti-Mouse IgG (H + L) Cross-Adsorbed Secondary Antibody, Alexa Fluor 568), or anti-Rabbit (Donkey anti-Rabbit IgG (H + L) Highly Cross-Adsorbed Secondary Antibody, Alexa Fluor 647) secondary antibodies for 1h washed and mounted followed by imaging using the LSM 710 confocal microscope. The cells were seeded in the ibidi chamber slide (Cat #: 80826, Grafelfing, Germany) and treated with cisplatin or CFZ. After treatment, cells were fixed for 15min with 4% paraformaldehyde/DPBS, washed twice with PBS, and permeabilized using 0.2% Triton X-100/DPBS, and 1 h blocking was done using 5% BSA+0.2% Triton X-100 in DPBS. Cells were then incubated in the primary antibody at 4°C overnight, followed by washing and the secondary antibody incubation for 1 h at room temperature. A list of antibody and dilution ratios is shown in key resources table. The DAPI mounting media (Thermo Fisher Scientific, Cat #: P36941) was used for mounting, and images were obtained by confocal laser scanning microscopy (Zeiss LSM 880 with Airyscan). The analysis was done using QuPath software.
In vivo xenograft studies
Athymic nude nu/nu mice were obtained from Charles River, Wilmington, MA, and were allowed to acclimatize for a week before beginning the experiment. All animal experiments were carried out with the protocol approved by the Institutional Animal Care and Use Committee (IACUC # 16004). Twenty 8-week-old mice were divided into four groups of 5 animals (treatment with: i) corn oil i.e., vehicle control, ii) cisplatin 5 mg/kg b.w., iii) carfilzomib 4 mg/kg b.w., and iv) cisplatin + carfilzomib). All 20 animals were injected with 1 x 10⁶ H520 cell suspensions in 100 μL of PBS subcutaneously into one flank of each mouse. At the same time, animals were randomized into treatment groups. Treatment was started once the palpable tumor was visible, and treatments were given to mice via oral gavage twice a week for eight weeks. A similar protocol was followed for SBC5 xenografts studies. Animals were examined daily for signs of tumor growth. Tumors were measured in two dimensions using calipers, and body weights were recorded. Photographs of animals were taken on day 1, day 7, day 14, day 21, day 28, day 35, day 42, day 49, and day 56 after treatment. At the end of the study, the mice were euthanized by CO2 asphyxiation followed by cervical dislocation. The tumor weights were compared between groups using an unpaired Student’s t test. A portion of the tumor was fixed in 10% buffered formaldehyde solution and paraffin-embedded for immuno-staining or was snap-frozen in liquid nitrogen for molecular analysis.
Chromatin immunoprecipitation (ChIP)-PCR analysis
Chromatin immunoprecipitation was performed as described in.47 Briefly, cells were cross-linked with 2 mM EGS (Ethylene Gycol-bis (Succinimidylsuccinate)) in PBS followed by cross-linking with 1% (v/v) formaldehyde. 125 mM glycine was added to stop the cross-linking. Cells were lysed in RIPA buffer for 2 h at 4°C. Nuclear lysates were sonicated 5 min for 8 times in Diagenode bioruptor. Sonicated chromatin was precleared with Protein G Sepharose beads (GE Healthcare) which were pre-blocked with BSA and sonicated salmon sperm DNA (15632-011, Invitrogen). Samples were incubated with 2μg antibody (H3K27ac antibody (Diagenode Diagnostics, Cat #: C15410174), H3K4me3 antibody (Diagenode Diagnostics, Cat #: C15410002-50), and anti-RNA polymerase II (EMD Millipore, Cat #: 05-623B)) for overnight at 4°C followed by incubation with beads for additional 4 h. Immunoprecipitated beads were washed in wash buffer 1 (150 mM NaCl), followed by wash buffer 2 (500 mM NaCl) and wash buffer 3 (250 mM LiCl). After the washes, beads were incubated for 3 h at 55°C, then overnight at 65°C in TE buffer containing, SDS, RNase A, and Proteinase K. DNA was purified via Qiaquick PCR purification kit (28106, Qiagen. PCR was performed using Power SYBR Green PCR Master Mix. The percentage of input from the IPs was calculated by using 10% as the standard. qRT-PCR was done using primers designed for the promoter region of SOX2. The p sequence is used as follows: forward 5′-ACGACCGAAACCCTTACG-3′ and reverse 5′-CCAGCCACATCTCCCACTAGA-3’. The primer sequence used for the ITGB4 promoter are hITGB4_ChIP_FwD 5′- CATGGTGCTAGGTGCTAGAGAGTAGCTG-3′ and hITGB4_ChIP_Rev – 5′- AGTTTATCCTTCTTGTCCTTGAAGACGTTG- 3’. The primer seq for PXN promoter are hPXN_ChIP_FwD – 5′ CAGCCACCCTCCCTAGACAC -3′ and hPXN_ChIP_Rev- 5′- GAGCACTGGGTGTGACTTTCC-3’.
RNA sequencing and analysis
RNA was extracted from COH2, H520, and SBC5 cells that were treated with indicated concentrations of Act D and CFZ for 6 h. Reads were aligned against the human genome (hg38) using STAR,35 v2.5 with the parameters “--twopassMode Basic --outSAMstrandField intronMotif”). Read counts were quantified using htseq-count (v0.9.1, 42), with UCSC known gene annotations (TxDb.H sapiens. UCSC. hg38. Known Gene, downloaded 8/30/2018.48 Fold-change values were calculated from Fragments Per Kilobase per Million reads (FPKM, 49) normalized expression values, which were also used for visualization (following a log2 transformation). Aligned reads were counted using GenomicRanges.37 Before p value calculation, genes were filtered to only include transcripts with an FPKM expression level of 0.1 (after a rounded log2-transformation) in at least 50% of samples [6] as well as genes that are greater than 150 bp. p-values were calculated with either edgeR-robust50,38 or DESeq2,39 and false discovery rate (FDR) values were calculated using the method of Benjamini and Hochberg.51 These scripts are a modified version of a template for RNA-Seq gene expression analysis (https://github.com/cwarden45/RNAseq_templates/tree/master/TopHat_Workflow). Gene Ontology (GO) enrichment was calculated using goseq.52,40 Enrichr41,53 was used to calculate gene set enrichment for various CFZ down-regulated genes.
Differential expression method troubleshooting (main results)
Finding an appropriate method can become increasingly problematic as the number of comparisons increases (https://sourceforge.net/projects/rnaseq-deg-methodlimit/). In the interest of balancing transparency and an attempt to summarize overall observations with representative results, we summarize 2 methods for every comparison of treatments versus controls referenced in this manuscript: edgeR-robust and DESeq2 (Figure S4A). As an example, Actinomycin D is known to have a strong phenotypic effect, and the noticeably smaller list of candidate Actinomycin D affected genes in H520 could be questionable. So, after several iterations of analysis and discussion, we thought of using edgeR-robust with |fold-change| > 2 and FDR <0.05 for the separate n = 6 comparisons for each separate cell line and DESeq2 with |fold-change| > 1.2 and FDR <0.05 for the n = 18 comparisons (Figure S4B).
Critical assessment of non-overlapping genes from venn diagrams
As a rule, non-overlapping genes in a venn diagram (of separate edgeR-robust n = 6 cell line comparisons) are not necessarily significantly different and should not always be considered uniquely affected genes under one condition. However, the heatmaps for the separate DESeq2 n = 18 analysis is consistent with most differentially expressed genes showing different rather than common trends for ActD versus CFZ (Figure 7A).
As one possible measure to help identify marginally differential genes that are non-overlapping in separate comparisons, an additional DESeq2 comparison was run to directly compare ActD versus CFZ (Figure S5 and Data S2). Please note that most non-overlapping genes do not significantly vary.
Differential expression method troubleshooting (cell line ∗ treatment interactions)
Figure S6 shows that most genes identified as being enriched for relevant Gene Ontology (GO) Molecular Function (MF) terms for COH2 often also qualitatively show a similar trend in the other cells lines, and the overall difference (n = 18) is statistically significant for most genes with similar negative fold-change values across the three cell lines. We are not certain why the results ranked so much higher for COH2 if there were no drastic changes in the trends for other cell lines. However, this raises the question of the extent to which these effects truly are unique to COH2.
If the idea was to look for genes showing drug treatment effect was modified by the genetic background of the cell line, this could ideally be identified using interaction in the multivariate model. So, we tested this for DESeq2 (considering a gene differentially expressed if it had an average |fold-change| > 1.5 and FDR <0.05). If we look for genes that change as a function of the interaction of drug treatment and cell line, some genes appear to have some shift in H520 relative to the other two cell lines (Data S2). However, the existence of a treatment ∗ cell line interaction is not necessarily the same as saying that a gene is truly not affected by a treatment in each cell line.
For example, if we look for genes that are identified using a comparison with COH2 controls versus other controls, then we find additional genes that could fit a model where a shift in expression for the control affects the absolute level of expression with treatment (Data S2). In other words, even if the relative trends are usually similar across cell lines, the effect of down-regulation might be affected by the absolute level of the gene before drug treatment. While not used as a main result, these genes were identified by a two-step process. First, a threshold of 25% FPKM (rather than 50%) FPKM >0.1 was used to select genes to test, p values were calculated using DESeq2, and the initial set of genes were defined as differentially expressed if they showed |fold-change| > 1.5 and FDR <0.05. Second, without fold-change criteria, the same starting set of genes was tested using ANOVA and was identified to significantly vary if they showed an FDR <0.00001. Finally, the overlap of the DESeq2 and ANOVA gene lists was used to identify the candidates for genes with variable control expression. As expected, they largely do not overlap with the genes that vary with drug treatment, perhaps matching Figure 7A.
The full topic of drug treatment and cell line interactions is beyond the scope of this study. Nevertheless, these two strategies can provide statistical significance measures that can annotate, and separate candidates based on fold-change values in Figure S7.
Troubleshooting identification of robust SOX2 downstream targets
Characterizing SOX2 activity is very important for the current study. As described above, it is encouraging that SOX2 was recovered as an affected transcription factor for all 3 cell line comparisons with a signature provided by Enrichr that is based on ChIP -X enrichment analysis (CHEA) experiments. Difficulties were encountered when trying to define a signature with the maximal possible quantifications among the 775 “SOX2 CHEA” targets (Figure S8). So, we looked at the overlapping SOX2 targets between the 3 cell lines, as described in the main results.
While not used as the main result, ssGSEA (single sample Gene Set Enrichment Analysis,54) was run using GenePattern (run and downloaded on 9/2/2022), and the Bioconductor package version 1.42.0 was used for GSVA (Gene Set Variation Analysis,55).
Additional methods for figure creation
Heatmaps were usually created using heatmap.3.R (downloaded from https://github.com/obigriffith/biostar-tutorials/blob/master/Heatmaps/heatmap.3.R). For most heatmaps, log2(FPKM +0.1) expression was centered by cell line before standardization (setting the overall mean to 0 and standard deviation to 1, for each gene). For some heatmaps, a maximum absolute value to plot was set to enable better visualization of results. For Figure 7A, all cell line centered and standardized expression values above 2 were set to be equal to 2 and all cell line-centered and standardized expression values below −2 were set to be −2. For the fold-change heatmaps (Figure 7E, and the bottom of Figure S6), an absolute threshold of 4 was used instead of an absolute threshold of 2. No such additional thresholds for plotting were used for cell line centered and standardized expression in Figure 8G, the top heatmaps in Figure S6, or Figure S7. Vennerable (https://github.com/js229/Vennerable, version 3.1.0.9000) was used to generate Venn diagrams.
Quantification and statistical analysis
Statistical analysis
One-way ANOVA, non-linear regression, or simple T-test were performed to calculate the significance between datasets as indicated with each result or figure legend. A level of significance of p < 0.05 was chosen. Data are presented as mean with a standard deviation of the mean (±STD) in all figures in which error bars are shown. Graphs were generated using GraphPad Prism 7 software.
Additional resources
This study has not generated or contributed to a new website/forum and is not part of a clinical trial.
Acknowledgments
We acknowledge BioRender for the images represented in the graphical abstract, Figures 2 and 3.
Funding: Work in Dr. Sharad Singhal’s laboratory was funded by a DOD, USA grant W81XWH-22-1-0331. Work in Dr. Erminia Massarelli’s laboratory was funded by a DOD, USA grant W81XWH-22-1-0450.
Author contributions
Conceptualization- A.M., L.G, P.K., Y.Z., and R.S.; Methodology, Protocol Optimization, and Analysis - L.G., A. M., S Singhal, S Srivastava, A. Nam, M.V, S.V.S; Biorepository and Pathological Analysis – L.A., A.L.; Bioinformatic and Clinical informatic Analysis- C.W., Y.Y H.C., X.W., Investigation-L.G., A.M., S. Singhal., S. Srivastava., A. Nam.; Writing – Original Draft A.M., L.G., P.K., R.S.; Review & Editing- A.M., L.G., S.R., D.W., E.M., Y.Z., P.K., R.S.; Visualization- L.G A.M., S. Srivastava., S. Singhal., S.V.S., D.W., E.M.; Supervision- P.K., D.W., E.M., S.V.S., Y.Z., and R.S.; Funding Acquisition- S. Singhal., E.M and R.S.
Declaration of interests
The authors declare no potential conflicts of interest.
Published: July 10, 2023
Footnotes
Supplemental information can be found online at https://doi.org/10.1016/j.isci.2023.107302.
Contributor Information
Yiming Zeng, Email: ymzeng08@163.com.
Ravi Salgia, Email: rsalgia@coh.org.
Supplemental information
Data S1A – Differential Expression Statistics for Actinomycin D vs. Control (adjusting for cell line differences in a multivariate model, with DESeq2).
Data S1B – Differential Expression Statistics for Carfilzomib vs. Control (adjusting for cell line differences in a multivariate model, with DESeq2).
Data S1C – Differential Expression Statistics for Actinomycin D vs. Control in COH2 (with edgeR-robust).
Data S1D – Differential Expression Statistics for Carfilzomib vs. Control in COH2 (with edgeR-robust).
Data S1E – Differential Expression Statistics for Actinomycin D vs. Control in H520 (with edgeR-robust).
Data S1F – Differential Expression Statistics for Carfilzomib vs. Control in H520 (with edgeR-robust).
Data S1G – Differential Expression Statistics for Actinomycin D vs. Control in SBC5 (with edgeR-robust).
Data S1H – Differential Expression Statistics for Carfilzomib vs. Control in SBC5 (with edgeR-robust).
PartA-Main_Methods_Testing– Differential Expression Statistics for both DESeq2 and edgeR-robust for all comparisons described in Data S1 (where 1 representative list was selected per comparison).
PartB-Direct_ActD_vs_CFZ_Comparison – In part to avoid complications with marginally significant or non-significant genes, Carfilzomib (CFZ) and Actinomycin D were directly compared with DESeq2 (in a multivariate model that adjusts for cell line differences).
PartC-Treatment_Cell_Line_Interaction-CFZ – To provide a potential statistics for drug-gene interactions, DESeq2 was used to calculate a multivariate model that includes an interaction variable for Carfilzomib (CFZ). The interaction variable is the third variable in the model (that includes the CFZ treatment status as well as the cell line status).
Data and code availability
The RNA-seq data discussed in this publication have been deposited in NCBI’s Gene Expression Omnibus (Edgar et al., 2002) and are accessible through GEO Series accession number GSE227899 and a token number will be available from the lead contact upon request.
This paper does not report the original code.
References
- 1.Hanahan D. Hallmarks of Cancer: New Dimensions. Cancer Discov. 2022;12:31–46. doi: 10.1158/2159-8290.cd-21-1059. [DOI] [PubMed] [Google Scholar]
- 2.Brown M.S., Abdollahi B., Wilkins O.M., Lu H., Chakraborty P., Ognjenovic N.B., Muller K.E., Jolly M.K., Christensen B.C., Hassanpour S., Pattabiraman D.R. Phenotypic heterogeneity driven by plasticity of the intermediate EMT state governs disease progression and metastasis in breast cancer. Sci. Adv. 2022;8 doi: 10.1126/sciadv.abj8002. [DOI] [PMC free article] [PubMed] [Google Scholar]
- 3.Bhatia S., Wang P., Toh A., Thompson E.W. New Insights Into the Role of Phenotypic Plasticity and EMT in Driving Cancer Progression. Front. Mol. Biosci. 2020;7:71. doi: 10.3389/fmolb.2020.00071. [DOI] [PMC free article] [PubMed] [Google Scholar]
- 4.Tang Y., Durand S., Dalle S., Caramel J. EMT-Inducing Transcription Factors, Drivers of Melanoma Phenotype Switching, and Resistance to Treatment. Cancers. 2020;12 doi: 10.3390/cancers12082154. [DOI] [PMC free article] [PubMed] [Google Scholar]
- 5.Mani S.A., Guo W., Liao M.J., Eaton E.N., Ayyanan A., Zhou A.Y., Brooks M., Reinhard F., Zhang C.C., Shipitsin M., et al. The epithelial-mesenchymal transition generates cells with the properties of stem cells. Cell. 2008;133:704–715. doi: 10.1016/j.cell.2008.03.027. [DOI] [PMC free article] [PubMed] [Google Scholar]
- 6.Talukdar S., Bhoopathi P., Emdad L., Das S., Sarkar D., Fisher P.B. Dormancy and cancer stem cells: An enigma for cancer therapeutic targeting. Adv. Cancer Res. 2019;141:43–84. doi: 10.1016/bs.acr.2018.12.002. [DOI] [PubMed] [Google Scholar]
- 7.Najafi M., Mortezaee K., Majidpoor J. Cancer stem cell (CSC) resistance drivers. Life Sci. 2019;234 doi: 10.1016/j.lfs.2019.116781. [DOI] [PubMed] [Google Scholar]
- 8.Das P.K., Islam F., Lam A.K. The Roles of Cancer Stem Cells and Therapy Resistance in Colorectal Carcinoma. Cells. 2020;9 doi: 10.3390/cells9061392. [DOI] [PMC free article] [PubMed] [Google Scholar]
- 9.Yuan M., Huang L.-L., Chen J.-H., Wu J., Xu Q. The emerging treatment landscape of targeted therapy in non-small-cell lung cancer. Signal Transduct. Targeted Ther. 2019;4:61. doi: 10.1038/s41392-019-0099-9. [DOI] [PMC free article] [PubMed] [Google Scholar]
- 10.Najafi M., Farhood B., Mortezaee K. Cancer stem cells (CSCs) in cancer progression and therapy. J. Cell. Physiol. 2019;234:8381–8395. doi: 10.1002/jcp.27740. [DOI] [PubMed] [Google Scholar]
- 11.Tirino V., Camerlingo R., Franco R., Malanga D., La Rocca A., Viglietto G., Rocco G., Pirozzi G. The role of CD133 in the identification and characterization of tumour-initiating cells in non-small-cell lung cancer. Eur. J. Cardio. Thorac. Surg. 2009;36:446–453. doi: 10.1016/j.ejcts.2009.03.063. [DOI] [PubMed] [Google Scholar]
- 12.Zhao W., Li Y., Zhang X. Stemness-Related Markers in Cancer. Cancer Transl. Med. 2017;3:87–95. doi: 10.4103/ctm.ctm_69_16. [DOI] [PMC free article] [PubMed] [Google Scholar]
- 13.Yamanaka S. Pluripotency and nuclear reprogramming. Philos. Trans. R. Soc. Lond. B Biol. Sci. 2008;363:2079–2087. doi: 10.1098/rstb.2008.2261. [DOI] [PMC free article] [PubMed] [Google Scholar]
- 14.Takahashi K., Yamanaka S. Induction of pluripotent stem cells from mouse embryonic and adult fibroblast cultures by defined factors. Cell. 2006;126:663–676. doi: 10.1016/j.cell.2006.07.024. [DOI] [PubMed] [Google Scholar]
- 15.Wilbertz T., Wagner P., Petersen K., Stiedl A.C., Scheble V.J., Maier S., Reischl M., Mikut R., Altorki N.K., Moch H., et al. SOX2 gene amplification and protein overexpression are associated with better outcome in squamous cell lung cancer. Mod. Pathol. 2011;24:944–953. doi: 10.1038/modpathol.2011.49. [DOI] [PubMed] [Google Scholar]
- 16.Roodhart J.M.L., Daenen L.G.M., Stigter E.C.A., Prins H.J., Gerrits J., Houthuijzen J.M., Gerritsen M.G., Schipper H.S., Backer M.J.G., van Amersfoort M., et al. Mesenchymal stem cells induce resistance to chemotherapy through the release of platinum-induced fatty acids. Cancer Cell. 2011;20:370–383. doi: 10.1016/j.ccr.2011.08.010. [DOI] [PubMed] [Google Scholar]
- 17.Mohanty A., Nam A., Pozhitkov A., Yang L., Srivastava S., Nathan A., Wu X., Mambetsariev I., Nelson M., Subbalakshmi A.R., et al. A Non-genetic Mechanism Involving the Integrin β4/Paxillin Axis Contributes to Chemoresistance in Lung Cancer. iScience. 2020;23 doi: 10.1016/j.isci.2020.101496. [DOI] [PMC free article] [PubMed] [Google Scholar]
- 18.Bierie B., Pierce S.E., Kroeger C., Stover D.G., Pattabiraman D.R., Thiru P., Liu Donaher J., Reinhardt F., Chaffer C.L., Keckesova Z., Weinberg R.A. Integrin-β4 identifies cancer stem cell-enriched populations of partially mesenchymal carcinoma cells. Proc. Natl. Acad. Sci. USA. 2017;114 doi: 10.1073/pnas.1618298114. E2337–e2346. [DOI] [PMC free article] [PubMed] [Google Scholar]
- 19.Tang Z., Li C., Kang B., Gao G., Li C., Zhang Z. GEPIA: a web server for cancer and normal gene expression profiling and interactive analyses. Nucleic Acids Res. 2017;45 doi: 10.1093/nar/gkx247. W98–w102. [DOI] [PMC free article] [PubMed] [Google Scholar]
- 20.Wilkerson M.D., Yin X., Hoadley K.A., Liu Y., Hayward M.C., Cabanski C.R., Muldrew K., Miller C.R., Randell S.H., Socinski M.A., et al. Lung squamous cell carcinoma mRNA expression subtypes are reproducible, clinically important, and correspond to normal cell types. Clin. Cancer Res. 2010;16:4864–4875. doi: 10.1158/1078-0432.ccr-10-0199. [DOI] [PMC free article] [PubMed] [Google Scholar]
- 21.Mohanty A., Nam A., Pozhitkov A., Bhattacharya S., Yang L., Nathan A., Wu X., Srivastava S., Mambetsariev I., Nelson M., et al. A Non-genetic Mechanism for Chemoresistance in Lung Cancer: The Role of Integrin β4/Paxillin Axis. bioRxiv. 2019 doi: 10.1101/781807. [DOI] [Google Scholar]
- 22.Mu P., Zhang Z., Benelli M., Karthaus W.R., Hoover E., Chen C.C., Wongvipat J., Ku S.Y., Gao D., Cao Z., et al. SOX2 promotes lineage plasticity and antiandrogen resistance in TP53- and RB1-deficient prostate cancer. Science. 2017;355:84–88. doi: 10.1126/science.aah4307. [DOI] [PMC free article] [PubMed] [Google Scholar]
- 23.Metz E.P., Wilder P.J., Dong J., Datta K., Rizzino A. Elevating SOX2 in prostate tumor cells upregulates expression of neuroendocrine genes, but does not reduce the inhibitory effects of enzalutamide. J. Cell. Physiol. 2020;235:3731–3740. doi: 10.1002/jcp.29267. [DOI] [PMC free article] [PubMed] [Google Scholar]
- 24.Kwon O.J., Zhang L., Jia D., Xin L. Sox2 is necessary for androgen ablation-induced neuroendocrine differentiation from Pten null Sca-1(+) prostate luminal cells. Oncogene. 2021;40:203–214. doi: 10.1038/s41388-020-01526-2. [DOI] [PMC free article] [PubMed] [Google Scholar]
- 25.Voigt E., Wallenburg M., Wollenzien H., Thompson E., Kumar K., Feiner J., McNally M., Friesen H., Mukherjee M., Afeworki Y., Kareta M.S. Sox2 Is an Oncogenic Driver of Small-Cell Lung Cancer and Promotes the Classic Neuroendocrine Subtype. Mol. Cancer Res. 2021;19:2015–2025. doi: 10.1158/1541-7786.mcr-20-1006. [DOI] [PMC free article] [PubMed] [Google Scholar]
- 26.Chen X., Xie R., Gu P., Huang M., Han J., Dong W., Xie W., Wang B., He W., Zhong G., et al. Long Noncoding RNA LBCS Inhibits Self-Renewal and Chemoresistance of Bladder Cancer Stem Cells through Epigenetic Silencing of SOX2. Clin. Cancer Res. 2019;25:1389–1403. doi: 10.1158/1078-0432.ccr-18-1656. [DOI] [PubMed] [Google Scholar]
- 27.Hamburger A., Salmon S.E. Primary bioassay of human myeloma stem cells. J. Clin. Invest. 1977;60:846–854. doi: 10.1172/jci108839. [DOI] [PMC free article] [PubMed] [Google Scholar]
- 28.Hamburger A.W., Salmon S.E. Primary bioassay of human tumor stem cells. Science. 1977;197:461–463. doi: 10.1126/science.560061. [DOI] [PubMed] [Google Scholar]
- 29.Welte Y., Adjaye J., Lehrach H.R., Regenbrecht C.R. Cancer stem cells in solid tumors: elusive or illusive? Cell Commun. Signal. 2010;8:6. doi: 10.1186/1478-811x-8-6. [DOI] [PMC free article] [PubMed] [Google Scholar]
- 30.Mikkelsen T.S., Hanna J., Zhang X., Ku M., Wernig M., Schorderet P., Bernstein B.E., Jaenisch R., Lander E.S., Meissner A. Dissecting direct reprogramming through integrative genomic analysis. Nature. 2008;454:49–55. doi: 10.1038/nature07056. [DOI] [PMC free article] [PubMed] [Google Scholar]
- 31.Yamanaka S. Elite and stochastic models for induced pluripotent stem cell generation. Nature. 2009;460:49–52. doi: 10.1038/nature08180. [DOI] [PubMed] [Google Scholar]
- 32.Barbato L., Bocchetti M., Di Biase A., Regad T. Cancer Stem Cells and Targeting Strategies. Cells. 2019;8 doi: 10.3390/cells8080926. [DOI] [PMC free article] [PubMed] [Google Scholar]
- 33.Singh A., Settleman J. EMT, cancer stem cells and drug resistance: an emerging axis of evil in the war on cancer. Oncogene. 2010;29:4741–4751. doi: 10.1038/onc.2010.215. [DOI] [PMC free article] [PubMed] [Google Scholar]
- 34.Salgia R., Kulkarni P. The Genetic/Non-genetic Duality of Drug 'Resistance' in Cancer. Trends Cancer. 2018;4:110–118. doi: 10.1016/j.trecan.2018.01.001. [DOI] [PMC free article] [PubMed] [Google Scholar]
- 35.Dobin A., Davis C.A., Schlesinger F., Drenkow J., Zaleski C., Jha S., Batut P., Chaisson M., Gingeras T.R. STAR: ultrafast universal RNA-seq aligner. Bioinformatics. 2013;29:15–21. doi: 10.1093/bioinformatics/bts635. [DOI] [PMC free article] [PubMed] [Google Scholar]
- 36.Anders S., Pyl P.T., Huber W. HTSeq--a Python framework to work with high-throughput sequencing data. Bioinformatics. 2015;31:166–169. doi: 10.1093/bioinformatics/btu638. [DOI] [PMC free article] [PubMed] [Google Scholar]
- 37.Lawrence M., Huber W., Pagès H., Aboyoun P., Carlson M., Gentleman R., Morgan M.T., Carey V.J. Software for computing and annotating genomic ranges. PLoS Comput. Biol. 2013;9 doi: 10.1371/journal.pcbi.1003118. [DOI] [PMC free article] [PubMed] [Google Scholar]
- 38.Zhou X., Lindsay H., Robinson M.D. Robustly detecting differential expression in RNA sequencing data using observation weights. Nucleic Acids Res. 2014;42:e91. doi: 10.1093/nar/gku310. [DOI] [PMC free article] [PubMed] [Google Scholar]
- 39.Love M.I., Huber W., Anders S. Moderated estimation of fold change and dispersion for RNA-seq data with DESeq2. Genome Biol. 2014;15:550. doi: 10.1186/s13059-014-0550-8. [DOI] [PMC free article] [PubMed] [Google Scholar]
- 40.Young M.D., Wakefield M.J., Smyth G.K., Oshlack A. Gene ontology analysis for RNA-seq: accounting for selection bias. Genome Biol. 2010;11:R14. doi: 10.1186/gb-2010-11-2-r14. [DOI] [PMC free article] [PubMed] [Google Scholar]
- 41.Chen E.Y., Tan C.M., Kou Y., Duan Q., Wang Z., Meirelles G.V., Clark N.R., Ma'ayan A. Enrichr: interactive and collaborative HTML5 gene list enrichment analysis tool. BMC Bioinf. 2013;14:128. doi: 10.1186/1471-2105-14-128. [DOI] [PMC free article] [PubMed] [Google Scholar]
- 42.Sachs N., de Ligt J., Kopper O., Gogola E., Bounova G., Weeber F., Balgobind A.V., Wind K., Gracanin A., Begthel H., et al. A Living Biobank of Breast Cancer Organoids Captures Disease Heterogeneity. Cell. 2018;172:373–386.e10. doi: 10.1016/j.cell.2017.11.010. [DOI] [PubMed] [Google Scholar]
- 43.He L., Tang J., Andersson E.I., Timonen S., Koschmieder S., Wennerberg K., Mustjoki S., Aittokallio T. Patient-Customized Drug Combination Prediction and Testing for T-cell Prolymphocytic Leukemia Patients. Cancer Res. 2018;78:2407–2418. doi: 10.1158/0008-5472.can-17-3644. [DOI] [PubMed] [Google Scholar]
- 44.Berenbaum M.C. What is synergy? Pharmacol. Rev. 1989;41:93–141. [PubMed] [Google Scholar]
- 45.Loewe S. The problem of synergism and antagonism of combined drugs. Arzneimittelforschung. 1953;3:285–290. [PubMed] [Google Scholar]
- 46.Yadav B., Wennerberg K., Aittokallio T., Tang J. Searching for Drug Synergy in Complex Dose-Response Landscapes Using an Interaction Potency Model. Comput. Struct. Biotechnol. J. 2015;13:504–513. doi: 10.1016/j.csbj.2015.09.001. [DOI] [PMC free article] [PubMed] [Google Scholar]
- 47.Chen N., Golczer G., Ghose S., Lin B., Langenbucher A., Webb J., Bhanot H., Abt N.B., Lin D., Varvares M., et al. YAP1 maintains active chromatin state in head and neck squamous cell carcinomas that promotes tumorigenesis through cooperation with BRD4. Cell Rep. 2022;39 doi: 10.1016/j.celrep.2022.110970. [DOI] [PubMed] [Google Scholar]
- 48.Hsu F., Kent W.J., Clawson H., Kuhn R.M., Diekhans M., Haussler D. The UCSC Known Genes. Bioinformatics. 2006;22:1036–1046. doi: 10.1093/bioinformatics/btl048. [DOI] [PubMed] [Google Scholar]
- 49.Mortazavi A., Williams B.A., McCue K., Schaeffer L., Wold B. Mapping and quantifying mammalian transcriptomes by RNA-Seq. Nat. Methods. 2008;5:621–628. doi: 10.1038/nmeth.1226. [DOI] [PubMed] [Google Scholar]
- 50.McCarthy D.J., Chen Y., Smyth G.K. Differential expression analysis of multifactor RNA-Seq experiments with respect to biological variation. Nucleic Acids Res. 2012;40:4288–4297. doi: 10.1093/nar/gks042. [DOI] [PMC free article] [PubMed] [Google Scholar]
- 51.Benjamini Y., Hochberg Y. Controlling the False Discovery Rate: A Practical and Powerful Approach to Multiple Testing. J. Roy. Stat. Soc. B. 1995;57:289–300. doi: 10.1111/j.2517-6161.1995.tb02031.x. [DOI] [Google Scholar]
- 52.Ashburner M., Ball C.A., Blake J.A., Botstein D., Butler H., Cherry J.M., Davis A.P., Dolinski K., Dwight S.S., Eppig J.T., et al. Gene ontology: tool for the unification of biology. The Gene Ontology Consortium. Nat. Genet. 2000;25:25–29. doi: 10.1038/75556. [DOI] [PMC free article] [PubMed] [Google Scholar]
- 53.Kuleshov M.V., Jones M.R., Rouillard A.D., Fernandez N.F., Duan Q., Wang Z., Koplev S., Jenkins S.L., Jagodnik K.M., Lachmann A., et al. Enrichr: a comprehensive gene set enrichment analysis web server 2016 update. Nucleic Acids Res. 2016;44:W90–W97. doi: 10.1093/nar/gkw377. [DOI] [PMC free article] [PubMed] [Google Scholar]
- 54.Barbie D.A., Tamayo P., Boehm J.S., Kim S.Y., Moody S.E., Dunn I.F., Schinzel A.C., Sandy P., Meylan E., Scholl C., et al. Systematic RNA interference reveals that oncogenic KRAS-driven cancers require TBK1. Nature. 2009;462:108–112. doi: 10.1038/nature08460. [DOI] [PMC free article] [PubMed] [Google Scholar]
- 55.Hänzelmann S., Castelo R., Guinney J. GSVA: gene set variation analysis for microarray and RNA-Seq data. BMC Bioinf. 2013;14:7. doi: 10.1186/1471-2105-14-7. [DOI] [PMC free article] [PubMed] [Google Scholar]
Associated Data
This section collects any data citations, data availability statements, or supplementary materials included in this article.
Supplementary Materials
Data S1A – Differential Expression Statistics for Actinomycin D vs. Control (adjusting for cell line differences in a multivariate model, with DESeq2).
Data S1B – Differential Expression Statistics for Carfilzomib vs. Control (adjusting for cell line differences in a multivariate model, with DESeq2).
Data S1C – Differential Expression Statistics for Actinomycin D vs. Control in COH2 (with edgeR-robust).
Data S1D – Differential Expression Statistics for Carfilzomib vs. Control in COH2 (with edgeR-robust).
Data S1E – Differential Expression Statistics for Actinomycin D vs. Control in H520 (with edgeR-robust).
Data S1F – Differential Expression Statistics for Carfilzomib vs. Control in H520 (with edgeR-robust).
Data S1G – Differential Expression Statistics for Actinomycin D vs. Control in SBC5 (with edgeR-robust).
Data S1H – Differential Expression Statistics for Carfilzomib vs. Control in SBC5 (with edgeR-robust).
PartA-Main_Methods_Testing– Differential Expression Statistics for both DESeq2 and edgeR-robust for all comparisons described in Data S1 (where 1 representative list was selected per comparison).
PartB-Direct_ActD_vs_CFZ_Comparison – In part to avoid complications with marginally significant or non-significant genes, Carfilzomib (CFZ) and Actinomycin D were directly compared with DESeq2 (in a multivariate model that adjusts for cell line differences).
PartC-Treatment_Cell_Line_Interaction-CFZ – To provide a potential statistics for drug-gene interactions, DESeq2 was used to calculate a multivariate model that includes an interaction variable for Carfilzomib (CFZ). The interaction variable is the third variable in the model (that includes the CFZ treatment status as well as the cell line status).
Data Availability Statement
The RNA-seq data discussed in this publication have been deposited in NCBI’s Gene Expression Omnibus (Edgar et al., 2002) and are accessible through GEO Series accession number GSE227899 and a token number will be available from the lead contact upon request.
This paper does not report the original code.