

Abstract
Landfill gas (LFG) wellhead data were compared to understand the range of observations due to unique conditions at five elevated temperature landfills (ETLFs) in the U.S. Correlations of the primary gas ratio, CH4:CO2, show distinct compositional indicators for (1) typical operation, (2) subsurface exothermic reactions (SERs), (3) high moisture content, and (4) air intrusion that can help operators and regulators diagnose conditions across gas extraction wells. ETLFs A, B, D, and E showed similar trends, such as decreasing CH4 and increasing CO2, CO, and H2 that have been previously described. ETLF C uniquely exhibited elevated CH4 and temperatures simultaneously due to carbonation (i.e., CO2 consumption) of a steel slag which was used as alternative daily cover (ADC). At the maximum gas well temperature, T = 82 °C/180 °F, CH4 and CO2 concentrations were 47% and 28%, respectively. At ETLFs A, B, and E, H2 > 50% were regularly observed in affected gas wells for several years. At the five ETLFs, maximum CO concentrations ranged from 1400–16,000 ppmv. Like the analysis of CH4:CO2, it is hypothesized here that H2 (%):CO (ppmv) may infer the types of waste that are thermally degrading. Co-disposal of industrial wastes and MSW and the use of potentially reactive ADCs should remain an important consideration for landfill operators and regulators because of their potential long-term impacts to LFG quality.
Keywords: Elevated temperature landfill, Subsurface exothermic events, Landfill gas, Hydrogen, Carbon monoxide
1. Introduction
Over the previous decade, subsurface exothermic reactions (SERs) in landfills have been documented across the United States (Calder & Stark, 2010; Jafari et al., 2017a; Jafari et al., 2017b; Reinhart et al., 2020). These reactions caused destruction of landfill gas (LFG) control equipment and often required significant financial and labor investments by the operators to mitigate and manage gas and liquid emissions. Elevated temperature landfills (ETLFs) are characterized by SERs that impact an area of a municipal solid waste (MSW) landfill. ETLFs are different from MSW landfills that experience a surface or near-surface fire (oxidative combustion or smoldering event) in that the reactions are anaerobic and occur deep within moisture-saturated waste (Benson, 2017; Calder & Stark, 2010; Jafari et al., 2017b; Stark & Jafari, 2017). SERs cause declines in biological activity and methane (CH4) production and simultaneous chemical production of carbon dioxide (CO2), carbon monoxide (CO), and hydrogen (H2) gases (De la Cruz et al., 2021; Jafari et al., 2017a; Schupp et al., 2020). Because of this, the corrective actions to manage ETLFs are different from typical fires.
Strongly exothermic reactions such as hydrolysis, hydration, carbonation, or corrosion reactions of dross, slag, ash, and unoxidized metals, have been proposed to explain development of SERs (Calder & Stark, 2010; Huang et al., 2014; Huang & Tolaymat, 2019; Jafari et al., 2014; Mahinroosta & Allahverdi, 2018; Martin et al., 2013; Narode et al., 2021; Stark et al., 2012). Potentially reactive wastes disposed of or used as alternative daily cover (ADC) could catalyze thermal MSW degradation (Hao et al., 2020; Hao et al., 2017; Jafari et al., 2017a). This degradation could lead to a range of observed LFG characteristics which reflect the specific reactive material and site conditions.
In order to properly diagnose subsurface conditions, it is necessary to recognize and understand the symptoms of these events. Several factors are known to influence LFG composition and familiarity with these factors are necessary to identify possible or probable causes. Air intrusion is often associated with decline in the primary gas ratio (CH4:CO2), an increase in O2 and N2, and prolonged aerobic activity can lead to increased gas temperatures and near-surface fires (Fathinezhad et al., 2022; Powell et al., 2006). Saturated or near-saturated conditions in and around gas extraction wells can both impede collection and affect LFG quality (Vigneault et al., 2004). Whereas CO2 is readily soluble in water/leachate, CH4 is relatively insoluble and so higher concentration in LFG suggest saturated conditions. Heat also impacts LFG quality. As temperatures increase beyond 55 °C, methane content declines because methanogenic activity decreases (Schupp et al., 2020). Beyond 70 °C, few methanogens survive and chemical reactions that generate CO2 dominate. A conceptual sketch of these different circumstances and their relation to CH4 and CO2 concentrations in LFG is presented in Fig. 1.
Fig. 1.

Conceptual sketch showing the influence of air, liquid, and temperature on CH4:CO2. LFG composition cannot exceed 100% for any combination of CH4 and CO2 (blue-shaded area).
Communications between the U.S. Environmental Protection Agency (US EPA) and state agencies have determined that elevated temperatures due to SERs are more common than previously understood. Many of the more severe effects such as differential settlement and slope failure are not commonly observed. However, unusual gas composition, odors, and increased leachate production have been frequently reported and many landfills have areas or cells that continue to be impacted for decades. In this analysis, LFG data were reviewed from five ETLFs across the U.S. which have not been previously reported. Reinhart et al. (2020) reviewed data from dozens of active landfills in Florida where co-disposal of unburned MSW and incinerator ash is common. While Martin et al. (2013), Jafari et al. (2017a), and Jafari et al. (2017b) each reviewed case study ETLFs, this analysis benefits from the duration of monitoring which in some cases, spanned more than a decade of monthly measurements at impacted and unimpacted gas extraction wells. Additionally, the review of five sites allowed for the comparison of parameter values that have been observed due to what are likely different waste/chemical interactions. While it would be preferable to perform measurements and analyses from dedicated surveillance boreholes or samples collected at depth, the installation of these conduits have been limited to facilities that had specific imperatives to prevent reaction migration. Thus, evaluations and critical analyses of wellhead temperature and LFG composition are useful for academics, operators, and regulators to thoroughly understand the unique observed characteristics of ETLFs.
2. Methods and materials
2.1. Site narratives
The ETLFs analyzed here are all active, solid waste landfills (Code of Federal Regulations, 1991). The facilities accepted primarily MSW but also some quantity of construction and demolition debris (CDD), and other non-hazardous, industrial wastes. Summaries of the ETLFs are in Table 1 and summaries of LFG observations are in Table S1. Some information has been shielded or generalized to maintain facility anonymity.
Table 1.
Summary of ETLFs and LFG data analyzed.
| ETLF ID | Year SER began | Surface area (hectare)a | Maximum depth (m)a | Data span (years)b | Unique well or measurement locations (count)c | Unique measurements (count)d |
|---|---|---|---|---|---|---|
|
| ||||||
| A | 2014 | 109 | 52 | 15 | 229 | 5276 |
| B | 2015 | 163 | 37 | 9 | 36 | 3538 |
| C | 2010 | 41 | 75 | 10 | 73 | 2134 |
| D | 2009 | 127 | 65 | 5 | 150 | 7162 |
| E | 2010 | 104 | 67 | 7 | 67 | 301 |
As reported to 2020 Greenhouse Gas Reporting Program.
Data include any measurement for a given year and do not necessarily include continuous measurements.
Re-drilled wells in a similar location as an abandoned well (e.g., EW1 and EW1R) are counted as two.
Not all LFG composition data were recorded at each measurement, thus not all evaluations will be represented by this value.
ETLF A has been in operation since the 1970 s and reported that it accepted small quantities of aluminum manufacturing wastes in the early 2000 s. From 2006 to 2019 the maximum gas well temperatures increased from 58 to 94 °C/136–204 °F. Significant H2 generation has been exhibited at the site (>70% H2). A portion of the landfill has been covered with an exposed geomembrane liner to ensure efficient gas collection of the impacted area. The landfill operator diverted high-concentration H2 LFG to separate, newly installed flares for treatment as it was not suitable for delivery to the gas-to-energy facility. The facility is currently under enhanced monitoring and reporting requirements.
ETLF B has accepted waste since the 1960 s and operates approximately 200 gas extraction wells. The operator accepted small quantities of aluminum production wastes in the early 2000 s. From 2012 to 2017, the maximum gas temperature increased from 59 to 88 °C/139–190 °F requiring multiple higher operating value (HOV) variances for temperature from the state regulatory agency. Laboratory analyses identified the presence of CO and H2 along with declining CH4. The facility is currently under enhanced monitoring and reporting requirements.
ETLF C began accepting waste in 1997 and currently operates approximately 100 gas extraction wells. In the early 2000s, the operator sought and received approval to utilize a steel slag as an ADC and has continued to do so, for >12 years. In 2010, ETLF C began accepting waste, the landfill reported elevated temperatures to the regulatory agency. These temperatures were not accompanied by decreases in methane production, carbon monoxide, or symptoms of fires such as smoke. The regulatory agency provided HOV variances to allow the landfill to continue operation of the impacted gas wells. Over time, the number of gas wells impacted by elevated temperatures expanded, and extraction wells collapsed or failed and required re-drilling. In some gas wells, LFG contained as much as 96.7% CH4. Elevated methane values were verified by bag samples sent for laboratory analysis. The regulatory agency established that the likely source of elevated temperatures was the slag undergoing a carbonation (i.e., CO2 consuming) reaction. The use of the slag as an ADC, spread broadly across the landfill in thin layers, resulted in dozens of impacted wells but also likely prevented more severe detrimental effects in any one area. However, after some time, gas wells began exhibiting poor LFG quality, indicating perhaps that the steel slag was exhausted of carbon-sequestering ability, but high temperatures persisted. The facility is currently under enhanced monitoring and reporting requirements.
In 2009, ETLF D installed dewatering pumps in multiple gas extraction wells in order to increase LFG capture from a portion of the site. Instances of elevated wellhead temperature were observed and laboratory analysis identified CO = 10,200 ppmv from one well. Significant differential settlement was observed at the site from 2010 to 2014 resulting from large areas of mass loss to thermal degradation. Exposed geomembrane liner was installed across 50 acres to increase gas collection efficiency and reduce odorous emissions. Poor quality gas was routed to a separate flare system with natural gas required to supplement for optimal pollutant destruction/treatment. Approximately 60 of >300 gas extraction wells are under enhanced monitoring and reporting requirements.
ETLF E began operations in the early 1990s. For several years in the mid-2000 s, ETLF E accepted bottom ash from a power plant and co-disposed it with MSW in several of the disposal cells. Beginning in 2010, elevated temperatures, along with declining CH4 prompted investigations that detected elevated CO and H2 in LFG. ETLF E has approximately 300 gas extraction wells, of which >40 are now subject to increased monitoring. From years 2013–2019, maximum temperatures in gas extraction wells increased from 69 to 89 °C/156–192 °F. Corresponding CH4 concentrations were 0.8–37.7%. The facility is currently under enhanced monitoring and reporting requirements.
2.2. Data analysis
Waste composition data were provided by regulatory entities or collected from state websites or Greenhouse Gas Reporting Program database (US EPA, 2020). LFG data reported here were supplied to US EPA by state regulators which in turn received the information from landfill operators. The data were provided in tabular formats such as Microsoft Excel files or PDF documents. All of the measurements were taken by landfill technicians during routine operations (e.g., wellfield balancing) while monitoring wells known or suspected to be impacted by a SER. Sampling events utilized standard equipment such as a gas emission meter (GEM) which quantifies CH4, CO2, and O2 from 0 to 100% at 0.01% precision with an infrared sensor. The resultant summation is subtracted from 100% and the difference is characterized as “Balance Gas.” Additionally, because of the long-enduring SERs, H2 and CO were routinely monitored at these facilities. H2 and CO are products of some known exothermic reactions and have been used to indicate the presence of a SER (Jafari et al., 2017a; Jafari et al., 2017b; Stark & Jafari, 2017). CO can be quantified in parts per million by volume (ppmv) by some GEMs; however, this may not have been the case at every landfill. CO concentrations are typically measured in the field with gas detection tubes (e.g., Draeger), which have less precision and accuracy than infrared sensors in GEMs. H2 was measured by gas chromatography. In some instances, LFG samples were collected by the operator and delivered to third-party laboratory to confirm field measurements. Laboratory analysis with a gas chromatograph give high accuracy and precision and will usually quantify H2, N2, CO2, CH4, O2, and CO but quantifies them assuming no balance or unknown component remains.
GEMs produce standardized electronic files that are routinely used in the industry and the data were assumed to be accurate. However, upon the author’s inspection of the data, some entries did not sum to 100% as would be expected. Measurements whose sum of CH4, CO2, O2, H2, CO, and Balance Gas were >101.00% or <99.00% were removed from the analysis. These discrepancies may be attributable to combinations of field and laboratory data. As such, all data are assumed to be accurate as they are presented here.
3. Results and discussion
3.1. Waste composition
Current thermal modeling approaches suggest that internal elevated temperatures are likely due to the interaction of industrial wastes with MSW, rather than a pyrolytic reaction of MSW exclusively (Hao et al., 2020; Hao et al., 2017; Yeşiller et al., 2015). The hypothesis proposed by others is that SERs are catalyzed by reactive, industrial wastes after their burial where heat accumulation is more likely in the insulated interior of the landfill (Hao et al., 2017; Jafari et al., 2017b). Hao et al. (2017) predicted that 80/20% MSW/ash could create internal conditions of 150 °C which is greater than values that would be observed in gas extraction wells (Jafari et al., 2017b).
Fig. 2 presents waste composition data for ETLFs A-E and the waste composition of all MSW landfills in the states of Ohio, Pennsylvania, and Texas. Each of the ETLFs examined here reported disposal of >60% MSW, relatively small quantities of CDD, and upwards of 40% of wastes described here as “Other.” This category included but was not limited to contaminated soils, incineration ashes, industrial wastes, sludges, and street sweepings. The broad categorization of “Other” here was not meant to suggest that any or all of the material was potentially reactive. MSW represented 61–79% of the landfill composition which was generally similar to overall state disposal data. ETLFs were distinguished by lower quantities of CDD and comparatively higher percentages of other non-hazardous wastes. This compositional analysis does not purport to offer a definitive answer for why the SERs initiate or how they are sustained. The data show that the scenarios modeled by Hao et al. (2017) and Hao et al. (2020), where operators co-dispose MSW and significant quantities of industrial wastes, seem to align with current standard practice.
Fig. 2.

Cumulative waste composition of ETLFs by mass. State data are shown for comparison.
Because the ETLFs generally resembled the composition of MSW landfills in the states presented here, it appears that overall composition is less important than the operator’s knowledge of actual waste arrangement and placement within the landfill (Reinhart et al., 2020; Yeşiller et al., 2015). Detailed waste composition and placement data that identify how the materials were co-disposed would be very helpful for operators when reactions occur years or decades after disposal.
3.2. Wellhead temperature
Methanogens proliferate mostly in mesophilic (30–40 °C/86–104 °F) and thermophilic (50–60 °C/122–140 °F) conditions (Boone et al., 1993). There are microbes that can exist in hyper-thermophilic conditions (T > 65 °C/149 °F), but the population and diversity of methanogens decreases and methanogenesis is inhibited as temperature increases beyond 57 °C/135 °F (De la Cruz et al., 2021; Jafari et al., 2017b; Schupp et al., 2020).
Although subsurface temperature measurements are preferable to understand internal temperatures and conditions, wellhead temperature is important as a trigger for corrective action in US landfill air pollution control regulations. Until recently, MSW landfills were regulated by NSPS Subpart WWW or Subpart XXX with the lower temperature threshold of 55 °C/131 °F (CFR, 1996; CFR, 2016a). Most landfills now are regulated under either their state plan implementing emission guidelines (CFR, 2016b) or the federal plan (CFR, 2019) which allow operators to show compliance by meeting new National Emission Standards for Hazardous Air Pollutants (NESHAP) standards (CFR, 2020) which includes a higher 145 °F threshold as well as higher oxygen concentration (10–12% O2). The newer temperature threshold reflects and acknowledges more recent understanding that thermophilic conditions may not inhibit methanogens. The newer oxygen threshold was promulgated so as not to penalize gas collection in older areas, where LFG production has significantly decreased. Typical measurement of LFG wellhead temperature occurs by manually inserting a thermocouple into the wellhead manifold. The measurement is susceptible to user error and impacts from seasonal weather (Jafari et al., 2017a; Reinhart et al., 2020).
Fig. 3 presents measurements of wellhead temperature and ambient air temperature (dashed line) at ETLFs for a single calendar year beginning with January. The points in the figure represent statistical outliers. The variation in datasets show the potential for (unintentional) mismeasurements and the influence of ambient temperatures above the landfill surface to obfuscate the in-situ gas temperature. This was observed whether the gas well was impacted or unimpacted by a SER. The occurrence of gas well temperature readings <20 °C/68 °F even in spring or summer months suggested measurements occur early in the morning when ambient conditions would be cooler. Measurements are shown in a single calendar year for each ETLF so the change or lack of change due to seasonality can be observed. For instance, at ETLFs A, C, and E, the measurements are significantly warmer than ambient conditions and can be reasonably assumed to reflect LFG. However, ETLFs B and D demonstrate considerable variability across wells for each month, with some measurements near or below 0 °C (32 °F).
Fig. 3.
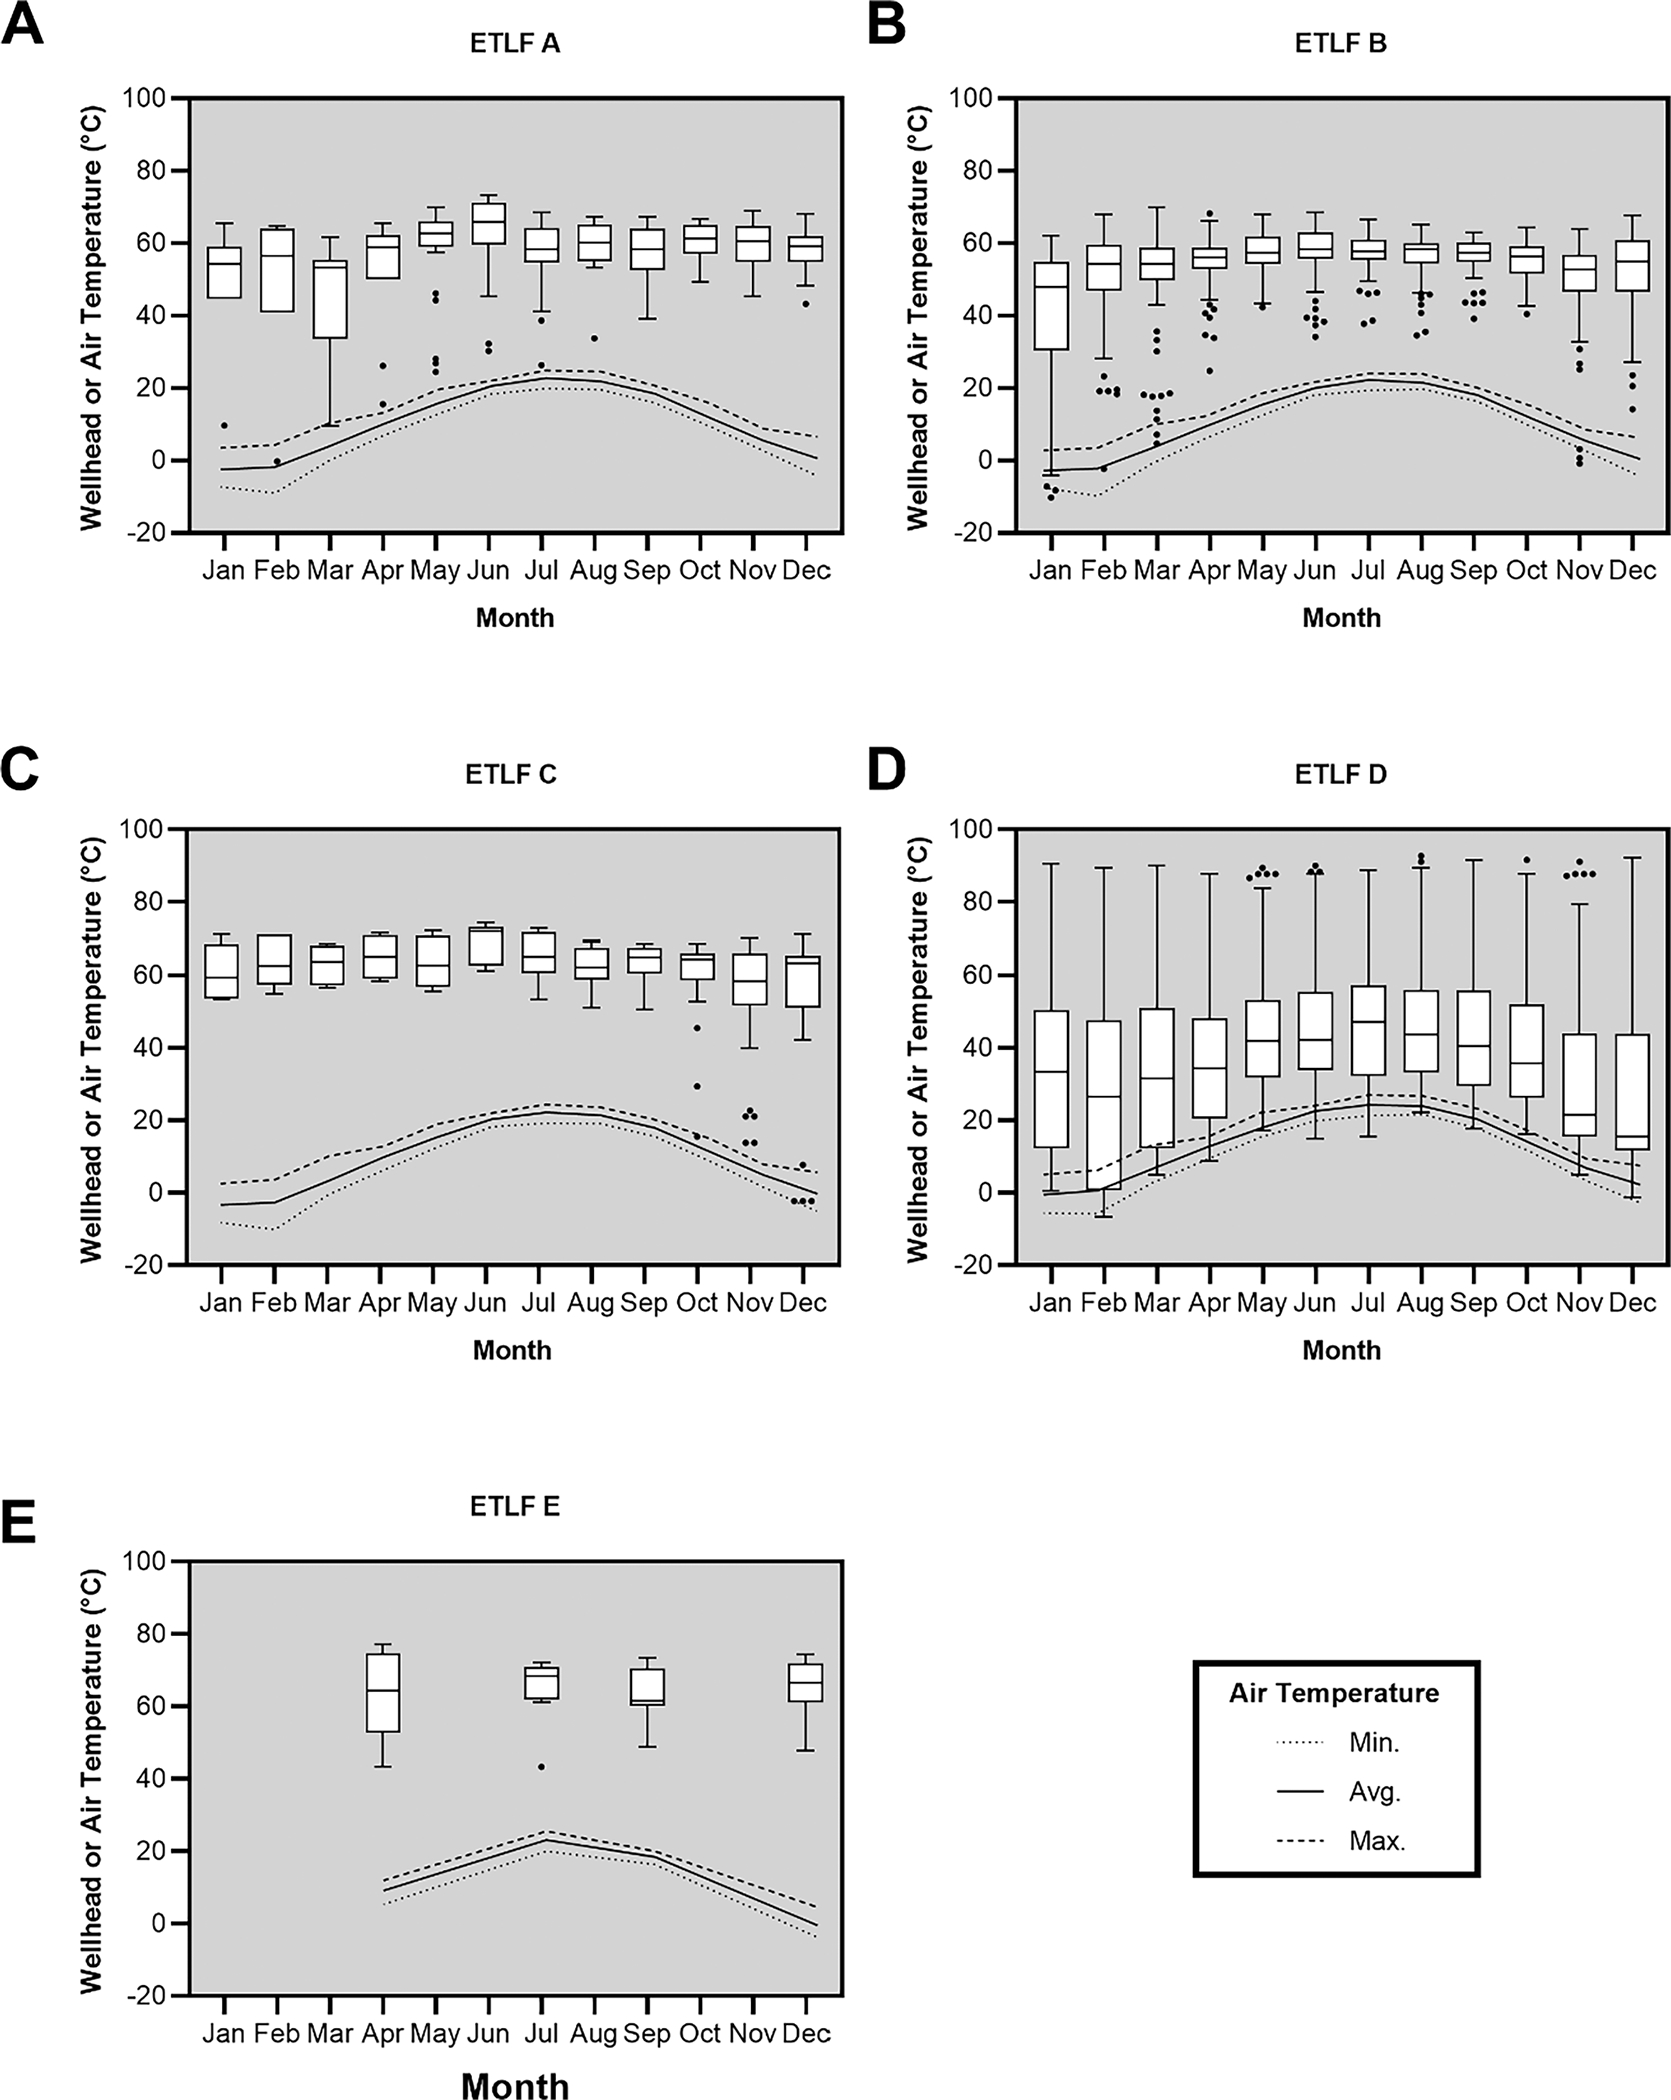
Variance of gas extraction wellhead temperatures at ETLFs. The data displayed for each ETLF is for a single calendar year. The lines indicate maximum, average, and minimum ambient air temperatures.
The analysis of wellhead temperature data should be performed with great care to assess whether the measurements accurately reflect the landfill environment (De la Cruz et al., 2021). While methanogenesis can occur in psychrophilic conditions, the insulative properties of a landfill and healthy gas production would provide contrary evidence to such a case (Cox et al., 2015; Hanson et al., 2010; Yeşiller et al., 2015). Measurements below 0 °C are shown here to illustrate that data can be presented which are not actually reflective of the landfill environment and should be excluded from any analysis. There is no regulatory minimum for LFG temperature, however, measurements similar to ambient air temperatures coinciding with the presence of O2 would indicate air intrusion and limit the value of the data for decision-making.
3.3. Methane and carbon dioxide
Anaerobic LFG typically contains 50–60% CH4 and 40–50% CO2, with moisture, ammonia (NH3), and other trace compounds making up the balance (Agency for Toxic Substances and Disease Registry, 2001). A CH4:CO2:: 50:50 indicates equal volumetric production (i.e., 1:1) and is the expected stoichiometric primary gas ratio of anaerobic cellulosic biodegradation (i.e., MSW). Anaerobic biodegradation lipids and proteins can result in CH4:CO2 > 1:1 stoichiometrically but they are not disposed in quantities that would significantly impact LFG composition (Krause et al., 2016). In LFG extraction wells, observed CH4 ranges from 50 to 60% and CO2 ranges from 40 to 50% (i.e., CH4:CO2 > 1:1). CO2 that is generated can be rapidly dissolved into water, especially water that is buffered with carbonates and other alkaline species, such as leachate. CH4 is generally insoluble in the landfill environment. Therefore, observations of CH4 > 55% point to high moisture conditions and ETLFs are often characterized by areas with high moisture content or saturated zones with perched water (Benson, 2017; Jafari et al., 2017b).
Because of a disruption in anaerobic biodegradation from either combustion, a SER, or other chemical reaction, gas volume and composition will change (Martin et al., 2013). This has been observed at a number of ETLFs via an examination of the primary gas ratio (Benson, 2017; Jafari et al., 2017a; Jafari et al., 2017b). CH4:CO2 < 1:1 suggest inhibitory processes, which could be simple air intrusion but could also be a SER (Jafari et al., 2017b; Powell et al., 2006). Significant and prolonged reductions of the ratio alongside observed T > 60 °C (140 °F) are indicative of exothermic reactions. Substantial changes in LFG quality should be examined closely, as they indicate different reactions that can have long-term implications for site management.
Fig. 4 presents the range of CH4:CO2 gas quality data observed at ETLFs A-E. Each graph includes shaded areas that indicate (1) normal operation (green), (2) air intrusion (pink), (3) exothermic reactions (red), or (4) high moisture conditions (blue). The shaded areas are based on observations from this analysis. The blue line indicates the maximal sum of CH4 and CO2 for each concentration (i.e., x + y = 100%). Mathematically, values cannot be to the right of the blue line. The red dashed lines indicate a 50:50 volumetric relationship and the dash-dot lines indicate a 60:40 primary gas ratio (ETLF C). The area to the left of the dashed line indicates CH4:CO2 < 1:1. In a normally operating anaerobic landfill, volumes of CH4 and CO2 should sum near 100% where O2 or nitrogen (N2) gas might complete the balance. The diameter of the circle indicates the measured O2 concentration (0–21%). Clean Air Act (CAA) New Source Performance Standards (NSPS) restrict O2 < 5% in gas wells and O2 ≈ 21% indicates ambient air (CFR, 2016a). High O2 readings could be due to measurement error, cracks in the wellhead manifold, or problems with subsurface well construction (i.e., landfill air intrusion). When CH4 and CO2 are each <30% but the ratio is near 1, the likely source of balance is air, as indicated in the larger diameters in the lower left corners of each graph. Some instances of low O2, CH4, and CO2 are present in the data. In these cases, the balance gas is unknown and laboratory analyses are required to establish composition. The shaded areas are not meant to be strictly defined areas but to serve as guides for more detailed site-specific analyses. For instance, the area between the exothermic reaction and normal area is unshaded. The measurements in this region reflect gas wells that are indirectly affected, likely pulling in LFG from impacted and unimpacted zones.
Fig. 4.

Examinations of primary gas ratio (CH4:CO2) from ETLFs A-E.
ETLF A shows groupings of data collected from gas wells where CH4 < 10% (highly impacted) and 25% ≤ CH4 ≤ 50% (partially impacted or surrounding conditions). Data from ETLF A are displayed by year from 2010 to 2017 in Fig. S1 in the Supplemental Material, which help to better display the changing gas quality over time. ETLF B indicates significant air intrusion (CH4 < 25%, O2 > 10%) but also LFG quality indicative of a SER (Benson, 2017; Jafari et al., 2017a). ETLF C shows both the 50/50 and 60/40 trendlines which would delineate the limits of healthy anaerobic LFG. This ETLF used steel slag as an ADC and subsequently reported elevated temperatures to the state authority. ETLF C then exhibited a unique SER, and GEM measurements have been confirmed by laboratory analysis. Carbonation of steel slag consumed CO2 from LFG which increased concentrations of CH4 (Huijgen & Comans, 2006). Despite the elevated temperatures, the primary gas ratio remained > 1:1 and many wells showed CH4 > 70% up to 96.7%. Although O2 < 5% in many instances, the elevated temperatures necessitated more frequent monitoring and variances to NSPS requirements for temperature. The application of steel slag as an ADC provides a unique opportunity to understand how the material was disposed. Whereas in ETLF B, the waste was disposed in a single location, at ETLF C the ADC was distributed in thin layers. This could help explain why ETLF C did not exhibit significant negative impacts despite elevated temperatures. This further supports the notions that very small quantities of material can impact a site, waste composition alone does not seem predictive of behavior, and the process to dispose of or place the waste might be the most important factor in temperature generation and accumulation. ETLF D shows significant impact across dozens of gas wells from a SER. Elevated temperatures caused by SERs are known to deform polyvinyl chloride (PVC) or high-density polyethylene (HDPE) gas wells, which could allow air to enter the gas collection system. ETLF E shows similar characteristics typical of SERs with a primary gas ratio <1 and some instances of high moisture.
3.4. Hydrogen
H2 is produced during aerobic and anaerobic biodegradation of biomass including MSW (Agency for Toxic Substances and Disease Registry, 2001; De Gioannis et al., 2013; Mormile et al., 1996). It is thought to contribute 33% to total landfill CH4 production (Conrad, 1999). Thermophilic conditions (T ≥ 50 °C) are energetically more favorable for biological H2 production than mesophilic conditions (Pawar & van Niel, 2013). It has been shown to be abiotically produced in landfills through chemical reactions such as iron corrosion (Aghdam et al., 2017; Reardon, 1995) or hydrolysis reactions of aluminum dross (Calder & Stark, 2010; Huang & Tolaymat, 2019; Jafari et al., 2014; Martin et al., 2013; Stark et al., 2012). Hydrogen has been shown to be chemically and biologically produced from the water–gas shift phenomena, though usually at temperatures above 200 °C (Chen & Chen, 2020; Ratnasamy & Wagner, 2009). And hydronium (H+) can be consumed during the anaerobic degradation of 1,4-dichlorobenzene and production of chlorobenzene (Sizirici & Tansel, 2010). There are many of biotic and abiotic pathways for H2 production and consumption in MSW landfills. In a normally operating landfill, H2 should be consumed as it is produced. Detection and quantification of H2 suggests inhibition of methanogenesis is occuring.
As shown in Fig. 5, significant volumes of hydrogen gas were observed in LFG wells at ETLFs. Like methane, H2 is flammable and explosive. The lower and upper explosive limits (LEL and UEL) are 4% and 70%, respectively. Comparatively, the LEL and UEL of methane are 5% and 17%, respectively. Thus, nearly all quantified amounts of hydrogen are explosive whereas typical LFG is not. As shown in Fig. 5A, there are points with CH4:CO2 > 1 and detectable H2 upwards of 10% (one outlier of >30%). As shown in Fig. 5B, ETLFs D and E exhibited increasing concentrations of hydrogen with increasing gas well temperature, which is consistent with methanogenic inhibition. ETLFs A, B, and C did not have coincident measurements of H2 with temperature. The variety of observations might be explained by the migration of H2 to less-impacted areas.
Fig. 5.

(A.) H2 with respect to the primary gas ratio at ETLFs A-E. (B.) H2 with respect to wellhead temperatures at ETLFs D and E.
3.5. Carbon monoxide
CO has long been an indicator for oxidative combustion within MSW landfills (Agency for Toxic Substances and Disease Registry, 2001; Powell et al., 2006). Like H2, CO has abiotic and biotic production and consumption pathways and can be biologically converted to methane or acetate (Chen et al., 2008; Haarstad et al., 2006; Luo et al., 2013; Neves et al., 2011; Oelgeschläger & Rother, 2008; Sipma et al., 2006; Sipma et al., 2003). It is also a product of hydrothermal carbonization and torrefaction reactions which occur between 240 and 400 °C (Libra et al., 2011; Lu et al., 2013). Although it has not been extensively quantified, it is thought that the typical CO concentration in LFG is <10 ppmv whereas concentrations between 10 and 1000 ppmv show suspicious activity, and CO > 1000 ppmv would indicate some type of reaction (aerobic or anaerobic) that would necessitate an operator response (FEMA, 2002; Jafari et al., 2017b; Powell et al., 2006; Stark & Jafari, 2017; Stearns & Petoyan, 1984).
Whether the reaction is oxidative combustion or some pyrolytic/anaerobic reaction, the conditions that result in substantial CO production occur at temperatures above which most methanogens are sustained (De la Cruz et al., 2021; Schupp et al., 2020). Fig. S2 presents measurements of CO as a function of temperature and CH4:CO2 for several ETLFs. Powell et al. (2006) reported that CO concentrations were below detection limits (5 ppmv) in normal/healthy LFG and showed a strong inverse correlation to CH4:CO2 during air injection to a maximum ~ 1200 ppmv. This same inverse relationship is observed in Fig. S2. ETLFs A, D, and E exhibited maximum CO = 2900, 16,000, and 1580 ppmv, respectively. Similarly, Jafari et al. (2017a) reported a maximum of 10,200 ppmv CO, but were more generally in the range of 2000–2500 ppmv from one ETLF. As with H2, there are some observed occurrences of CO levels between 10 and 100 ppmv in wells where CH4: CO2 > 1:1. This is believed to be due to gas transport across wells that are located in areas of waste that are indirectly or less impacted by a SER.
Positive correlations between H2 (%) and CO (ppmv) were observed in ETLFs A, D, and E. While arbitrary, trendlines of H2:CO = 1:100 seem to delineate many of the measurements. It is hypothesized here that measurements H2:CO <1:100 suggest a reaction of industrial waste with the primary gas product being H2. Measurements exhibiting H2:CO > 1:100 are hypothesized to suggest a reaction of primarily biomass (i.e., MSW). Measurements from 2013 to 2016 at ETLF D indicated the SER was years-long unlike a near-surface fire (i.e., combustion). At ETLF D, significant differential settlement was observed from 2011 to 2013. As displayed in Fig. 6, as the reaction continues, the impacted LFG wells showed decreasing maximum CO measurements and gradual movement of the dataset to H2:CO < 1:100. One possible reason is that the MSW was consumed (leaving behind a charred or carbonized residual), and the remaining reactive material was the industrial waste that continued to produce H2 gas. This hypothesis requires further field and laboratory investigations.
Fig. 6.

Correlations of H2 and CO might be site-specific and temporally dependent. All trend lines in the figures are H2 (%):CO (ppmv) = 1:100.
3.6. Assessing LFG data comprehensively
Evaluations of LFG health should be holistic and comprehensive (Benson, 2017; Jafari et al., 2017a). A single measurement or a single unusual characteristic should not be cause for alarm. However, changing gas quality is indicative of changing conditions and should be promptly evaluated. As with any monitoring program, the benefits and costs of different analytical methods should be weighed against the objectives of the analysis. Fig. 7 presents a chart for MSW landfill wellhead characteristics based on a combination of U.S. federal regulations, established microbial or stoichiometric boundaries, literature, and the authors’ analyses here. The chart does not diagnose a specific condition but can be informative for operators and regulators to suggest further examination.
Fig. 7.

A chart of comprehensive LFG characteristics to evaluate individual wellhead conditions at U.S. MSW landfills.
In the U.S., the CAA limits wellhead temperatures to 55 or 62.8 °C (131 or 145 °F), depending on the landfill’s permit conditions (CFR 2016a; CFR, 2020). Alternately, observations of temperatures near ambient may not be reflective of an anoxic landfill environment. CH4 and CO2 in LFG wells are not addressed in landfill regulations but CH4 > 60% indicates unusual activity and CH4 < 40% indicates inhibition. CO2 > 50% likewise indicate unusual activity and measurements below 35% generally indicate air intrusion or some other perturbance. O2 concentrations >5% require corrective actions and based on ambient air, should never measure >21%. Balance gas should be <10% of LFG and concentrations above 20% indicate atypical composition such as ammonia or hydrogen which are not quantified by typical GEMs. N2 has a stoichiometric limit of 79% and is readily identified from laboratory analysis. Concentration of N2 > 20% generally indicates air intrusion. The presence of H2 indicates some type of methanogenic inhibition. Any measurable quantity of H2 should be treated with caution as it is explosive from 5 to 70%. CO has a number of product pathways and could be indicative of air intrusion, incomplete combustion, or anaerobic chemical reactions. Measurements of 1 < CO < 10 ppmv in LFG are at the quantifiable limit and might be acceptable. However, CO > 100 ppmv requires further investigation and CO > 1000 ppmv requires corrective action (CFR, 2020). Measurements of CO in conjunction with quantifiable H2 indicate atypical conditions and inhibition of methanogenesis (Jafari et al., 2017b).
4. Conclusions
The review of LFG field data from five ETLFs in the U.S. was performed with data from 2013 to 2020 (data length was site-specific). In some instances, a particular waste was identified that led to exothermic reaction and co-disposal is likely a contributing factor to SER development, however, in general, waste composition alone does not seem to indicate if a landfill will become an ETLF. Measurements taken at the wellhead are subject to conditions above the surface, internal mixing, and transport from the well’s radius of influence. Nevertheless, wellhead observations and evaluations are important for regulators and operators to identify characteristics that suggest regular and irregular conditions. Even in summer months, wellhead temperatures sometimes reflected conditions outside of the landfill. In order to ensure accurate baseline measurements, more attention should be paid to reported wellhead temperatures that are near ambient or seasonal norms, which can indicate air intrusion, mis-measurement, or other environmental impacts to the wellhead measurement. Correlations of CH4:CO2 were examined for the ETLFs and different conditions (e.g., SER, high moisture, air intrusion) were clearly observable. In a unique observation, ETLF C reported use of steel slag as an ADC which caused CH4 > 90% simultaneous to elevated temperatures via carbonation. Concentrations of H2 > 60, 30, 60, 40, and 60% were observed at ETLFs A-E, respectively. CO concentrations generally correlated to temperature in gas wells known to be impacted by a SER. CO = 8–16,000 ppmv were observed in gas wellheads at ETLFs A, D, and E. Symptoms of a SER have persisted at each these 5 sites for over 10 years and large areas of the landfill are likely to remain impacted for many years to come.
Supplementary Material
Acknowledgements
We thank Annette DeHavilland (Ohio Environmental Protection Agency) for her review of the manuscript.
Footnotes
Declaration of Competing Interest
The authors declare that they have no known competing financial interests or personal relationships that could have appeared to influence the work reported in this paper.
Disclaimer
The research was funded by the U.S. Environmental Protection Agency Office of Research & Development. It has been subject to the Agency’s review, and it has been approved for publication as an EPA document. Mention of trade names or commercial products does not constitute endorsement or recommendation for use.
Appendix A. Supplementary material
Supplementary data to this article can be found online at https://doi.org/10.1016/j.wasman.2023.04.023.
Data availability
Data will be made available on request.
References
- Agency for Toxic Substances and Disease Registry, 2001. Landfill Gas Primer - An Overview for Environmental Health Professionals. ATSDR. https://www.atsdr.cdc.gov/HAC/landfill/html/intro.html. [Google Scholar]
- Aghdam EF, Scheutz C, Kjeldsen P, 2017. Assessment of methane production from shredder waste in landfills: the influence of temperature, moisture and metals. Waste Manag 63, 226–237. 10.1016/j.wasman.2016.11.023. [DOI] [PubMed] [Google Scholar]
- Benson CH, 2017. Characteristics of gas and leachate at an elevated temperature landfill. Geotech. Front. 7, 313–322. 10.1061/9780784480434.034. [DOI] [Google Scholar]
- Boone DR, Whitman WB, Rouvière P 1993. Diversity and Taxonomy of Methanogens. in: Methanogenesis: Ecology, Physiology, Biochemistry & Genetics, (Ed.) Ferry JG , Springer US. Boston, MA, pp. 35–80. 10.1007/978-1-4615-2391-8_2. [DOI] [Google Scholar]
- Calder GV, Stark TD, 2010. Aluminum reactions and problems in municipal solid waste landfills. Pract. Period. Hazard. Toxic Radioact. Waste Manage. 14 (4), 258–265. [Google Scholar]
- CFR, 1991. 40 CFR 258 - Criteria for Municipal Solid Waste Landfills. [Google Scholar]
- CFR, 1996. 40 CFR 60 Subpart WWW - Standards of Performance for Municipal Solid Waste Landfills That Commenced Construction, Reconstruction, or Modification on or After May 30, 1991, but Before July 18, 2014. [Google Scholar]
- CFR, 2016a. 40 CFR 60 Subpart XXX - Standards of Performance for Municipal Solid Waste Landfills That Commenced Construction, Reconstruction, or Modification After July 17, 2014. [Google Scholar]
- CFR, 2016b. 40 CFR 60 Subpart Cf - Emission Guidelines and Compliance Times for Municipal Solid Waste Landfills. [Google Scholar]
- CFR, 2019. 40 CFR 62 - Approval and Promulgation of State Plans for Designated Facilities and Pollutants. [Google Scholar]
- CFR, 2020. 40 CFR 63 Subpart AAAA - National Emission Standards for Hazardous Air Pollutants: Municipal Solid Waste Landfills. [Google Scholar]
- Chen W-H, Chen C-Y, 2020. Water gas shift reaction for hydrogen production and carbon dioxide capture: a review. Appl. Energy 258, 114078. [Google Scholar]
- Chen W-H, Hsieh T-C, Jiang TL, 2008. An experimental study on carbon monoxide conversion and hydrogen generation from water gas shift reaction. Energ. Conver. Manage. 49 (10), 2801–2808. [Google Scholar]
- Conrad R, 1999. Contribution of hydrogen to methane production and control of hydrogen concentrations in methanogenic soils and sediments. FEMS Microbiol. Ecol. 28 (3), 193–202. 10.1111/j.1574-6941.1999.tb00575.x. [DOI] [Google Scholar]
- Cox JT, Yesiller N, Hanson JL, 2015. Implications of variable waste placement conditions for MSW landfills. Waste Manag. 46, 338–351. 10.1016/j.wasman.2015.08.031. [DOI] [PubMed] [Google Scholar]
- De Gioannis G, Muntoni A, Polettini A, Pomi R, 2013. A review of dark fermentative hydrogen production from biodegradable municipal waste fractions. Waste Manag. 33 (6), 1345–1361. 10.1016/j.wasman.2013.02.019. [DOI] [PubMed] [Google Scholar]
- De la Cruz FB, Cheng Q, Call DF, Barlaz MA, 2021. Evidence of thermophilic waste decomposition at a landfill exhibiting elevated temperature regions. Waste Manag. 124, 26–35. 10.1016/j.wasman.2021.01.014. [DOI] [PubMed] [Google Scholar]
- Epa US, 2020. Greenhouse Gas Customized Search. Accessed on: 05/11/2021. https://www.epa.gov/enviro/greenhouse-gas-customized-search.
- Fathinezhad A, Jafari NH, Oldenburg CM, Caldwell MD, 2022. Numerical investigation of air intrusion and aerobic reactions in municipal solid waste landfills. Waste Manag. 147, 60–72. 10.1016/j.wasman.2022.05.009. [DOI] [PubMed] [Google Scholar]
- FEMA, 2002. Landfill Fires Their Magnitude, Characteristics and Mitigation. United States Fire Administration National Fire Data Center. [Google Scholar]
- Haarstad K, Bergersen O, Sørheim R, 2006. Occurrence of carbon monoxide during organic waste degradation. J. Air Waste Manag. Assoc. 56 (5), 575–580. 10.1080/10473289.2006.10464470. [DOI] [PubMed] [Google Scholar]
- Hanson JL, Yeşiller N, Oettle NK, 2010. Spatial and temporal temperature distributions in municipal solid waste landfills. J. Environ. Eng. 136 (8), 804–814. [Google Scholar]
- Hao Z, Sun M, Ducoste JJ, Benson CH, Luettich S, Castaldi MJ, Barlaz MA, 2017. Heat generation and accumulation in municipal solid waste landfills. Environ. Sci. Tech. 51 (21), 12434–12442. [DOI] [PubMed] [Google Scholar]
- Hao Z, Barlaz MA, Ducoste JJ, 2020. Finite-element modeling of landfills to estimate heat generation, transport, and accumulation. J. Geotech. Geoenviron. Eng. 146 (12), 04020134. [Google Scholar]
- Huang X-L, El Badawy A, Arambewela M, Ford R, Barlaz M, Tolaymat T, 2014. Characterization of salt cake from secondary aluminum production. J. Hazard. Mater. 273, 192–199. [DOI] [PubMed] [Google Scholar]
- Huang X-L, Tolaymat T, 2019. Gas quantity and composition from the hydrolysis of salt cake from secondary aluminum processing. Int. J. Environ. Sci. Technol. 16 (4), 1955–1966. [DOI] [PMC free article] [PubMed] [Google Scholar]
- Huijgen WJJ, Comans RNJ, 2006. Carbonation of steel slag for CO2 sequestration: leaching of products and reaction mechanisms. Environ. Sci. Tech. 40 (8), 2790–2796. 10.1021/es052534b. [DOI] [PubMed] [Google Scholar]
- Jafari NH, Stark TD, Roper R, 2014. Classification and reactivity of secondary aluminum production waste. J. Hazard. Toxic Radioact. Waste 18 (4), 04014018. [Google Scholar]
- Jafari NH, Stark TD, Thalhamer T, 2017. Spatial and temporal characteristics of elevated temperatures in municipal solid waste landfills. Waste Manag. 59, 286–301. [DOI] [PubMed] [Google Scholar]
- Jafari NH, Stark TD, Thalhamer T, 2017. Progression of elevated temperatures in municipal solid waste landfills. J. Geotech. Geoenviron. Eng. 143 (8), 05017004. [Google Scholar]
- Krause MJ, Chickering GW, Townsend TG, Reinhart DR, 2016. Critical review of the methane generation potential of municipal solid waste. Crit. Rev. Environ. Sci. Technol. 46 (13), 1117–1182. 10.1080/10643389.2016.1204812. [DOI] [Google Scholar]
- Libra JA, Ro KS, Kammann C, Funke A, Berge ND, Neubauer Y, Titirici M-M, Fühner C, Bens O, Kern J, 2011. Hydrothermal carbonization of biomass residuals: a comparative review of the chemistry, processes and applications of wet and dry pyrolysis. Biofuels 2 (1), 71–106. [Google Scholar]
- Lu X, Pellechia PJ, Flora JR, Berge ND, 2013. Influence of reaction time and temperature on product formation and characteristics associated with the hydrothermal carbonization of cellulose. Bioresour. Technol. 138, 180–190. 10.1016/j.biortech.2013.03.163. [DOI] [PubMed] [Google Scholar]
- Luo G, Wang W, Angelidaki I, 2013. Anaerobic digestion for simultaneous sewage sludge treatment and CO biomethanation: process performance and microbial ecology. Environ. Sci. Tech. 47 (18), 10685–10693. 10.1021/es401018d. [DOI] [PubMed] [Google Scholar]
- Mahinroosta M, Allahverdi A, 2018. Hazardous aluminum dross characterization and recycling strategies: a critical review. J. Environ. Manage. 223, 452–468. doi. 10.1016/j.jenvman.2018.06.068. [DOI] [PubMed] [Google Scholar]
- Martin JW, Stark TD, Thalhamer T, Gerbasi-Graf GT, Gortner RE, 2013. Detection of aluminum waste reactions and waste fires. J. Hazard. Toxic Radioact. Waste 17 (3), 164–174. [Google Scholar]
- Mormile MR, Gurijala KR, Robinson JA, McInerney MJ, Suflita JM, 1996. The importance of hydrogen in landfill fermentations. Appl. Environ. Microbiol. 62 (5), 1583–1588. 10.1128/aem.62.5.1583-1588.1996. [DOI] [PMC free article] [PubMed] [Google Scholar]
- Narode A, Pour-Ghaz M, Ducoste JJ, Barlaz MA, 2021. Measurement of heat release during hydration and carbonation of ash disposed in landfills using an isothermal calorimeter. Waste Manag. 124, 348–355. [DOI] [PubMed] [Google Scholar]
- Neves D, Thunman H, Matos A, Tarelho L, Gómez-Barea A, 2011. Characterization and prediction of biomass pyrolysis products. Prog. Energy Combust. Sci. 37 (5), 611–630. 10.1016/j.pecs.2011.01.001. [DOI] [Google Scholar]
- Oelgeschläger E, Rother M, 2008. Carbon monoxide-dependent energy metabolism in anaerobic bacteria and archaea. Arch. Microbiol. 190 (3), 257–269. 10.1007/s00203-008-0382-6. [DOI] [PubMed] [Google Scholar]
- Pawar SS, van Niel EWJ, 2013. Thermophilic biohydrogen production: how far are we? Appl. Microbiol. Biotechnol. 97 (18), 7999–8009. 10.1007/s00253-013-5141-1. [DOI] [PMC free article] [PubMed] [Google Scholar]
- Powell J, Jain P, Kim H, Townsend T, Reinhart D, 2006. Changes in landfill gas quality as a result of controlled air injection. Environ. Sci. Tech. 40 (3), 1029–1034. [DOI] [PubMed] [Google Scholar]
- Ratnasamy C, Wagner JP, 2009. Water gas shift catalysis. Catal. Rev. 51 (3), 325–440. 10.1080/01614940903048661. [DOI] [Google Scholar]
- Reardon EJ, 1995. Anaerobic corrosion of granular iron: Measurement and interpretation of hydrogen evolution rates. Environ. Sci. Tech. 29 (12), 2936–2945. [DOI] [PubMed] [Google Scholar]
- Reinhart D, Joslyn R, Emrich CT, 2020. Characterization of Florida, US landfills with elevated temperatures. Waste Manag. 118, 55–61. [DOI] [PubMed] [Google Scholar]
- Schupp S, De la Cruz FB, Cheng Q, Call DF, Barlaz MA, 2020. Evaluation of the temperature range for biological activity in landfills experiencing elevated temperatures. ACS ES&T Engineering. [Google Scholar]
- Sipma J, Lens PNL, Stams AJM, Lettinga G, 2003. Carbon monoxide conversion by anaerobic bioreactor sludges. FEMS Microbiol. Ecol. 44 (2), 271–277. 10.1016/s0168-6496(03)00033-3. [DOI] [PubMed] [Google Scholar]
- Sipma J, Henstra AM, Parshina SN, Lens PNL, Lettinga G, Stams AJM, 2006. Microbial CO conversions with applications in synthesis gas purification and bio-desulfurization. Crit. Rev. Biotechnol. 26 (1), 41–65. 10.1080/07388550500513974. [DOI] [PubMed] [Google Scholar]
- Sizirici B, Tansel B, 2010. Projection of landfill stabilization period by time series analysis of leachate quality and transformation trends of VOCs. Waste Manag. 30 (1), 82–91. 10.1016/j.wasman.2009.09.006. [DOI] [PubMed] [Google Scholar]
- Stark TD, Jafari NH, 2017. Landfill operational techniques in the presence of elevated temperatures. Geotech. Front. 2017, 289–297. [Google Scholar]
- Stark TD, Martin JW, Gerbasi GT, Thalhamer T, Gortner RE, 2012. Aluminum waste reaction indicators in a municipal solid waste landfill. J. Geotech. Geoenviron. Eng. 138 (3), 252–261. [Google Scholar]
- Stearns RP, Petoyan GS, 1984. Identifying and controlling landfill fires. Waste Manag. Res. 2 (1), 303–309. . [DOI] [Google Scholar]
- Vigneault H, Lefebvre R, Nastev M, 2004. Numerical Simulation of the Radius of Influence for Landfill Gas Wells. Vadose Zone J. 3 (3), 909–916. 10.2113/3.3.909. [DOI] [Google Scholar]
- Yeşiller N, Hanson JL, Yee EH, 2015. Waste heat generation: A comprehensive review. Waste Manag. 42, 166–179. 10.1016/j.wasman.2015.04.004. [DOI] [PubMed] [Google Scholar]
Associated Data
This section collects any data citations, data availability statements, or supplementary materials included in this article.
Supplementary Materials
Data Availability Statement
Data will be made available on request.