

Abstract
Background
Myelodysplastic syndromes (MDS) are a heterogeneous group of haematological diseases which are characterised by a uni‐ or multilineage dysplasia of haematological stem cells. Standard treatment is supportive care of the arising symptoms including red blood cell transfusions or the administration of erythropoiesis‐stimulating agents (ESAs) in the case of anaemia or the treatment with granulocyte (G‐CSF) and granulocyte‐macrophage colony stimulating factors (GM‐CSF) in cases of neutropenia.
Objectives
The objective of this review is to assess the evidence for the treatment of patients with MDS with G‐CSF and GM‐CSF in addition to standard therapy in comparison to the same standard therapy or the same standard therapy and placebo.
Search methods
We searched MEDLINE (from 1950 to 3 December 2015) and CENTRAL (Cochrane Central Register of Controlled Trials until 3 December 2015), as well as conference proceedings (American Society of Hematology, American Society of Clinical Oncology, European Hematology Association, European Society of Medical Oncology) for randomised controlled trials (RCTs). Two review authors independently screened search results.
Selection criteria
We included RCTs examining G‐CSF or GM‐CSF in addition to standard therapy in patients with newly diagnosed MDS.
Data collection and analysis
We used hazard ratios (HR) as effect measure for overall survival (OS), progression‐free survival (PFS) and time to progression, and risk ratios for response rates, adverse events, antibiotic use and hospitalisation. Two independent review authors extracted data and assessed risk of bias. Investigators of two trials were contacted for subgroup information, however, no further data were provided. G‐CSF and GM‐CSF were analysed separately.
Main results
We screened a total of 566 records. Seven RCTs involving 486 patients were identified, but we could only meta‐analyse the two evaluating GM‐CSF. We judged the potential risk of bias of these trials as unclear, mostly due to missing information. All trials were randomised and open‐label studies. However, three trials were published as abstracts only, therefore we were not able to assess the potential risk of bias for these trials in detail. Overall, data were not reported in a comparable way and patient‐related outcomes like survival, time to progression to acute myeloid leukaemia (AML) or the incidence of infections was reported in two trials only.
Five RCTs (N = 337) assessed the efficacy of G‐CSF in combination with standard therapy (supportive care, chemotherapy or erythropoietin). We were not able to perform meta‐analyses for any of the pre‐planned outcomes due to inconsistent and insufficient reporting of data. There is no evidence for a difference for overall survival (hazard ratio (HR) 0.80, 95% confidence interval (CI) 0.44 to 1.47), progression‐free survival (only P value provided), progression to AML, incidence of infections and number of red blood transfusions (average number of 12 red blood cell transfusions in each arm). We judged the quality of evidence for all these outcomes as very low, due to very high imprecision and potential publication bias, as three trials were published as abstracts only. Data about quality of life and serious adverse events were not reported in any of the included trials.
Two RCTs (N = 149) evaluated GM‐CSF in addition to standard therapy (chemotherapy). For mortality (two RCTs; HR 0.88, 95% CI 0.62 to 1.26), we found no evidence for a difference (low‐quality evidence). Data for progression‐free survival and serious adverse events were not comparable across both studies, without evidence for a difference between both arms (low‐quality evidence). For infections, red blood cell and platelet transfusions, we found no evidence for a difference, however, these outcomes were reported by one trial only (low‐quality evidence). Time to progression to AML and quality of life were not reported at all.
Moreover, we identified two cross‐over trials, including 244 patients and evaluating GM‐CSF versus placebo, without publishing results for each arm before crossing over. In addition, we identified two ongoing studies, one of which was discontinued due to withdrawal of pharmaceutical support, the other was terminated early, both without publishing results.
Authors' conclusions
Although we identified seven trials with a total number of 486 patients, and two unpublished, prematurely finished studies, this systematic review mainly shows that there is a substantial lack of data, which might inform the use of G‐CSF and GM‐CSF for the prevention of infections, prolonging of survival and improvement of quality of life. The impact on progression to AML remains unclear.
Plain language summary
Myeloid growth factors for patients with myelodysplastic syndromes
In this systematic review, we summarised and analysed the evidence from randomised controlled trials on the efficacy and safety of granulocyte colony stimulating factors (G‐CSF) and granulocyte‐macrophage colony stimulating factors (GM‐CSF) in the treatment of myelodysplastic syndromes (MDS). We searched several important medical databases and found seven randomised controlled trials fulfilling our pre‐defined criteria. We included trials which compared G‐CSF or GM‐CSF in addition to erythropoiesis (production of red blood cells) stimulating agents (ESAs), chemotherapy or no supportive care, in newly diagnosed patients.
Background
Myelodysplastic syndromes are a heterogeneous group of blood cancers which are characterised by the malproduction of one or more lineages of blood stem cells. MDS is described as a rare disease in people under the age of 50 years, but represents a common haematopoietic disorder (a disorder of blood and bone marrow, thus a defect in production and structure of blood cells) in patients older than 70 years. The presented symptoms are dependent on which cell lines are affected and include bleeding, general weakness and bacterial infections.
Standard treatment in older and low‐risk patients is restricted to low‐dose chemotherapy and supportive care (blood transfusions and haematopoietic growth factors such as ESAs, stimulating red blood cells and G‐CSF and GM‐CSF, stimulating white blood cells). High‐risk patients are curatively treated with blood stem cell transplantation or palliatively with high‐dose chemotherapy, always combined with supportive care.
Myeloid growth factors stimulate the production of certain cells. They are released by the human body by nature, but can also be pharmaceutically synthesised and are used for the improvement of blood counts and the avoidance of e.g. infections. The effect of growth factors is under discussion, since their impact on progression to acute myeloid leukaemia (AML), a more aggressive blood cancer, survival and infections is still unclear.
Study characteristics
Our review included seven trials investigating the effect of G‐CSF or GM‐CSF in a randomised design.
Key results
Five trials evaluated G‐CSF in addition to standard care (N = 337). A meta‐analysis of outcomes from this comparison was not conducted, since results were provided in an incomparable and insufficient way across these trials. There was no evidence for a difference between "additional G‐CSF" and "standard care only" in terms of overall survival, progression‐free survival, time to progression to AML, infections, and incidence of blood product transfusions. Quality of life and serious adverse events were not reported at all.
Two trials assessed GM‐CSF in addition to standard care only (N = 149). The meta‐analysis on overall survival showed no evidence for a difference between patients receiving supportive care with GM‐CSF compared to patients without GM‐CSF. All the other pre‐defined outcomes were analysed in a non‐comparable way or in one trial only and no meta‐analysis was possible, without evidence for a difference. Time to progression to acute leukaemia and quality of life were not reported at all.
In summary, we found no evidence for a difference in terms of overall survival, progression‐free survival, infection occurrence, quality of life, time to progression to AML, incidence of blood transfusions and adverse events (e.g. infection, bleeding, nausea) for both of the growth factors.
In addition, we identified two trials evaluating 244 patients without publishing results for each trial arm before all patients could receive GM‐CSF (cross‐over design). Moreover, we identified two trials, of which both have been terminated early, without publishing any results in both cases.
Although we identified seven trials with a total number of 486 patients, two cross‐over trials and two unpublished, prematurely finished studies, this systematic review mainly shows that there is a substantial lack of data, which might rectify the use of G‐CSF and GM‐CSF for the prevention of infections, prolonging of survival or improvement of quality of life.
Quality of the evidence
The evidence is current to 3 December 2015.
Quality of evidence for all the G‐CSF analyses is very low, due to very high imprecision and potential publication bias (three trials have not been reported as full‐text, although they were published as abstracts several years ago). The quality of the evidence for all GM‐CSF analyses was graded as low, due to very high imprecision.
Summary of findings
Summary of findings for the main comparison. G‐CSF compared to placebo for newly diagnosed patients with myelodysplastic syndromes.
| G‐CSF in addition to standard therapy for newly diagnosed patients with myelodysplastic syndromes | ||||||
| Patient or population: newly diagnosed patients with myelodysplastic syndromes Settings: Intervention: G‐CSF in addition to standard therapy (supportive care, chemotherapy or erythropoietin) Comparison: Standard therapy (supportive care, chemotherapy or erythropoietin) | ||||||
| Outcomes | Illustrative comparative risks* (95% CI) | Relative effect (95% CI) | No of Participants (studies) | Quality of the evidence (GRADE) | Comments | |
| Assumed risk | Corresponding risk | |||||
| Placebo | G‐CSF | |||||
| Overall survival | see comment |
HR 0.80 (0.44 to 1.46) |
64 (1 RCT) |
⊕⊝⊝⊝ very low1,2 | only one trial provided data, without evidence for a difference | |
| Progression‐free survival | see comment | 64 (1 RCT) |
⊕⊝⊝⊝ very low1,2 | only one trial assessed this outcome, no data provided except P value | ||
| Time to progression to AML | see comment | 111 (2 RCTs) |
⊕⊝⊝⊝ very low1,2 | data not comparable, two trials provided data, both did not find evidence for a difference | ||
| Quality of life | see comment | not reported for each arm | ||||
| Infections | see comment | 167 (2 RCTs) |
⊕⊝⊝⊝ very low1,2 | data not comparable, two trials provided data without evidence for a difference, Grade 3 or 4 infections in one trial favouring arm without G‐CSF: (RR 1.57, 95% CI 0.65 to 3.80; P = 0.032) Infections in the other trial (grade not reported), no evidence for a difference (RR 0.86, 95% CI 0.62 to 1.19) |
||
| Severe adverse events | see comment | not reported | ||||
| Blood transfusions | see comment | 64 (1 RCT) |
⊕⊝⊝⊝ very low1,2 | only one trial provided data, average number of red blood cell transfusions was 12 in both arms, no evidence for a difference | ||
| *The basis for the assumed risk (e.g. the median control group risk across studies) is provided in footnotes. The corresponding risk (and its 95% confidence interval) is based on the assumed risk in the comparison group and the relative effect of the intervention (and its 95% CI). CI: Confidence interval; | ||||||
| GRADE Working Group grades of evidence High quality: Further research is very unlikely to change our confidence in the estimate of effect. Moderate quality: Further research is likely to have an important impact on our confidence in the estimate of effect and may change the estimate. Low quality: Further research is very likely to have an important impact on our confidence in the estimate of effect and is likely to change the estimate. Very low quality: We are very uncertain about the estimate. | ||||||
1Very small number of included patient and events leading to very high imprecision (downgraded two points)
2 Three trials out of seven were published as abstracts only, indicating potential publication bias (downgraded one point)
Summary of findings 2. GM‐CSF compared to placebo for newly diagnosed patients with myelodysplastic syndromes.
| GM‐CSF in addition to standard therapy for newly diagnosed patients with myelodysplastic syndromes | ||||||
| Patient or population: newly diagnosed patients with myelodysplastic syndromes Settings: Intervention: GM‐CSF in addition to standard therapy (supportive care, chemotherapy or erythropoietin) Comparison: Standard therapy (supportive care, chemotherapy or erythropoietin) | ||||||
| Outcomes | Illustrative comparative risks* (95% CI) | Relative effect (95% CI) | No of Participants (studies) | Quality of the evidence (GRADE) | Comments | |
| Assumed risk | Corresponding risk | |||||
| Placebo | GM‐CSF | |||||
| Mortality (12 months follow‐up) | low | HR 0.88 (0.62 to 1.26) | 149 (2 RCTs) |
⊕⊕⊝⊝ low1 | according to GRADE/summary of findings different reporting, mortality has to be calculated instead of OS | |
| 100 per 1000 | 89 per 1000 (63 to 124) | |||||
| moderate | ||||||
| 300 per 1000 | 269 per 1000 (198 to 362) | |||||
| Progression‐free survival | see comment | 149 (2 RCTs) |
⊕⊕⊝⊝ low1 | data not comparable, no evidence for a difference one trial reported a median remission duration of 3 months for the GM‐CSF and 7 months for the placebo group; the other trial reported (HR 0.93, 95% CI 0.64 to 1.35; P = 0.71) |
||
| Time to progression to AML | see comment | not reported | ||||
| Quality of life | see comment | not reported | ||||
| Infections | see comment | 118 (1 RCT) |
⊕⊕⊝⊝ low1 | one trial provided data only, without evidence for a difference (RR 4.00, 95% CI 0.89 to 18.05; P = 0.07) | ||
| Serious adverse events | see comment | 149 (2 RCTs) |
⊕⊕⊝⊝ low1 | data not comparable, no evidence for a difference toxic death in one trial: (RR 1.20, 95% CI 0.39 to 3.72; P = 0.75) discontinuation due to toxicity in the other trial: (RR 5.76, 95% CI 0.32 to 102.44; P = 0.23) |
||
| Blood transfusions | see comment | 31 (1 RCT) |
⊕⊕⊝⊝ low1 | only one trial provided data, no evidence for a difference platelet transfusion independence: (RR 1.63, 95% CI 0.17 to 15.99; P = 0.68) red blood cell transfusion independence: (RR 2.47, 95% CI 0.11 to 56.03; P = 0.57) |
||
| *The basis for the assumed risk (e.g. the median control group risk across studies) is provided in footnotes. The corresponding risk (and its 95% confidence interval) is based on the assumed risk in the comparison group and the relative effect of the intervention (and its 95% CI). CI: Confidence interval; | ||||||
| GRADE Working Group grades of evidence High quality: Further research is very unlikely to change our confidence in the estimate of effect. Moderate quality: Further research is likely to have an important impact on our confidence in the estimate of effect and may change the estimate. Low quality: Further research is very likely to have an important impact on our confidence in the estimate of effect and is likely to change the estimate. Very low quality: We are very uncertain about the estimate. | ||||||
1Very small number of included patient and events leading to very high imprecision (downgraded 2 points)
Background
Description of the condition
Myelodysplastic syndromes (MDS) are a heterogeneous group of haematological diseases which are characterised by a uni‐ or multilineage dysplasia of haematological stem cells. These dysplasias result in anaemia, leukopenia or thrombocytopenia, but leukocytosis or thrombocytosis may also occur. Because of that, it is important to distinguish MDS from other haematological malignancies or even malnutrition (e.g. lack of iron, vitamin B12 deficiency).
MDS is described as a rare disease in people under the age of 50 years but represents a common haematopoietic disorder (a disorder of blood and bone marrow, thus a defect in proliferation and morphology of blood cells) in patients older than 70 years (Tefferi 2009). The overall incidence of myelodysplastic syndromes is about 7.1/100,000, while there is a sharp rise of incidence estimated at over 50/100,000 for people older than 70 years (SEER 2010).
Clinical presentation
Symptoms of MDS are unspecific and clinical presentation is determined by the lineage, which shows abnormal counts or morphology. Often patients present symptoms of anaemia such as fatigue, asthenia or dyspnoea. Signs of bleeding or infection are infrequently occurring symptoms. Thrombocytopenia or leukopenia rarely occur alone. Leukopenia is often combined with a granulocyte dysfunction; bacterial infections are predominant and are usually hard to treat (Williamson 1989). Thrombocytopenic patients show prolonged bleeding times.
Classification
The World Health Organization (WHO) classification system uses morphology, karyotype and clinical features (that is the presence of bone marrow blast percentage, clinical presentation such as anaemia, ringed sideroblasts in erythroid (red blood cell) precursors, bi‐ or pancytopenia, peripheral blood blasts, neutropenia, thrombocytopenia and the percentage of cytogenetic abnormalities) to discern the subtypes. These are refractory anaemia (RA), RA with ring sideroblasts (RARS), RA with excess blasts‐1 (RAEB‐1), RA with excess blasts‐2 (RAEB‐2), MDS with isolated del(5q) (5q‐syndrome), refractory cytopenia with multilineage dysplasia (RCMD), and unclassified myelodysplastic syndromes (for further details see Table 3) (Vardiman 2008). The formerly used classification system by the French American British Cooperative Group (FAB) is the predecessor of the current WHO classifications system and set the cut‐off to acute myeloid leukaemia (AML) at 30% blasts instead of 20% (WHO).
1. Types of myelodysplastic syndromes (MDS).
| Type | Bone marrow blasts, in percent | Clinical presentation | Cytogenetic abnormalities, in % |
| Refractory anaemia (RA) | < 5 | Anaemia | 25% |
| RA with ring sideroblasts (RARS) | < 5 | Anaemia, > 15% ringed sideroblasts in erythroid precursors | 5% to 20% |
| MDS with isolated del(5q) (5q‐syndrome) | < 5 | Anaemia, normal platelets | 100% |
| Refractory cytopenia with multilineage dysplasia (RCMD) | < 5 | Bicytopenia or pancytopenia ± 15 ring sideroblasts | 50% |
| Refractory anaemia with excess blasts‐1 (RAEB‐1) | 5 ‐ 9 | Cytopenia ± peripheral blood blasts (< 5%) | 30% to 50% |
| Refractory anaemia with excess blasts‐2 (RAEB‐2) | 10 ‐ 19 | Cytopenia, peripheral blood blasts present | 5% 70% |
| Myelodysplastic syndrome, unclassified | < 5 | Neutropenia or thrombocytopenia | 50% |
Prognosis
To evaluate the prognosis of MDS, the established International Prognostic Scoring System (IPSS) can be used. The score, counting from 0 to 3.5, depends on bone marrow blast percentage, karyotype and cytopenias. According to this score, MDS can be divided into four risk groups of low risk (0), intermediate‐1 risk (0.5 to 1), intermediate‐2 risk (1.5 to 2), and high risk (2.5 to 3.5). These prognostic groups differ in terms of median survival (5.7, 3.5, 1.2 and 0.4 years) as well as in the risk of progression to AML (Greenberg 1997). Twenty‐five per cent of patients with MDS progress to AML in 9.4, 3.3, 1.1 and 0.2 years, respectively (Greenberg 1997).
Description of the intervention
Patients with clinically relevant cytopenia can be stratified into two major risk groups, the relatively lower risk patients (IPSS: low risk, INT‐1‐risk) and the higher risk patients (IPSS: high risk, INT‐2‐risk) (Bowen 2003; NCCN 2012). In lower risk patients (IPSS: low risk, INT‐1 risk) supportive care is the main treatment option, but the administration of additional treatment with hypomethylation agents or immunosuppressive therapy might be considered (Buckstein 2011; Fey 2010; Gotze 2010; NCCN 2012; Santini 2010). Higher risk (IPSS: high risk, INT‐2 risk) patients with MDS should receive allogenic (from a matching donor) stem cell transplantation (alloSCT), which is the only curative treatment for patients with MDS. If they are not eligible for alloSCT (due to the patient's age, performance status and presence of major co‐morbid conditions) or lacking an available donor, there are different recommended alternatives that include hypomethylating agents, other low intensive chemotherapeutics and high intensive chemotherapy regimens, with or without autologous (patient's own) stem cell transplantation (Buckstein 2011; Fey 2010; Gotze 2010; NCCN 2012; Santini 2010).
Supportive care, meaning red blood cell or platelet transfusions, antibiotics and haematopoietic growth factors should be provided for all patients with MDS (Bowen 2003; Fey 2010; NCCN 2012; Santini 2010). The administration of erythropoiesis‐stimulating agents (ESA), either alone or in combination with granulocyte colony‐stimulating factors (G‐CSF), has been studied in MDS patients with anaemia (Balleari 2006). The trial indicated that the combination of ESA and G‐CSF is more effective than ESA alone in terms of response and quality of life (Balleari 2006). Further non‐randomised trials support the suggestion that there might be a synergetic erythropoietic activity of the combination of ESA and G‐CSF or granulocyte‐macrophage colony‐stimulating factors (GM‐CSF) (Economopoulos 1999; Hansen 1993; Mantovani 2000). Guidelines recommend the combined administration of ESA and G‐CSF for 1). MDS patients with more than 15% ringed sideroblasts and serum erythropoietin levels under 500 mU/mL; 2). MDS patients with less than 15% ringed sideroblasts, who did not respond to erythropoietin alone; and 3). MDS patients with symptomatic anaemia and serum erythropoietin levels below 500 mU/mL (NCCN 2012; Santini 2010).
Furthermore, G‐CSF and GM‐CSF compared to no treatment have been shown to be effective in the treatment of neutropenic MDS patients, by increasing the neutrophil counts (Bernasconi 1998a; Ossenkoppele 1999a; Schuster 1995a; Verbeek 1999a; Zwierzina 2005a). Therefore, the administration of either G‐CSF or GM‐CSF is recommended for treatment of neutropenic MDS patients with resistant bacterial infections (Bowen 2003; NCCN 2012; Smith 2006), but not for routine infection prophylaxis (NCCN 2012).
How the intervention might work
In 1994 it was shown that mice lacking G‐CSF have about 70% lower neutrophil levels, as well as lower granulocyte and macrophage progenitor cell levels. Administration of G‐CSF made these levels equal to those in healthy mice (Lieschke 1994). This shows that G‐CSF is essential for a working haematopoiesis of these cell lines. To be more exact, G‐CSF induces the proliferation and survival of myeloid progenitor cells followed by subsequent cell‐cycle arrest and neutrophilic differentiation, which is important in acute bacterial infections (Beekman 2010). Furthermore, in patients with MDS receiving chemotherapy, G‐CSF enhances proliferation in leukaemic cells and makes them more vulnerable to the cytostatic agents. In this way, G‐CSF works as a chemo‐sensitiser (Gerhartz 1992a; Greenberg 1993). GM‐CSF shows similar effects to G‐CSF. While GM‐CSF seems to be more active and shows more direct and indirect effects on neutrophil function, G‐CSF is more selective in its stimulation. In addition, G‐CSF causes fewer side effects in the clinical setting. Apparently G‐CSF circulates in blood vessels and stimulates neutrophils. GM‐CSF stays in the tissues involved in acute infection, holding and activating effector cells (Rapoport 1992).
Why it is important to do this review
Based on published trials, G‐CSF or GM‐CSF might be an effective supportive treatment option for patients with MDS (Gerhartz 1994a; Ossenkoppele 1999a; Verbeek 1999a; Zwierzina 2005a). A meta‐analysis summarising the effect of G‐CSF and GM‐CSF in patients with malignant lymphoma failed to show statistically significant results regarding infection‐dependent mortality, improved complete remission or improved overall survival (Bohlius 2003), but a meta‐analysis examining clinically relevant outcome effects of G‐CSF and GM‐CSF with respect to MDS is still lacking. The evidence is needed for decisions at individual patient level as well as for decisions in the healthcare system. Therefore, a systematic review and meta‐analysis will summarise best available evidence to clarify the role of these agents and will also examine differences of treatment effectiveness caused by population group or the agent. Another relevant outcome for patients with MDS is quality of life.
Objectives
The objective of this review is to assess the evidence for the treatment of MDS patients with G‐CSF and GM‐CSF in addition to standard therapy in comparison to the same standard therapy or the same standard therapy and placebo.
Methods
Criteria for considering studies for this review
Types of studies
We considered only randomised controlled trials (RCTs) as primary studies in this review and meta‐analysis. We included both full‐text and abstract publications. Randomisation is the best way to prevent systematic differences between the baseline characteristics of participants in the two relevant intervention groups in terms of both known and unknown (or unmeasured) confounders (O'Connor 2011). We did not include cross‐over studies or quasi‐randomised trials.
Types of participants
We included studies concerning all risk groups. Participants were diagnosed with MDS. Had trials included patients with different haematological malignancies, we would have used the data from the MDS subgroups. In our protocol, we pre‐specified that if we were unable to obtain the relevant subgroup data from the author of such a trial, we would exclude the trial if less than 80% of patients had MDS.
We did not include studies concerning the use of growth factors in patients with AML.
Types of interventions
We assessed G‐CSF and GM‐CSF in separate analyses.
We considered the following comparisons:
G‐CSF or GM‐CSF versus no treatment or placebo;
Erythropoiesis‐stimulating agents (ESA) + G‐CSF or GM‐CSF versus ESA + no treatment or placebo (same ESA treatment in both arms);
Chemotherapy + G‐CSF or GM‐CSF versus chemotherapy + no treatment or placebo (same chemotherapy in both arms).
Patients' chemo‐therapeutic treatment as well as additional supportive care (for example, blood products, antibiotics) had to be equal in both arms, except for the use of G‐CSF and GM‐CSF.
Types of outcome measures
This review addressed patient‐relevant outcomes such as overall and progression‐free survival as well as toxicity and quality of life. Additionally, response to therapy was assessed as a meaningful outcome that is of clinical importance. Definitions of the primary and secondary outcomes were as follows.
Primary outcomes
Overall survival (OS) was the primary outcome due to its relevance to patients with MDS and its importance as an indicator of the benefits of an intervention. OS was defined as the time interval from random treatment assignment or entry into a study to death from any cause or to last follow‐up.
Secondary outcomes
Progression‐free survival (PFS) was defined as the time interval from random treatment assignment or entry into the study to first confirmed progression or relapse, death from any cause or the last follow‐up (in addition, we assessed the definition of progression provided by the publication)
Time to progression to acute myeloid leukaemia (AML)
Tumour response to additional chemotherapy (complete response (CR) and partial response (PR))
Incidence and duration of neutropenia
Incidence and duration of infections
Incidence and duration of anaemia
Adverse events (i.e. all adverse events of WHO grade III or IV; serious adverse events)
Incidence of blood product transfusions (i.e. red blood cell transfusion, platelet transfusion, granulocyte transfusion)
Incidence and duration of antibiotic treatment
Hospitalisation
Quality of life data (QoL) were summarised if available and measured with reliable and valid instruments
Search methods for identification of studies
Electronic searches
Search strategies have been adapted from those suggested in the Cochrane Handbook for Systematic Reviews of Interventions (Lefebvre 2011). No language restriction was applied to reduce the language bias.
We searched the following databases of medical literature.
Cochrane Central Register of Controlled Trials (CENTRAL) 3 December 2015 (Appendix 1).
MEDLINE (1950 to 3 December 2015) (Appendix 2).
Searching other resources
We searched the following conference proceedings (from 2000 up to 2015 (see below) if they were not included in CENTRAL.
American Society of Hematology (ASH).
American Society of Clinical Oncology (ASCO).
European Hematology Association (EHA).
European Society of Medical Oncology (ESMO).
We electronically searched the following databases of ongoing trials.
Metaregister of controlled trials: http://www.controlled‐trials.com/mrct/.
EU clinical trials register: https://www.clinicaltrialsregister.eu/ctr‐search/search.
Clinicaltrials.gov: https://clinicaltrials.gov/.
Data collection and analysis
Selection of studies
After the first review of all titles and abstracts of the identified studies from the above sources, two review authors (FH, NS) independently rejected all studies that were clearly ineligible. We assessed selected studies by using an eligibility form regarding study design and compliance with inclusion criteria. The forms contained the following questions.
Is the study described as randomised?
Were the participants previously untreated?
Were the patients diagnosed with myelodysplastic syndrome?
Were the patients in the intervention group treated with G‐CSF or GM‐CSF?
Were the patients in the control group treated with placebo or no treatment?
We pre‐specified that if there was any doubt regarding eligibility, review authors would obtain the full‐text publication and make a decision on inclusion (preferably including studies rather than losing relevant data). According to PRISMA, we used a flow diagram to show numbers of identified records, excluded articles and included studies (Moher 2009).
Data extraction and management
Two review authors (FH, NS) independently extracted data according to Chapter seven of the Cochrane Handbook for Systematic Reviews of Interventions (Higgins 2011b) by using a standardised data extraction form containing the following items.
General information: author, title, source, publication date, country, language, duplicate publications.
Assessments of risk of bias: sequence generation, allocation concealment, blinding (participants, personnel, and outcome assessors), incomplete outcome data, selective outcome reporting, other sources of bias.
Study characteristics: trial design, aims, setting and dates, source of participants, inclusion and exclusion criteria, comparability of groups, subgroup analysis, statistical methods, power calculations, treatment cross‐overs, compliance with assigned treatment, length of follow‐up, time point of randomisation.
Participant characteristics: age; gender; number of participants recruited, allocated, evaluated; participants lost to follow‐up; stage of disease; type of International Prognostic Scoring System (IPSS); type of MDS.
Interventions: setting, dose and duration of G‐CSF and GM‐CSF treatment, type of (multi‐agent) chemotherapy (intensity), supportive treatment.
Outcomes: OS, PFS, tumour response, quality of life, adverse events, incidence and duration of neutropenia, infections and anaemia, incidence of blood product transfusion, incidence and duration of antibiotic treatment, hospitalisation, progression to AML.
Assessment of risk of bias in included studies
To assess the risk of bias we used a questionnaire, according to the recommendations in Chapter eight of the Cochrane Handbook for Systematic Reviews of Interventions, for the following criteria (Higgins 2011):
sequence generation;
allocation concealment;
blinding (participants, personnel, outcome assessors);
incomplete outcome data;
selective outcome reporting;
other sources of bias.
For every criterion a judgement was made using one of three categories.
'Low risk': if the criterion is adequately fulfilled in the study, i.e. the study is at a low risk of bias for the given criterion.
'High risk': if the criterion is not fulfilled in the study, i.e. the study is at high risk of bias for the given criterion.
'Unclear': if the study report does not provide sufficient information to allow for a judgement of 'high risk' or 'low risk' or if the risk of bias is unknown for one of the criteria listed above.
Measures of treatment effect
For binary outcomes, we calculated risk ratios (RR) with 95% confidence intervals (CI) for each trial. If incidence outcomes were reported as rate ratios by different trials, we combined logarithms of the rate ratios across studies using the generic inverse‐variance method. Furthermore, we assessed whether the primary authors using rate ratios corrected the standard error for multiple events within the same patient. If available, we planned to calculate continuous outcomes as standardised mean difference (SMD). For time‐to‐event outcomes we extracted the hazard ratio (HR) from published data according to Parmar 1998 and Tierney 2007.
Dealing with missing data
As suggested in Chapter 16 of the Cochrane Handbook for Systematic Reviews of Interventions (Higgins 2011c), there are many potential sources of missing data which should be taken into account at: study level; outcome level; summary data level; individual level; study‐level characteristics (for example, for subgroup analysis). Firstly, it is important to distinguish the difference between 'missing at random' and 'not missing at random'.
For data assumed to be missing at random, we analysed only the available data (that is ignoring the missing data).
Where data were assumed not to be missing at random, we imputed the missing data with replacement values and treated these as if they were observed (for example last observation carried forward, imputing an assumed outcome such as assuming all were poor outcomes, imputing the mean, imputing based on predicted values from a regression analysis).
Assessment of heterogeneity
We assessed heterogeneity of treatment effects between trials by using a Chi2 test with a significance level at P < 0.1. We used the I² statistic to quantify possible heterogeneity (30% < I² < 75%: moderate heterogeneity, 75% < I²: considerable heterogeneity) (Deeks 2011).
Assessment of reporting biases
Had there been at least 10 or more trials in the meta‐analysis, we planned to explore potential publication bias by generating a funnel plot and applying a statistical test by means of a linear regression test. A P value less than 0.1 would have been considered significant for this test (Sterne 2011). However, we never included more than two trials in one meta‐analysis so this test was not done.
Data synthesis
We performed analyses according to the recommendations in Chapter nine of the Cochrane Handbook for Systematic Reviews of Interventions (Deeks 2011). We used aggregated data for analysis. For statistical analysis, we entered data into the Cochrane statistical package Review Manager (RevMan 5.3). One review author entered data into the software and a second review author checked it for accuracy. We performed meta‐analyses using a fixed‐effect model (for example the generic inverse variance method for survival data outcomes and Mantel‐Haenszel method for dichotomous data outcomes).
In the original protocol, we did not pre‐specify patient‐relevant outcomes for 'Summary of findings' tables and decided to present OS, PFS, progression to AML, quality of life, infections, serious adverse events and blood transfusions as the most important outcomes. The 'Summary of findings' tables summarise the grade of evidence of the outcomes reported according to the principles of the GRADE system (Schünemann 2011).
Subgroup analysis and investigation of heterogeneity
We planned to assess heterogeneity of treatment effects between trials by using a Chi² test with a significance level at P < 0.1. We also planned to use the I² statistic to quantify possible heterogeneity. Unfortunately, data were too sparse to perform the intended subgroup analyses on the following characteristics.
Different risk types of MDS (classified according to IPSS, i.e. low risk, intermediate‐I versus intermediate‐II and high risk).
Different types of additional agents (e.g. no other additional agent versus ESA versus other chemotherapeutics).
Age (≤ 70 years versus older than 70 years).
However, none of the included studies provided data concerning those subgroups, so we did not perform any subgroup analysis or investigation of heterogeneity.
Sensitivity analysis
We analysed random‐effects modelling for the comparison GM‐CSF versus placebo for outcomes with at least two included trials. Data were too sparse to evaluate influence of risk of bias, full‐text publications versus abstracts and preliminary results versus mature results in sensitivity analyses.
Results
Description of studies
Results of the search
We identified 566 potentially relevant references through database searches and handsearching. Of these, 521 were excluded at the initial stage of screening because they did not fulfil our predefined inclusion criteria. The remaining 45 publications were retrieved as full‐text publications or abstract publications for detailed evaluation. Of these 45 publications, we excluded 28 publications and identified seven included trials (15 publications) and two ongoing trials (two publications) that fulfil the predefined inclusion criteria. Mantovani 1996 published an abstract with preliminary results reported only cumulative results about 37 included patients, which did not provide enough information to be analysed in the meta‐analysis (Mantovani 1996).
The overall number of references screened, identified, selected, excluded and included are documented according to the PRISMA flow diagram (Figure 1).
1.
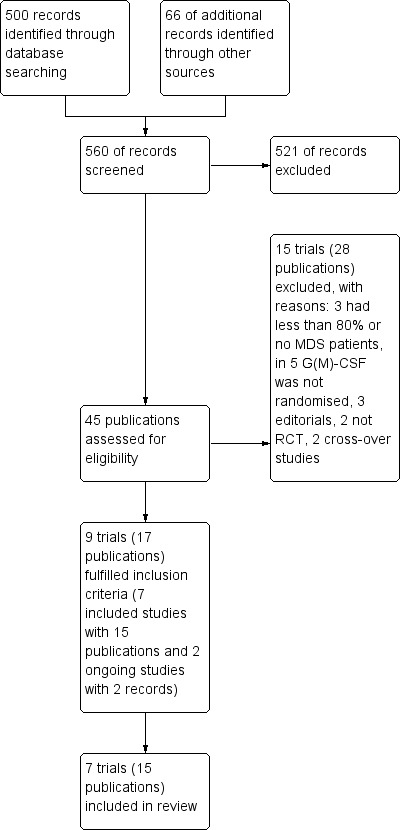
Study flow diagram.
We contacted two authors (Bernasconi 1998; Estey 1999) for subgroup data, since they included less than 80% of patients with MDS. No further data were provided. We contacted Mantovani 1996 and the investigators of the ongoing studies (04/Q1907/94; REGIME) for final data. Mantovani 1996 did not provide final data. The REGIME trial was terminated early due to withdrawal of pharmaceutical support, without publishing data relevant for this review. We received some information from the principal investigator, however, without any data for the arm G‐CSF in addition to standard care compared with standard care only.
Included studies
We performed two main analyses. The first main analysis (G‐CSF alone, in combination with ESA or chemotherapy (CT) versus no therapy or placebo, ESA alone or CT alone, respectively) included five trials with 337 patients in the main meta‐analyses of this review (Balleari 2006; Greenberg 1993; Mantovani 1996; Ossenkoppele 1999; Taieb 1998). The second main analysis (GM‐CSF alone, in combination with ESA or CT versus no therapy or placebo, ESA alone or CT alone, respectively) included two trials with 149 participants (Verbeek 1999; Zwierzina 2005).
We included seven trials (Balleari 2006; Greenberg 1993; Mantovani 1996; Ossenkoppele 1999; Taieb 1998; Verbeek 1999; Zwierzina 2005) in the review. We extracted data from full‐text publications for four trials (Balleari 2006; Ossenkoppele 1999; Verbeek 1999; Zwierzina 2005). For three trials we extracted from abstract publications (Greenberg 1993; Mantovani 1996; Taieb 1998).
See also the table Characteristics of included studies.
Design
Five included trials were two‐armed randomised controlled trials (RCTs); the other two trials were three‐armed (Mantovani 1996; Zwierzina 2005).
Balleari 2006 recruited patients from 2001 to 2003, Ossenkoppele 1999 from 1992 to 1995, Taieb 1998 from 1994 to 1997, Verbeek 1999 from 1990 to 1995 and Zwierzina 2005 from 1991 to 1995. Greenberg 1993 and Mantovani 1996 did not provide dates on trial recruitment.
Sample size
The smallest trial (Balleari 2006), randomised 30 patients and the largest three‐armed trial 201 patients (Zwierzina 2005). We included data from the two eligible arms of this trial (118 patients).
Location
One included trial was conducted in the USA (Greenberg 1993). The other trials were conducted in Italy (Balleari 2006), Germany (Mantovani 1996), The Netherlands (Ossenkoppele 1999), and France Taieb 1998). Verbeek 1999 was conducted in Germany and the USA. One trial did not report the country of recruitment (Zwierzina 2005).
Participants
The trials included a total of 486 male and female randomised patients with at least 80% having histologically proven MDS. Five trials evaluated the use of G‐CSF (Balleari 2006; Greenberg 1993; Mantovani 1996; Ossenkoppele 1999; Taieb 1998). Two trials used GM‐CSF as growth factor (Verbeek 1999; Zwierzina 2005).
Interventions
All included trials were conducted in an unconfounded design. One trial evaluated G‐CSF in addition to erythropoietin (Balleari 2006). One trial evaluated G‐CSF versus no further therapy and observation (Greenberg 1993). One trial evaluated G‐CSF in addition to supportive care (Mantovani 1996). Two trials assessed the role of G‐CSF in addition to chemotherapy (Ossenkoppele 1999: daunomycin and cytarabine; Taieb 1998: low‐dose cytarabine). Two trials compared the effects of GM‐CSF in addition to chemotherapy (Verbeek 1999: cytarabine and mitoxantrone; Zwierzina 2005: cytarabine).
Primary outcome measure
Five trials analysed overall survival (OS) (Greenberg 1993; Mantovani 1996; Ossenkoppele 1999; Verbeek 1999; Zwierzina 2005). Balleari 2006 and Taieb 1998 did not assess this outcome.
Secondary outcome measures
Secondary outcomes were reported by the following studies.
Progression‐free survival (PFS): Ossenkoppele 1999; Verbeek 1999; Zwierzina 2005
Time to progression to AML: Greenberg 1993; Mantovani 1996; Ossenkoppele 1999; Zwierzina 2005
-
Tumour response to additional chemotherapy
complete response (CR): Ossenkoppele 1999; Verbeek 1999; Zwierzina 2005
partial response (PR): Ossenkoppele 1999; Zwierzina 2005
Adverse events: Greenberg 1993; Mantovani 1996; Ossenkoppele 1999; Verbeek 1999; Zwierzina 2005
Incidence and duration of neutropenia: Greenberg 1993; Ossenkoppele 1999; Taieb 1998; Verbeek 1999
Incidence and duration of infections: Ossenkoppele 1999; Taieb 1998; Verbeek 1999; Zwierzina 2005
Incidence and duration of anaemia: Balleari 2006
Incidence of blood product transfusions: Balleari 2006; Mantovani 1996; Ossenkoppele 1999; Verbeek 1999
Incidence and duration of antibiotic treatment: Ossenkoppele 1999
Hospitalisation: Ossenkoppele 1999
Quality of life data (QoL): Balleari 2006
Conflict of interest
The research of Ossenkoppele 1999 was supported, in part, by a grant from AMGEN.
The trial conducted by Zwierzina 2005 was funded in part by an educational grant from Sandoz/Novartis and by grant numbers 5U10‐CA11486‐20 through 5U10‐CA11486‐35 from the National Cancer Institute.
The other publications did not provide information on conflicts of interests or received funding (Balleari 2006; Greenberg 1993; Taieb 1998; Verbeek 1999).
Excluded studies
We excluded a total of 15 trials after detailed evaluation of full‐text publications. The main reasons for exclusion were:
two non‐randomised comparisons or reviews (Gotlib 2009; Terpos 2000)
two RCTs, but patients in both arms received GM‐CSF (Gerhartz 1994; Thompson 1995)
one RCT randomised erythropoietin (EPO) (Greenberg 2009)
two trials administered G‐CSF and EPO in one arm and no agent in the other (Bowen 2004; Bowen 2006)
two RCTs allowed cross‐over, both are abstract publications only without results for each arm of the entire trials before crossing over (Schuster 1995; Schuster 1989)
three publications were editorials (Miller 1998; Stasi 2004; Willemze 1992)
three RCTs included less than 80% MDS (Bernasconi 1998; Estey 1999; Hast 2003)
These publications are described under Characteristics of excluded studies.
Risk of bias in included studies
Overall, the risk of bias of included trials is hard to judge. Two included trials are published as abstracts only (Mantovani 1996; Taieb 1998), therefore we were not able to assess the potential risk of bias for these trials in detail. In addition, most of the full‐text publications did not provide detailed information on study design and potential sources of bias (Balleari 2006; Greenberg 1993; Ossenkoppele 1999). Only two trials provided detailed information. One can be judged as high quality (Verbeek 1999), the other as moderate quality (Zwierzina 2005). For more information see 'Risk of bias' tables of the individual included trials, and for an overview of the results please see Figure 2 and Figure 3.
2.
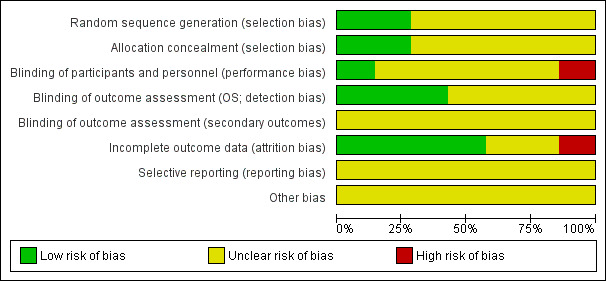
'Risk of bias' graph: review authors' judgements about each risk of bias item presented as percentages across all included studies.
3.
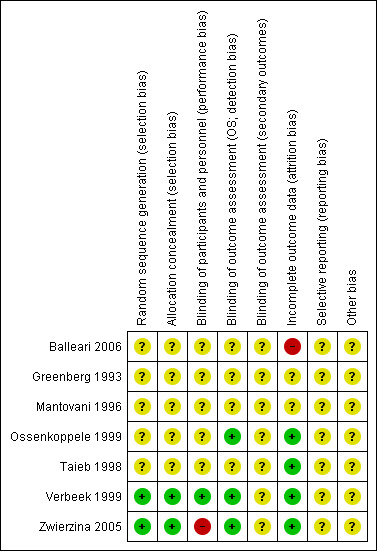
'Risk of bias' summary: review authors' judgements about each risk of bias item for each included study.
Allocation
All trials stated that they were randomised. In two trials the random sequence generation was adequate (Zwierzina 2005; Verbeek 1999). No information was available for the other trials. Therefore we judged the other trials as "unclear" for random sequence generation as well as allocation concealment.
Blinding
One trial was designed in a double‐blinded fashion and thus was judged "low risk" in terms of performance bias (Verbeek 1999). In one trial neither the patients nor the staff were blinded, thus we judged the performance bias as "high risk" (Zwierzina 2005). All the other trials did not provide information regarding blinding and were therefore judged as "unclear". Results with respect to OS were judged not to be influenced by this source of bias, because to define the status of a patient as dead or alive is not a question of individual judgement, therefore we judged the risk of bias for the three trials that assessed OS as "low". One trial provided information regarding the blinding of the outcome assessor (Zwierzina 2005). All bone marrow and blood smears at entry and restaging were sent for blinded pathology review in this case. However, blinding of the outcome assessor for the other secondary outcomes was not mentioned, therefore we judged the risk of detection bias of secondary outcomes as "unclear". All the other trials did not provide information on blinding of the outcome assessor of secondary outcomes and were also judged as "unclear".
Incomplete outcome data
Two trials published as full‐texts and one abstract publication included all randomised patients in the analysis (Ossenkoppele 1999; Taieb 1998; Verbeek 1999). In Zwierzina 2005, missing outcome data were balanced in numbers across intervention groups, with similar reasons for missing data across groups. We judged the risk of attrition bias for these studies as "low".
Two trials published as abstracts only, provided no information regarding missing data, therefore we judged the risk of attrition bias for these trials as "unclear" (Greenberg 1993; Mantovani 1996).
One trial (Balleari 2006), was judged as "high risk" because at least QoL outcome data were incomplete. A Fact‐An Assessment was obtained only 60% of patients (18/30) after two months and 43% (13/30) after four months.
Selective reporting
For six studies there was no study protocol available (Balleari 2006; Greenberg 1993; Mantovani 1996; Ossenkoppele 1999; Taieb 1998; Verbeek 1999). The online information of the EORTC‐06903 protocol (Zwierzina 2005) does not include predefined outcomes. Therefore, we judged the risk of reporting bias of all trials as "unclear".
Other potential sources of bias
No other sources of bias were identified.
Effects of interventions
G‐CSF in addition to standard therapy versus standard therapy alone
Five RCTs (N = 337) evaluated the efficacy and safety of G‐CSF (Balleari 2006; Greenberg 1993; Mantovani 1996; Ossenkoppele 1999; Taieb 1998).
Mantovani 1996 did not report outcome data for the intervention and control groups separately. For overall results see Table 1
Primary outcome: Overall survival (OS)
Only one trial (Ossenkoppele 1999) reported of "longer median overall survival in the filgrastim arm" with no statistical significant difference (P = 0.22). Ossenkoppele included 33 patients in the G‐CSF arm, 31 in the control arm. (hazard ratio (HR) 0.80, 95% confidence interval (CI) 0.44 to 1.47; P = 0.48) (see Analysis 1.1).
1.1. Analysis.
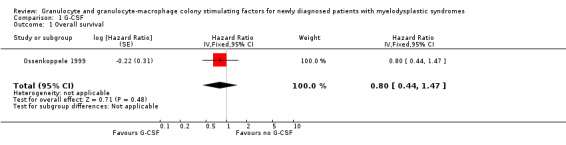
Comparison 1 G‐CSF, Outcome 1 Overall survival.
Secondary outcome: Progression‐free survival (PFS)
Ossenkoppele 1999 (N = 64) assessed event‐free survival. No statistically significant difference was shown between the study arms (P = 0.13).
Secondary outcome: Time to progression to acute myeloid leukaemia (AML)
Greenberg 1993 stated there was no statistically significant difference regarding time to progression to AML between both arms (50 patients in the G‐CSF arm, 52 in the observation arm, P = 0.7).
Mantovani 1996 found no evidence that treatment with G‐CSF +/‐ EPO altered the time to AML.
Ossenkoppele 1999 did not report time to progression to AML, but the number of patients progressing to AML.One of 33 patients in the G‐CSF + chemotherapy arm compared to two of 31 in the chemotherapy arm developed AML in this trial (risk ratio (RR) 0.47, 95% CI 0.04 to 4.92; P = 0.53) (see Analysis 1.2).
1.2. Analysis.
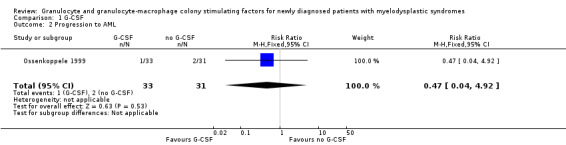
Comparison 1 G‐CSF, Outcome 2 Progression to AML.
Secondary outcome: Complete response (CR)
A total of 24 of 33 patients in the G‐CSF + chemotherapy arm compared to 16 of 31 in the chemotherapy arm had CR in the Ossenkoppele 1999 trial (RR 1.41, 95% CI 0.94 to 2.10; P = 0.09) (see Analysis 1.3).
1.3. Analysis.
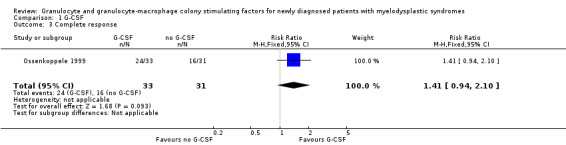
Comparison 1 G‐CSF, Outcome 3 Complete response.
Secondary outcome: Partial response (PR)
A total of three of 33 patients in the G‐CSF + chemotherapy arm compared to four of 31 in the chemotherapy arm had PR in the Ossenkoppele 1999 trial (RR 0.70, 95% CI 0.17 to 2.90; P = 0.63) (see Analysis 1.4).
1.4. Analysis.
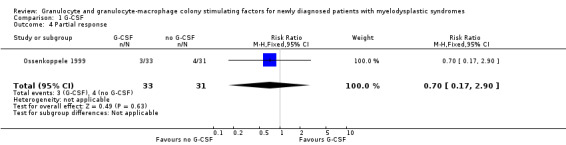
Comparison 1 G‐CSF, Outcome 4 Partial response.
Secondary outcome: Incidence and duration of neutropenia
Ossenkoppele 1999 (N = 64) reported reduced duration of neutropenia of 23 days in the G‐CSF + chemotherapy arm compared to 35 days in the chemotherapy arm. The difference was considered significant (P = 0.015).
According to Taieb 1998 there was a median increase of neutrophil count of 1.5x10⁹/L for the G‐CSF + chemotherapy arm (52 patients) and median decrease of neutrophil count of 0.04x10⁹/L for the chemotherapy arm (51 patients). The difference was stated to be statistically significant (P = 0.0001).
The incidence of neutropenia was not addressed in any of the studies.
Secondary outcome: Incidence and duration of infections
A total of 10 of 33 patients in the G‐CSF + chemotherapy arm compared to six of 31 in the chemotherapy arm had infections (grade three or four) in the Ossenkoppele 1999 trial (RR 1.57, 95% CI 0.65 to 3.80; P = 0.032) (see Analysis 1.5).
1.5. Analysis.
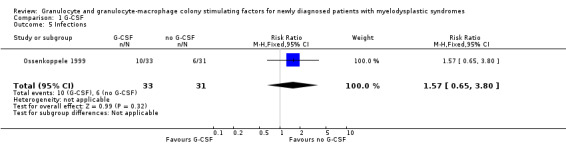
Comparison 1 G‐CSF, Outcome 5 Infections.
Taieb 1998 reported of 28 of 52 patients in the G‐CSF arm and 32 of 51 patients in the chemotherapy arm with infections. Unfortunately, the authors did not provide any information regarding the severity or duration of the infections.
Ossenkoppele 1999 reported the median duration of fever as six days (range: one to 23 days) in the G‐CSF arm compared to seven days (range: one to 21 days) in the control arm, but reported no P value.
Secondary outcome: Incidence and duration of anaemia
Balleari 2006 reported a major erythroid response occurring in six of 15 patients in the G‐CSF arm and three of 15 patients in the supportive care arm (RR 2.00, 95% CI 0.61 to 6.55; P = 0.25). Major erythroid response was defined as an increase in haemoglobin (Hb) >2 g/dL, or transfusion independence for previously transfusion‐dependent patients. The incidence and duration of anaemia were not reported.
Secondary outcome: Adverse events
None of the publications reported serious, severe (WHO grade III or IV) or adverse events besides those events mentioned above.
Secondary outcome: Incidence of blood product transfusions (i.e. red blood cell transfusion, platelet transfusion, granulocyte transfusion)
Ossenkoppele 1999 (N = 64) reported the median number of platelet transfusions administered to patients in the G‐CSF + chemotherapy group (nine (range three to 67)) and chemotherapy group (eight (range four to 78)). The average number of red blood cell transfusions was 12 in both groups.
The incidence of blood product transfusions was not addressed.
Secondary outcome: Incidence and duration of antibiotic treatment
Ossenkoppele 1999 (N = 64) reported, that there was no difference in duration of antibiotic use in both groups. Median number of days in G‐CSF + chemotherapy group was 13 (range one to 40) and 15 (range eight to 30) in the chemotherapy group.
The incidence of antibiotic treatment was not addressed in any of the included studies.
Secondary outcome: Hospitalisation
In the Ossenkoppele 1999 trial, there was no difference in duration of hospitalisation between groups. Median number of days in G‐CSF + chemotherapy group was 32 (range eight to 90) and 32 (range 14 to 72) in the chemotherapy group.
Secondary outcome: Quality of life data
Balleari 2006 assessed quality of life, but data from the two arms were not reported separately.
Subgroup and sensitivity analysis
We did not perform any subgroup or sensitivity analyses, because the trials that reported results did not provide data of age or IPSS subgroups, nor did they differ regarding types of additional agents.
GM‐CSF in addition to standard therapy versus standard therapy alone
Verbeek 1999 included 31 participants and assessed the use of GM‐CSF in combination with high‐dose chemotherapy in a double‐blinded fashion.
Zwierzina 2005 assessed GM‐CSF in combination with low‐dose chemotherapy. The three‐armed trial included 201 participants, with 118 patients included in this systematic review. For overall results see Table 2.
Primary outcome: Overall survival (OS)
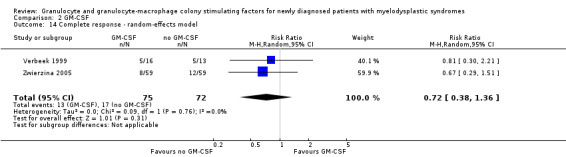
Our meta‐analysis included both studies with 149 participants and showed no evidence for a difference between both arms (HR 0.88, 95% CI 0.62 to 1.26, P = 0.49) (see Analysis 2.1). Sensitivity analysis using the random‐effects model did not lead to differing results (HR 0.88, 95% CI 0.62 to 1.26, see Analysis 2.13).
2.1. Analysis.
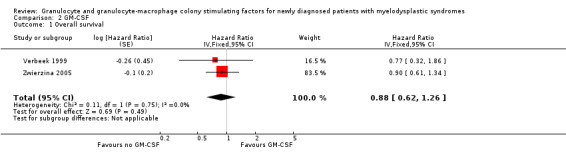
Comparison 2 GM‐CSF, Outcome 1 Overall survival.
2.13. Analysis.
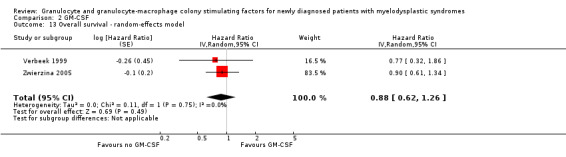
Comparison 2 GM‐CSF, Outcome 13 Overall survival ‐ random‐effects model.
Secondary outcome: Progression‐free survival (PFS)
Verbeek 1999 reported a median remission duration of three months (87 days; N = 5; range: 2.5 to 46 months) for the GM‐CSF (16 patients) and seven months (221 days; N = 5; 3.5 to 14 months) for the placebo group (15 patients).
Within the Zwierzina 2005 trial, the assessment of PFS showed no statistically difference between both arms (HR 0.93, 95% CI 0.64 to 1.35; P = 0.71) with 59 patients in the GM‐CSF arm and 59 in the chemotherapy arm) (see Analysis 2.2).
2.2. Analysis.
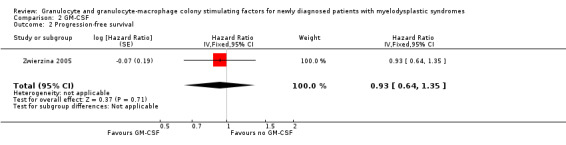
Comparison 2 GM‐CSF, Outcome 2 Progression‐free survival.
Secondary outcome: Time to progression to AML
Time to progression to AML was not reported by any of the included studies. The absolute number of patients progressing reported by Zwierzina 2005 did not differ statistically significant in both groups (seven of 59 patients in the GM‐CSF + chemotherapy versus eight of 59 patients in the chemotherapy arm, RR 0.88, 95% CI 0.34 to 2.26; P = 0.78).
Secondary outcome: Complete response (CR)
CR data were available from both trials (Verbeek 1999; Zwierzina 2005). The meta‐analysis included 147 participants. The main analysis of CR showed no evidence for a difference between patients receiving GM‐CSF and those without GM‐CSF favouring chemotherapy alone (RR 0.71, 95% CI 0.38 to 1.35; P = 0.30) (see Analysis 2.3). Similar results were obtained in the sensitivity analysis using the random‐effects model (RR 0.72, 95% CI 0.38 to 1.36, see Analysis 2.14).
2.3. Analysis.
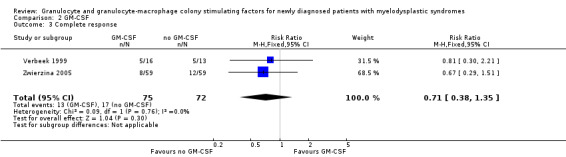
Comparison 2 GM‐CSF, Outcome 3 Complete response.
2.14. Analysis.
Comparison 2 GM‐CSF, Outcome 14 Complete response ‐ random‐effects model.
Secondary outcome: Partial response (PR)
In the Zwierzina 2005 trial, altogether seven of 59 patients in GM‐CSF + chemotherapy arm as well as seven of 59 in the chemotherapy arm achieved PR (RR 1.00, 95% CI 0.37 to 2.67; P = 1.00) (see Analysis 2.4).
2.4. Analysis.
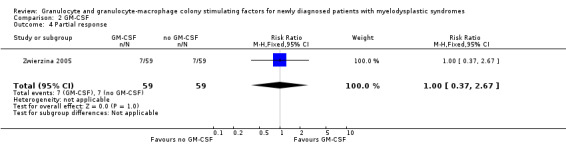
Comparison 2 GM‐CSF, Outcome 4 Partial response.
Secondary outcome: Incidence and duration of neutropenia
The median duration of granulocytopenia reported by Verbeek 1999 was 33 days in the GM‐CSF and 35 days in the placebo arm. The incidence of neutropenia was not reported.
Secondary outcome: Incidence and duration of infections
A total of eight of 59 patients in the GM‐CSF + chemotherapy arm compared to two of 59 in the chemotherapy arm (RR 4.00, 95% CI 0.89 to 18.05; P = 0.07) had infections in the Zwierzina 2005 trial (Analysis 2.5).
2.5. Analysis.
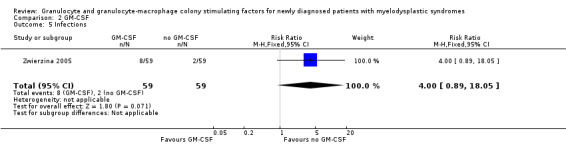
Comparison 2 GM‐CSF, Outcome 5 Infections.
Verbeek 1999 reported that the early death rate was high (34.5%) and mainly related to infections (eight out of 10 cases). Occurence was 44% in the GM‐CSF group (44%) compared to 23% in the placebo group (P = 0.22). In all patients 14 cases of infections WHO grade III or IV occurred. No further information regarding infection was reported. Verbeek 1999 included 16 patients in the GM‐CSF arm and 15 in the placebo arm.
Secondary outcome: Incidence and duration of anaemia
Both studies did not provide data with regard to this outcome.
Secondary outcome: Adverse events
Zwierzina 2005 reported about fever in two of 59 patients in the GM‐CSF + chemotherapy arm compared to one of 59 in the chemotherapy arm (RR 2.00 95,% CI 0.19 to 21.46; P = 0.57) (see Analysis 2.6), haemorrhage in three of 59 patients in the GM‐CSF + chemotherapy arm compared to two of 59 in the chemotherapy arm (RR 1.50, 95% CI 0.26 to 8.65; P = 0.65) (see Analysis 2.7), and flu‐like symptoms in three of 59 patients in the GM‐CSF + chemotherapy arm compared to one of 59 in the chemotherapy arm (RR 3.00, 95% CI 0.32 to 28.02; P = 0.34) (see Analysis 2.8). Toxic death occurred in six of 59 patients in the GM‐CSF + chemotherapy arm compared to five of 59 in the chemotherapy arm (RR 1.20, 95% CI 0.39 to 3.72; P = 0.75) (see Analysis 2.9).
2.6. Analysis.
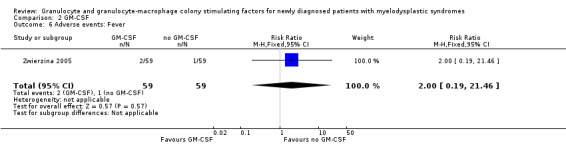
Comparison 2 GM‐CSF, Outcome 6 Adverse events: Fever.
2.7. Analysis.
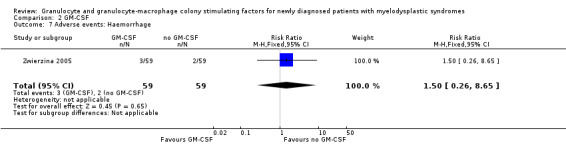
Comparison 2 GM‐CSF, Outcome 7 Adverse events: Haemorrhage.
2.8. Analysis.
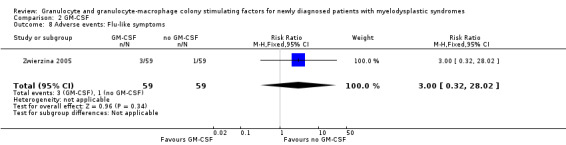
Comparison 2 GM‐CSF, Outcome 8 Adverse events: Flu‐like symptoms.
2.9. Analysis.
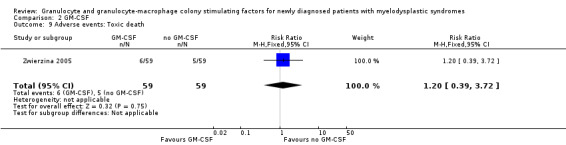
Comparison 2 GM‐CSF, Outcome 9 Adverse events: Toxic death.
Verbeek 1999 reported about discontinuation due to toxicity in three of 16 patients in the GM‐CSF arm compared to none of 13 patients in the placebo arm (RR 5.76, 95% CI 0.32 to 102.44; P = 0.23) (see Analysis 2.10).
2.10. Analysis.
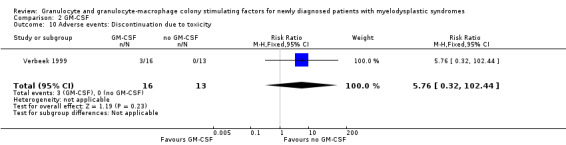
Comparison 2 GM‐CSF, Outcome 10 Adverse events: Discontinuation due to toxicity.
Table 4 presents a list of reported adverse events.
2. GM‐CSF adverse events.
| Intervention group | Control group | |
| Verbeek | ||
| Nausea/Vomiting | 30% | |
| Hepatic | 15% | |
| Infection | 47% | |
| Bleeding | 19% | |
| Early death | 7/16 | 3/13 |
| Discontinuation due to toxicity | 3/16 | 0/13 |
| Zwierzina | ||
| Infection | 8/59 | 2/59 |
| Fever | 2/59 | 1/59 |
| Flu‐like symptoms | 3/59 | 1/59 |
| Haemorrhage | 3/59 | 2/59 |
| Toxic death | 8/59 | 5/59 |
Secondary outcome: Incidence of blood product transfusions (i.e. red blood cell transfusion, platelet transfusion, granulocyte transfusion)
Verbeek 1999 reported platelet transfusion independence occurring in two of 16 patients in the GM‐CSF + chemotherapy group versus one of 13 patients in the chemotherapy arm (RR 1.63, 95% CI 0.17 to 15.99; P = 0.68) (see Analysis 2.11). Red blood cell transfusion independence was achieved by one of 16 patients receiving GM‐CSF + chemotherapy and none of 13 patients in the chemotherapy group (RR 2.47, 95% CI 0.11 to 56.03; P = 0.57) (see Analysis 2.12).
2.11. Analysis.

Comparison 2 GM‐CSF, Outcome 11 Platelet transfusion independence.
2.12. Analysis.
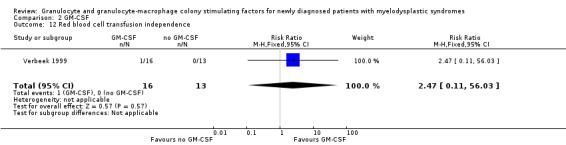
Comparison 2 GM‐CSF, Outcome 12 Red blood cell transfusion independence.
Secondary outcome: Incidence and duration of antibiotic treatment
According to Verbeek 1999, the number of days of antibiotic treatment were not significantly different in the groups (P value not provided). Verbeek 1999 included 16 patients in the GM‐CSF arm and 15 in the placebo arm. The incidence of antibiotic treatment was not reported.
Secondary outcome: Hospitalisation
Neither study provided data with regard to this outcome.
Secondary outcome: Quality of life data
Neither study assessed this outcome.
Subgroup and sensitivity analysis
We did not perform further subgroup or sensitivity analyses, because both trials did not provide data of age or IPSS subgroups, nor did they differ regarding different types of additional agents.
Discussion
Summary of main results
In this systematic review, we analysed the efficacy and safety of granulocyte and granulocyte‐macrophage colony stimulating factors (G‐CSF, GM‐CSF) for the treatment of newly diagnosed patients with myelodysplastic syndromes (MDS). The findings emerging from this analysis are as follows.
-
In five trials (337 patients) assessing G‐CSF versus no treatment or placebo
No meta‐analysis for any of the preplanned, patient‐related outcomes was possible due to lack of data or weak reporting of data.
Overall survival (OS), progression‐free survival (PFS), complete response (CR), partial response (PR), incidence and duration of anaemia, incidence and duration of antibiotic treatment, and hospitalisation were only reported by one trial, while none of the studies showed evidence for a difference in outcome.
Data about severe adverse events (WHO grade III/IV) were not reported by any of the included trials.
Quality of life was assessed in one trial, but without providing results for each arm separately.
One study (64 patients) reported a significantly shorter duration of neutropenia in the G‐CSF + chemotherapy compared to the chemotherapy arm (P = 0.015). Another trial (103 patients) found a significantly higher increase in neutrophils in the G‐CSF group (P = 0.0001).
-
In two trials (149 patients) assessing GM‐CSF versus no treatment or placebo
Meta‐analysis of overall survival and CR showed no evidence for a difference between chemotherapy with GM‐CSF and chemotherapy alone.
Partial response, duration of neutropenia, incidence of blood product transfusions, duration of antibiotic treatment, incidence and duration of infections, adverse events and serious adverse events were only reported by one trial, or in a non‐comparable way, without evidence for a difference.
Data about time to progression to acute myeloid leukaemia (AML), incidence and duration of anaemia, incidence of neutropenia, incidence of antibiotic treatment, hospitalisation, and quality of life were not reported at all.
Overall completeness and applicability of evidence
So far, seven published trials involving 486 patients have addressed the use of G‐CSF or GM‐CSF in patients with MDS. Unfortunately, not many relevant outcomes were reported in these trials, especially not the most important patient‐related outcomes such as progression to AML and quality of life, all of which would have been included in this systematic review.
Five trials assessed the efficacy and safety of G‐CSF and two assessed GM‐CSF. Because of the different targeted cells and potential different efficacy of both agents, we planned to conduct two main analyses. However, for the intervention G‐CSF, most of our predefined outcomes were reported in a very heterogeneous way, or not even considered at all, therefore no meta‐analysis was possible. Three publications included in the analysis of G‐CSF were only provided as abstracts. Full‐text publications are very unlikely to be published six to nine years after publication of the abstract, indicating potential publication bias.
Two further trials evaluated GM‐CSF in a cross‐over design and were published as abstracts only, but did not provide results for each arm for the entire cohort of trial participants before crossing over (Schuster 1989; Schuster 1995). Therefore, both trials were not included in this systematic review. One trial evaluated 20 patients (Schuster 1989), the other 224 patients (Schuster 1995). These 244 patients, who were not analysed, limit the applicability of the evidence.
We are aware of two further studies, comparing erythropoietin (EPO) plus G‐CSF versus EPO (04/Q1907/94) and G‐CSF versus best supportive care (REGIME) in an unconfounded design. Both trials were terminated early due to withdrawal of pharmaceutical support.
Quality of the evidence
Overall, the potential risk of bias of the seven included trials (486 patients) is difficult to judge, since four of the trials only provided information regarding incomplete outcome data and two did not provide any information on risk of bias. All included trials were reported as randomised trials. One trial was placebo‐controlled and double‐blinded, and one trial reported blinding of the outcome assessor; both trials also reported on allocation concealment (Verbeek 1999; Zwierzina 2005). The open‐label design and unclear allocation concealment of all the other trials could lead to selection, performance or detection biases. Only one trial had a registered protocol. This protocol did not provide information about the outcomes to be assessed, thus we were not able to judge selective reporting bias. We suspected selective reporting in several trials, because frequently results were reported only cumulatively, or patient‐relevant outcomes were not reported at all. The premature closure of one trial due to slow patient recruitment could lead to other sources of bias.
Two studies identified in a trials registry (EPO plus G‐CSF versus EPO (04/Q1907/94) and G‐CSF versus best supportive care (REGIME)) were prematurely terminated due to withdrawal of pharmaceutical support, with no publication available as yet. There is a risk for potential publication bias.
The quality of evidence for the G‐CSF analyses is very low for all outcomes, due to very high imprecision (downgraded by two points). Each result was reported in one trial only, or reported in a non‐comparable way, prohibiting meta‐analysis. Moreover, there is risk of publication bias, as three out of seven trials have not been reported as full‐text publications, although they were terminated and published as abstracts several years ago (downgraded by one point).
The quality of evidence for GM‐CSF was rated as low for all outcomes, as we downgraded by two points due to the very small number of patients and events, leading to high imprecision.
Potential biases in the review process
To prevent bias within the review, we considered only randomised controlled trials (RCTs). In addition, all important conference proceedings were searched up to 2015. We tried to avoid bias by performing all relevant processes (searching, data collection, analysis) in duplicate. In summary, there is high confidence that all relevant studies were identified and we are not aware of any obvious deficiencies in our review process. Due to the small number of trials, we were not able to generate a funnel plot to evaluate publication bias.
Agreements and disagreements with other studies or reviews
To our knowledge, this is the first comprehensive systematic review with meta‐analysis focusing on the treatment of patients with MDS with granulocyte and granulocyte‐macrophage colony stimulating factors. We searched for guidelines or health technology reports with systematic searches of databases and identified the following publications: Bowen 2003; NCCN 2012; Santini 2010; Scott 2008; Steensma 2006.
Reports and guidelines used the following sources
Bowen 2003: Ferrini 1998; Hellstrom‐Lindberg 1995; Hellstrom‐Lindberg 1997; Hellstrom‐Lindberg 1998; Hellström‐Lindberg 2003; Mantovani 2000
NCCN 2012: Greenberg 2009; Hellstrom‐Lindberg 1997; Hellström‐Lindberg 2003; Jadersten 2008; Negrin 1996; Park 2008
The guidelines do not routinely recommend the administration of G‐CSF or GM‐CSF.
There is consensus for certain cases that the addition of myeloid growth factors as an adjunct to erythropoiesis‐stimulating agents (ESAs) induce haemoglobin (Hb) response or recovery. The guidelines by Bowen 2003, NCCN 2012, Santini 2010, and Steensma 2006 support this use, especially in patients with refractory anaemia with ring sideroblasts (RARS) and serum EPO levels < 500 mU/mL. This recommendation is mainly based on three trials (Balleari 2006; Hellstrom‐Lindberg 1997; Hellstrom‐Lindberg 1998), only one of which we included in our review (Balleari 2006). Hellstrom‐Lindberg 1997 and Hellstrom‐Lindberg 1998 used an uncontrolled cross‐over design and thus were ineligible for our review. Scott 2008 does not recommend routine use of myeloid growth factors at all, referring to Hellstrom‐Lindberg 1998 and Park 2008. However, erythroid response could be a quality of life‐affecting goal in the palliative treatment of patients with MDS and thus, should be confirmed in future RCTs..
According to Bowen 2003 and NCCN 2012, patients with refractory anaemia with excess blasts (RAEB) are likely to respond to EPO alone, while the addition of G‐CSF might be beneficial in non‐responders. This recommendation is based on three trials (Hellstrom‐Lindberg 1997; Hellstrom‐Lindberg 1998; Negrin 1996).
Patients with serum EPO levels > 500 mU/mL should not receive cytokine therapy, due to very low erythroid response (NCCN 2012).
Most sources do agree with the fact that the administration of G‐CSF improves neutrophil recovery and absolute neutrophil count (NCCN 2012; Santini 2010; Steensma 2006 based on Willemze 1992), while its effect on the reduction of infections is still unclear and under discussion. While NCCN 2012 and Santini 2010 recommend at least consideration of its use under infectious conditions, Steensma 2006 states there is insufficient proof of benefit. However, Steensma 2006 is referring to Schuster 1989, which showed contradicting results and less infectious episodes. Schuster 1989 was not included in our review due to its cross‐over design.
Survival and progression: While the guideline NCCN 2012 stresses that studies have shown no negative impact on survival or AML evolution (Greenberg 2009; Jadersten 2008; Park 2008), Santini 2010 points to the lack of impact on survival and mortality for not recommending it. Bowen 2003 emphasises the lack of survival data in general and Steensma 2006 reports the contradicting results of Greenberg 1993, where treatment with G‐CSF was followed by an increase in mortality (most likely due to insufficient stratification) and Schuster 1989, who reported a decline in mortality. Thus, survival seems to be another sticking point of discussion. Because influence on survival and progression is unlikely to happen through administration of G‐CSF, research should focus on exclusion of harms such as progression to AML, as G‐CSF's ad GM‐CSF's ability to act as trophic factors for leukaemic blast in vitro is evident (Lieschke 1992).
Regarding progression to AML, Steensma 2006 states that many clinicians felt uncertain about whether filgrastim or sargramostim treatment might be a causative factor, reflecting a lack of evident data regarding that particular outcome.
Finally, quality of life is very important for patients. The guideline by the National Comprehensive Cancer Network (NCCN) refers to Hellström‐Lindberg 2003, which is not a RCT and thus was excluded from our review, but which reports an improvement in the quality of life in responding patients. Bowen 2003 stresses the lack of data and the need for RCTs with regard to quality of life.
Most of the guidelines gave very limited recommendation for the use of G‐CSF, which is in line with our findings. NCCN 2012 still recommends its use in the patient groups mentioned above. This recommendation should be reconsidered, taking into account that there are no RCTs showing significant differences in any of our predefined outcomes. Ossenkoppele 1999 even reports slightly more frequent infections in patients receiving G‐CSF. The only outcome which can be significantly and positively altered by G‐CSF administration is neutropenia, which unfortunately is not followed by a proven effect on reducing infections. Until this effect is not proven to be evident, the elevation of neutrophils remains a laboratory improvement rather than an advantage for the patient.
GM‐CSF was not recommended in the present guidelines, which is in line with our findings, showing no significant improvement in any outcome assessed.
Authors' conclusions
Implications for practice.
Although we identified five trials evaluating G‐CSF and two evaluating GM‐CSF, there is a serious lack of reporting patient‐related outcomes including overall survival, time to progression to acute myeloid leukaemia, quality of life and adverse effects. The only outcome substantially affected by the use of G‐CSF is neutrophil blood count recovery. We are uncertain whether G‐CSF or GM‐CSF alongside standard therapy have an effect on the incidence of infections. Moreover, two trials were terminated early, without publishing results, indicating high risk of publication bias.
Implications for research.
Although a substantial number of patients were included in the trials altogether, we are still unable to give a recommendation and therefore underline the following: controlled trials with longer follow‐up and more relevant outcomes investigating the effects of G‐CSF and GM‐CSF in the condition of MDS are urgently needed, since the current evidence is scant. Future trials should focus on patient‐relevant outcomes, such as overall survival, transformation to acute myeloid leukaemia, as well as the incidence of infections and quality of life. The latter in particular, should be stressed, since MDS is a condition of the elderly and one in which most patients are treated palliatively. Patient‐relevant outcomes should be analysed in subgroups regarding different subtypes of MDS.
Notes
Parts of the methods section are from the standard Cochrane Haematological Malignancies Group template for protocols and reviews.
Acknowledgements
We are grateful to the following persons for their comments and improving the protocol: Joerg Meerpohl and Sven Trelle (Editors), Céline Fournier (Consumer Editor) as well as Andrea Will (Editorial Base).
Appendices
Appendix 1. CENTRAL search strategy
| ID | Search |
| #1 | MeSH descriptor: [Colony‐Stimulating Factors] explode all trees |
| #2 | MeSH descriptor: [Granulocyte Colony‐Stimulating Factor] explode all trees |
| #3 | MeSH descriptor: [Granulocyte‐Macrophage Colony‐Stimulating Factor] explode all trees |
| #4 | MeSH descriptor: [Macrophage Colony‐Stimulating Factor] explode all trees |
| #5 | RHG*CSF* or RH‐G*CSF* or RHGM*CSF* or RH‐GM*CSF* |
| #6 | RMETHUG* or RHMETHUG* or R‐METHUG* or RH‐METHUG* |
| #7 | RHUG* or RHUGM* |
| #8 | GCSF* or G‐CSF* |
| #9 | GM‐CSF* or GMCSF* |
| #10 | GRANULO*YT* near/3 FA*TOR* |
| #11 | MA*ROPHAG* near/5 FA*TOR* |
| #12 | FILGRASTIM* |
| #13 | neupogen* |
| #14 | religrast* |
| #15 | nugraf* |
| #16 | LENOGRASTIM* |
| #17 | Granocyte |
| #18 | Euprotin* |
| #19 | PEG*FILGRASTIM* |
| #20 | Neulasta* |
| #21 | LEUKINE* |
| #22 | sagramostim* |
| #23 | MOLGRAMOSTIN* |
| #24 | macrogen* |
| #25 | Mielogen* |
| #26 | Leucomax* |
| #27 | nartograstim* |
| #28 | pegnartograstim* |
| #29 | ecogramostim* |
| #30 | regramostim* |
| #31 | leridistim* |
| #32 | lipegfilgrastim* or XM22* |
| #33 | #1 or #2 or #3 or #4 or #5 or #6 or #7 or #8 or #9 or #10 or #11 or #12 or #13 or #14 or #15 or #16 or #17 or #18 or #19 or #20 or #21 or #22 or #23 or #24 or #25 or #26 or #27 or #28 or #29 or #30 or #31 or #32 |
| #34 | MeSH descriptor: [Myelodysplastic Syndromes] explode all trees |
| #35 | myeloplasti* or myelodysplasti* or dysmyelopoietic* or mielodispl* |
| #36 | myelodysplasi* |
| #37 | mds |
| #38 | MeSH descriptor: [Preleukemia] explode all trees |
| #39 | preleukam* or preleukaem* |
| #40 | MeSH descriptor: [Anemia, Refractory] explode all trees |
| #41 | refrakta* near/3 anem* OR refrakta* near/3 anaem* OR refract* near/3 anem* OR refract* NEAR/j3 anaem* |
| #42 | refractor* near/3 cytopen* OR refrakt* near/3 cytopen* OR refractor* near/3 zytopen OR refrakt* near/3 zytopen |
| #43 | raeb* |
| #44 | rars* |
| #45 | MeSH descriptor: [Anemia, Refractory, with Excess of Blasts] explode all trees |
| #46 | smo*ldering* near/3 leukam* OR smoldering near/3 leukam* OR smo*ldering* near/3 leukaem* OR smoldering near/3 leukaem* |
| #47 | raem* |
| #48 | MeSH descriptor: [Anemia, Sideroblastic] explode all trees |
| #49 | sideroblasti* near/3 anem* OR sideroblasti* near/3 anaem* |
| #50 | #34 or #35 or #36 or #37 or #38 or #39 or #40 or #41 or #42 or #43 or #44 or #45 or #46 or #47 or #48 or #49 |
| #51 | #33 and #50 in Trials |
Appendix 2. MEDLINE search strategy
| # | Searches |
| 1 | exp Myelodysplastic Syndromes/ |
| 2 | (myeloplasti$ or myelodysplasti$ or dysmyelopoietic$ or mielodispl?sic$).tw,kf,ot. |
| 3 | myelodysplasi$.tw,kf,ot. |
| 4 | mds.tw,kf,ot. |
| 5 | Preleukemia/ |
| 6 | preleuka?m$.tw,kf,ot. |
| 7 | exp Anemia, Refractory/ |
| 8 | ((refrakta?r$ or refract$) adj3 (anem$ or anaem$)).tw,kf,ot. |
| 9 | ((refractor$ or refrakt$) adj3 (cytopen$ or zytopen$)).tw,kf,ot. |
| 10 | raeb$.tw,kf,ot. |
| 11 | rars$.tw,kf,ot. |
| 12 | "Anemia, Refractory, with Excess of Blasts"/ |
| 13 | ((smo?ldering$ or smoldering$) adj3 leuka?m$).tw,kf,ot. |
| 14 | raem$.tw,kf,ot. |
| 15 | exp Anemia, Sideroblastic/ |
| 16 | (sideroblasti$ adj3 (anem$ or anaem$)).tw,kf,ot. |
| 17 | or/1‐16 |
| 18 | COLONY‐STIMULATING FACTORS/ |
| 19 | exp GRANULOCYTE COLONY‐STIMULATING FACTOR/ |
| 20 | exp GRANULOCYTE‐MACROPHAGE COLONY‐STIMULATING FACTOR/ |
| 21 | MACROPHAGE COLONY‐STIMULATING FACTOR/ |
| 22 | (RHG?CSF$ or RH‐G?CSF$ or RHGM?CSF$ or RH‐GM?CSF$).tw. |
| 23 | (RMETHUG$ or RHMETHUG$ or R‐METHUG$ or RH‐METHUG$).tw. |
| 24 | (RHUG$ or RHUGM$).tw. |
| 25 | (GCSF$ or G‐CSF$).tw. |
| 26 | (GM‐CSF$ or GMCSF$).tw. |
| 27 | (GRANULO?YT$ adj3 FA#TOR$).tw. |
| 28 | (MA#ROPHAG$ adj5 FA#TOR$).tw. |
| 29 | CSF.ti. |
| 30 | FILGRASTIM$.tw,hw,nm,kf. |
| 31 | neupogen$.tw,hw,nm,kf. |
| 32 | LENOGRASTIM$.tw,hw,nm,kf. |
| 33 | Granocyte.tw,hw,nm,kf. |
| 34 | Euprotin.tw,hw,nm,kf. |
| 35 | PEG?FILGRASTIM$.tw,hw,nm,kf. |
| 36 | Neulasta.tw,hw,nm,kf. |
| 37 | LEUKINE.tw,hw,nm,kf. |
| 38 | sagramostim$.tw,kf,nm,ot. |
| 39 | MOLGRAMOSTIN$.tw,hw,nm,kf. |
| 40 | Mielogen$.tw,kf,nm,ot. |
| 41 | Leucomax$.tw,hw,nm,kf. |
| 42 | nartograstim$.tw,kf,nm,ot. |
| 43 | pegnartograstim$.tw,kf,nm,ot. |
| 44 | ecogramostim$.tw,kf,nm,ot. |
| 45 | regramostim$.tw,kf,nm,ot. |
| 46 | leridistim$.tw,kf,ot. |
| 47 | (lipegfilgrastim$ or XM22$).tw,kf,nm,ot. |
| 48 | or/18‐46 |
| 49 | 17 and 48 |
| 50 | randomized controlled trial.pt. |
| 51 | controlled clinical trial.pt. |
| 52 | randomi?ed.ab. |
| 53 | placebo.ab. |
| 54 | clinical trials as topic.sh. |
| 55 | randomly.ab. |
| 56 | trial.ti. |
| 57 | or/50‐56 |
| 58 | humans.sh. |
| 59 | 57 and 58 |
| 60 | 49 and 59 |
Data and analyses
Comparison 1. G‐CSF.
| Outcome or subgroup title | No. of studies | No. of participants | Statistical method | Effect size |
|---|---|---|---|---|
| 1 Overall survival | 1 | Hazard Ratio (Fixed, 95% CI) | 0.80 [0.44, 1.47] | |
| 2 Progression to AML | 1 | 64 | Risk Ratio (M‐H, Fixed, 95% CI) | 0.47 [0.04, 4.92] |
| 3 Complete response | 1 | 64 | Risk Ratio (M‐H, Fixed, 95% CI) | 1.41 [0.94, 2.10] |
| 4 Partial response | 1 | 64 | Risk Ratio (M‐H, Fixed, 95% CI) | 0.70 [0.17, 2.90] |
| 5 Infections | 1 | 64 | Risk Ratio (M‐H, Fixed, 95% CI) | 1.57 [0.65, 3.80] |
Comparison 2. GM‐CSF.
| Outcome or subgroup title | No. of studies | No. of participants | Statistical method | Effect size |
|---|---|---|---|---|
| 1 Overall survival | 2 | Hazard Ratio (Fixed, 95% CI) | 0.88 [0.62, 1.26] | |
| 2 Progression‐free survival | 1 | Hazard Ratio (Fixed, 95% CI) | 0.93 [0.64, 1.35] | |
| 3 Complete response | 2 | 147 | Risk Ratio (M‐H, Fixed, 95% CI) | 0.71 [0.38, 1.35] |
| 4 Partial response | 1 | 118 | Risk Ratio (M‐H, Fixed, 95% CI) | 1.0 [0.37, 2.67] |
| 5 Infections | 1 | 118 | Risk Ratio (M‐H, Fixed, 95% CI) | 4.0 [0.89, 18.05] |
| 6 Adverse events: Fever | 1 | 118 | Risk Ratio (M‐H, Fixed, 95% CI) | 2.0 [0.19, 21.46] |
| 7 Adverse events: Haemorrhage | 1 | 118 | Risk Ratio (M‐H, Fixed, 95% CI) | 1.5 [0.26, 8.65] |
| 8 Adverse events: Flu‐like symptoms | 1 | 118 | Risk Ratio (M‐H, Fixed, 95% CI) | 3.0 [0.32, 28.02] |
| 9 Adverse events: Toxic death | 1 | 118 | Risk Ratio (M‐H, Fixed, 95% CI) | 1.2 [0.39, 3.72] |
| 10 Adverse events: Discontinuation due to toxicity | 1 | 29 | Risk Ratio (M‐H, Fixed, 95% CI) | 5.76 [0.32, 102.44] |
| 11 Platelet transfusion independence | 1 | 29 | Risk Ratio (M‐H, Fixed, 95% CI) | 1.63 [0.17, 15.99] |
| 12 Red blood cell transfusion independence | 1 | 29 | Risk Ratio (M‐H, Fixed, 95% CI) | 2.47 [0.11, 56.03] |
| 13 Overall survival ‐ random‐effects model | 2 | Hazard Ratio (Random, 95% CI) | 0.88 [0.62, 1.26] | |
| 14 Complete response ‐ random‐effects model | 2 | 147 | Risk Ratio (M‐H, Random, 95% CI) | 0.72 [0.38, 1.36] |
Characteristics of studies
Characteristics of included studies [ordered by study ID]
Balleari 2006.
| Methods | Randomisation: A randomised controlled trial with 2 arms: Erythropoietin (rHEPO) versus rHEPO plus G‐CSF Allocation ratios:
Recruitment period:
Median follow‐up time:
|
|
| Participants | Eligibility: Inclusion criteria
Patients recruited (N = 30):
Mean age:
Gender (male, female):
Subtypes of MDS classified by WHO criteria:
Platelet transfusion dependency:
Country
|
|
| Interventions | Arm 1:
Arm 2:
The study protocol allowed the addition of G‐CSF for patients who did not respond to rHEPO 8 weeks after treatment begin (9 of 15 patients of the rHEPO arm received G‐CSF after 8 weeks) Additional therapy:
|
|
| Outcomes | As stated above 9 of 15 patients of the rHEPO arm received G‐CSF after 8 weeks, therefore we only considered results that were assessed at 8 weeks after treatment begin for this review. Primary outcome of the study:
Outcomes and time points from the study that are considered in the review: reported:
not reported:
|
|
| Notes | The publication provided no declaration on authors' conflicts of interest or received funding. | |
| Risk of bias | ||
| Bias | Authors' judgement | Support for judgement |
| Random sequence generation (selection bias) | Unclear risk | Quote: “Patients were randomly divided in a 1:1 fashion“ Comment: The authors did not describe the method used to generate the allocation sequence. |
| Allocation concealment (selection bias) | Unclear risk | No information provided |
| Blinding of participants and personnel (performance bias) All outcomes | Unclear risk | Comment: This was not a placebo‐controlled randomised trial |
| Blinding of outcome assessment (OS; detection bias) | Unclear risk | OS not reported |
| Blinding of outcome assessment (secondary outcomes) | Unclear risk | No information provided |
| Incomplete outcome data (attrition bias) All outcomes | High risk | Quote: "After the 8th week of treatment, FACT‐An assessment of both baseline and post‐treatment conditions was obtained for 18/30 (60%) patients enrolled in the study (7 in the rHEPO arm and 11 in the rHEPO+G‐CSF arm)." |
| Selective reporting (reporting bias) | Unclear risk | A protocol of this trial was not registered |
| Other bias | Unclear risk | No information provided |
Greenberg 1993.
| Methods | Randomisation A randomised controlled trial with 2 arms: Arm 1 received G‐CSF. Arm 2 was only observed. Recruitment period:
Median follow‐up time
|
|
| Participants | Eligibility:
Inclusion criteria
Exclusion criteria
Patients recruited (N = 102)
Median age
Gender (male/female)
Subtypes of MDS
Platelet transfusion dependency:
Country
|
|
| Interventions | Arm 1:
Arm 2:
Additional therapy
|
|
| Outcomes | Outcomes and time points from the study that are considered in the review: Primary endpoint of study:
reported:
not reported:
|
|
| Notes | The publication provided no declaration on authors' conflicts of interest or received funding. | |
| Risk of bias | ||
| Bias | Authors' judgement | Support for judgement |
| Random sequence generation (selection bias) | Unclear risk | Quote:“102 patients [...] were randomized to receive G‐CSF (Arm A) vs. Observation (Arm B).“ Comment: The authors did not describe the method used to generate the allocation sequence. |
| Allocation concealment (selection bias) | Unclear risk | No information provided |
| Blinding of participants and personnel (performance bias) All outcomes | Unclear risk | Comment: This was not a placebo‐controlled randomised trial |
| Blinding of outcome assessment (OS; detection bias) | Unclear risk | OS not reported |
| Blinding of outcome assessment (secondary outcomes) | Unclear risk | No information provided |
| Incomplete outcome data (attrition bias) All outcomes | Unclear risk | Preliminary data from an abstract |
| Selective reporting (reporting bias) | Unclear risk | A protocol of this trial was not registered |
| Other bias | Unclear risk | No information provided |
Mantovani 1996.
| Methods | Randomisation: A randomised controlled trial with 3 arms: supportive care (SC) versus SC plus G‐CSF versus SC plus G‐CSF and rHEPO Allocation ratios
Recruitment period:
Median follow‐up time
|
|
| Participants | Eligibility:
Inclusion criteria
Patients recruited (N = 37, so far enrolled):
Median age:
Gender (male/female):
Subtypes of MDS classified by French‐American‐British criteria:
Platelet transfusion dependency:
Country:
|
|
| Interventions | Arm 1:
Arm 2:
Arm 3:
Patients received cytokine treatment for 36 weeks. Additional therapy
|
|
| Outcomes | Primary outcome of the study:
Outcomes and time points from the study that are considered in the review: reported:
not reported:
|
|
| Notes | We contacted the authors for more information. No additional information was provided. The publication provided no declaration on authors' conflicts of interest or received funding. | |
| Risk of bias | ||
| Bias | Authors' judgement | Support for judgement |
| Random sequence generation (selection bias) | Unclear risk | Quote: “A randomized controlled phase III study [...]“ Comment: The authors did not describe the method used to generate the allocation sequence. |
| Allocation concealment (selection bias) | Unclear risk | No information provided |
| Blinding of participants and personnel (performance bias) All outcomes | Unclear risk | Comment: This was not a placebo‐controlled randomised trial |
| Blinding of outcome assessment (OS; detection bias) | Unclear risk | OS not reported |
| Blinding of outcome assessment (secondary outcomes) | Unclear risk | No information provided |
| Incomplete outcome data (attrition bias) All outcomes | Unclear risk | Quote: "Characteristics of the 37 so far enrolled patients [...]" |
| Selective reporting (reporting bias) | Unclear risk | A protocol of this trial was not registered |
| Other bias | Unclear risk | No information provided |
Ossenkoppele 1999.
| Methods | Randomisation: A randomised controlled trial with 2 arms: chemotherapy (daunomycin and cytarabine) versus chemotherapy plus G‐CSF Allocation ratios
Recruitment period:
Median follow‐up time:
|
|
| Participants | Eligibility:
Inclusion criteria
Patients recruited (N = 65), 1 patient in the no filgrastim arm was considered ineligible, because the bone marrow sample on the day of registration was compatible with AML:
Median age:
Gender (male/female):
Subtypes of MDS classified by French‐American‐British criteria:
Platelet transfusion dependency:
Country:
|
|
| Interventions | Arm 1:
Arm 2:
Additional therapy:
In case of a PR after the first induction cycle a second identical remission induction course was administered. Patients in CR after one or two cycles received one chemotherapy cycle for consolidation consisting of daunomycin (30 mg/m2 /day 1 intravenous bolus) and cytarabine (200 mg/m2 days 1 to 7, continuous infusion). |
|
| Outcomes | Primary outcome of the study:
Outcomes and time points from the study that are considered in the review: reported:
not reported:
|
|
| Notes | This research was supported, in part, by a grant from AMGEN. | |
| Risk of bias | ||
| Bias | Authors' judgement | Support for judgement |
| Random sequence generation (selection bias) | Unclear risk | Quote:“Patients [...] were randomized to receive either granulocyte colony‐stimulating factor […] or no G‐CSF in addition to [...]“ Comment: The authors did not describe the method used to generate the allocation sequence. |
| Allocation concealment (selection bias) | Unclear risk | No information provided |
| Blinding of participants and personnel (performance bias) All outcomes | Unclear risk | Comment: This was not a placebo‐controlled randomised trial |
| Blinding of outcome assessment (OS; detection bias) | Low risk | Although the study is not blinded, this does not affect the outcome OS |
| Blinding of outcome assessment (secondary outcomes) | Unclear risk | No information provided |
| Incomplete outcome data (attrition bias) All outcomes | Low risk | Comment: All patients were assessed in analyses |
| Selective reporting (reporting bias) | Unclear risk | A protocol of this trial was not registered |
| Other bias | Unclear risk | No information provided |
Taieb 1998.
| Methods | Randomisation: A randomised controlled trial with 2 arms: chemotherapy (low‐dose cytarabine) versus chemotherapy plus G‐CSF Allocation ratios
Recruitment period:
Median follow‐up time:
|
|
| Participants | Eligibility:
Inclusion criteria
Patients recruited (N = 103):
Median age:
Gender (male/female):
Subtypes of MDS classified by French‐American‐British criteria:
Platelet transfusion dependency:
Country:
|
|
| Interventions | Arm 1:
Arm 2:
Additional therapy:
|
|
| Outcomes | Primary outcome of the study:
Outcomes and time points from the study that are considered in the review: reported:
not reported:
|
|
| Notes | The publication provided no declaration on authors´ conflicts of interest or received funding. | |
| Risk of bias | ||
| Bias | Authors' judgement | Support for judgement |
| Random sequence generation (selection bias) | Unclear risk | Quote: “103 patients were included in an multicenter randomized open trial to assess the effect of lenograstim [...]“ Comment: The authors did not describe the method used to generate the allocation sequence. |
| Allocation concealment (selection bias) | Unclear risk | No information provided |
| Blinding of participants and personnel (performance bias) All outcomes | Unclear risk | Comment: This was not a placebo‐controlled randomised trial |
| Blinding of outcome assessment (OS; detection bias) | Unclear risk | OS not reported |
| Blinding of outcome assessment (secondary outcomes) | Unclear risk | No information provided |
| Incomplete outcome data (attrition bias) All outcomes | Low risk | Comment: All patients were assessed in analyses |
| Selective reporting (reporting bias) | Unclear risk | A protocol of this trial was not registered |
| Other bias | Unclear risk | No information provided |
Verbeek 1999.
| Methods | Randomisation: A randomised controlled trial with 2 arms: cytarabine and mitoxantrone plus GM‐CSF versus cytarabine and mitoxantrone plus placebo Allocation ratios
Recruitment period:
Median follow‐up time:
|
|
| Participants | Eligibility criteria:
Patients recruited (N = 31), 3 patients excluded (reasons for exclusion are not provided):
Mean age (range):
Gender (male/female):
Subtypes of MDS classified by French‐American‐British criteria:
Platelet transfusion dependency:
Country:
|
|
| Interventions | Arm 1:
Arm 2:
Additional therapy: All patients received glucocorticoid eye drops during cytarabine administration. |
|
| Outcomes | Primary outcome of the study:
Outcomes and time points from the study that are considered in the review: reported:
Not reported:
|
|
| Notes | The publication provided no declaration on authors´ conflicts of interest. | |
| Risk of bias | ||
| Bias | Authors' judgement | Support for judgement |
| Random sequence generation (selection bias) | Low risk | Quote: „Randomization was carried out by the Department of Biomathematics of the University of Münster.“ |
| Allocation concealment (selection bias) | Low risk | Quote: „Randomization was carried out by the Department of Biomathematics of the University of Münster. […] patients underwent a control randomization at the study center.“ |
| Blinding of participants and personnel (performance bias) All outcomes | Low risk | Quote: This was a "[...] a randomized double‐blind placebo‐controlled trial" |
| Blinding of outcome assessment (OS; detection bias) | Low risk | Although the study is not blinded, this does not affect the outcome OS |
| Blinding of outcome assessment (secondary outcomes) | Unclear risk | No information provided |
| Incomplete outcome data (attrition bias) All outcomes | Low risk | Comment: All patients were assessed for analyses |
| Selective reporting (reporting bias) | Unclear risk | A protocol of this trial was not registered |
| Other bias | Unclear risk | No information provided |
Zwierzina 2005.
| Methods | Randomisation: A randomised controlled trial with 3 arms: arm 1 received low‐dose cytarabine, arm 2 low‐dose cytarabine plus GM‐CSF, arm 3 received low‐dose cytarabine plus interleukin‐3 Allocation ratios:
Recruitment period:
Median follow‐up time:
|
|
| Participants | Eligibility:
Inclusion criteria
Patients recruited (N = 201), 21 patients excluded (due to poor data quality (N = 5), other pathology as assessed by the central pathology committee (N = 3), concomitant disease (N = 1), concomitant steroid administration (N = 1), hyperleukocytosis (N = 1), early withdrawal of the patients from the trial and/or poor documentation (N = 8). other reason (N = 2):
Mean age:
Gender (male, female):
Subtypes of MDS classified by French‐American‐British criteria :
Platelet transfusion dependency:
Country:
|
|
| Interventions | Arm 1:
Arm 2:
Arm 3:
Additional therapy:
|
|
| Outcomes | Primary outcome of the study:
Outcomes and time points from the study that are considered in the review: reported:
not reported:
|
|
| Notes | The publication provided no declaration on authors´ conflicts of interest. The trial was funded in part by an educational grant from Sandoz/Novartis and by grant numbers 5U10‐CA11486‐20 through 5U10‐CA11486‐35 from the National Cancer Institute. |
|
| Risk of bias | ||
| Bias | Authors' judgement | Support for judgement |
| Random sequence generation (selection bias) | Low risk | Quote:“Randomization was performed centrally (EORTC Data Center, Brussels)" |
| Allocation concealment (selection bias) | Low risk | Quote: "Each patient was registered at the EORTC Data Center and randomized to one of the three treatment arms of the protocol.“ |
| Blinding of participants and personnel (performance bias) All outcomes | High risk | Quote: "In this open, controlled, multicenter randomized phase III study 2" |
| Blinding of outcome assessment (OS; detection bias) | Low risk | Although the study is not blinded, this does not affect the outcome OS |
| Blinding of outcome assessment (secondary outcomes) | Unclear risk | Quote: "All bone marrow and blood smears at entry and restaging were sent for blinded pathology review to three reference laboratories of the EORTC Leukemia Cooperative Group" Comment: Outcome assessment blinded for PFS, no information provided for other outcomes |
| Incomplete outcome data (attrition bias) All outcomes | Low risk | Quote: "There were 13 ineligible patients (four in arm 1, seven in arm 2 and two in arm 3), the reason of ineligibility being poor data quality (n = 5), other pathology as assessed by the central pathology committee (n = 3), concomitant disease (n = 1), concomitant steroid administration (n = 1), hyperleukocytosis (n = 1), other reason (n = 2)." Comment: Missing outcome data are balanced in numbers across intervention groups, with similar reasons for missing data across groups. |
| Selective reporting (reporting bias) | Unclear risk | The online information of the EORTC‐06903 protocol did not include predefined outcomes |
| Other bias | Unclear risk | No information provided |
ANC: absolute neutrophil count AML: acute myeloid leukaemia CMML: Chronic myelomonocytic leukaemia CR: complete response ECOG: Eastern Cooperative Oncology Group G‐CSF: granulocyte colony stimulating factors Hb: haemoglobin IPSS: International Prognostic Scoring System IU: international unit MDS: myelodysplastic syndromes OS: overall survival PFS: progression‐free survival PR: partial response RA: refractory anaemia RAEB: refractory anaemia with excess blasts RAEBt: refractory anaemia with excess blasts in transformation RARS: refractory anaemia with ring sideroblasts RCMD: refractory cytopenia with multilineage dysplasia rHEPO: recombinant human erythropoietin SC: supportive care
Characteristics of excluded studies [ordered by study ID]
| Study | Reason for exclusion |
|---|---|
| Bernasconi 1998 | Less than 80% MDS patients |
| Bowen 2004 | EPO and G‐CSF versus placebo |
| Bowen 2006 | EPO and G‐CSF versus placebo |
| Estey 1999 | Less than 80% MDS patients |
| Gerhartz 1994 | GM‐CSF in both arms |
| Gotlib 2009 | Not randomised |
| Greenberg 2009 | G‐CSF not randomised |
| Hast 2003 | Not MDS |
| Miller 1998 | Editorial |
| Schuster 1989 | Cross‐over design and abstract publication. Unclear, how many patients crossed‐over, no results before crossing over |
| Schuster 1995 | Cross‐over design and abstract publication. No results for each arm of the entire group published |
| Stasi 2004 | Editorial |
| Terpos 2000 | Not randomised |
| Thompson 1995 | GM‐CSF in both arms |
| Willemze 1992 | Editorial |
EPO: erythropoietin G‐CSF: granulocyte colony stimulating factors MDS: myelodysplastic syndromes
Characteristics of ongoing studies [ordered by study ID]
04/Q1907/94.
| Trial name or title | Erythropoietin and GCSF for lowrisk MDS (NCT00234143) |
| Methods | Multi‐centre, randomised, triple arm, open‐label trial Randomisation:
|
| Participants | Inclusion Criteria:
|
| Interventions | Arm 1:
Arm 2:
Arm 3:
|
| Outcomes | Primary Outcome Measures:
Outcomes and time points from the registered protocol of the study that are considered in the review: will report:
will not report:
|
| Starting date | October 2004 |
| Contact information | Samir G Agrawal, St. Bartholomew's Hospital, London, United Kingdom, EC1A 7BE |
| Notes | Estimated enrolment: 360 Estimated primary completion date: not provided Study status according to ClinicalTrials.gov: status unknown Personal contact: Study terminated early |
REGIME.
| Trial name or title | Comparison study of standard care against combination of growth factors agents for low‐risk MDS (NCT01196715) |
| Methods | Open‐label, randomised safety efficacy phase III study Randomisation:
|
| Participants | Inclusion Criteria:
|
| Interventions | Arm 1:
Arm 2:
Arm 3:
|
| Outcomes | Primary Outcome Measures:
Outcomes and time points from the registered protocol of the study that are considered in the review: will report:
will not report:
|
| Starting date | November 2010 |
| Contact information | Eva Controle, BSc, 00442078828499 ext 8499 e.controle@qmul.ac.uk REGIME Co‐ordinators regime@qmcr.qmul.qc.uk |
| Notes | Estimated enrolment: 360 Study status according to ClinicalTrials.gov: This study is not yet open for participant recruitment. Personal contact: Study terminated early |
ALG: antilymphocyte globulin AML: acute myeloid leukaemia BM: bone marrow CR: complete response ECOG: Eastern Cooperative Oncology Group EPO: erythropoietin ESA: erythropoiesis‐stimulating agents G‐CSF: granulocyte colony stimulating factors Hb: haemoglobin IPSS: International Prognostic Scoring System MDS: myelodysplastic syndromes OS: overall survival PFS: progression‐free survival PR: partial response
Differences between protocol and review
We clarified the objectives from the protocol from:
The main objective of this review is to assess the benefits of G‐CSF and GM‐CSF for the treatment of patients with MDS… For this purpose we will critically, systematically and statistically analyse the efficacy of G‐CSF and GM‐CSF compared to no treatment or placebo.
to:
The objective of this review is to assess the evidence for the treatment of MDS patients with G‐CSF and GM‐CSF in addition to standard therapy in comparison to the same standard therapy or the same standard therapy and placebo to ensure to include trials only with the same "standard therapy" (i.e. ESA, chemotherapy or best supportive care) in both arms, since MDS patients regularly receive at least supportive care during their course of disease.
In accordance with Methodological Expectations of Cochrane Intervention Reviews (MECIR), we additionally searched the following clinical trials registers:
EU clinical trials register: https://www.clinicaltrialsregister.eu/ctr‐search/search
Clinicaltrials.gov: https://clinicaltrials.gov/
We were not able to perform meta‐analysis in many relevant outcomes because they were either poorly reported or missing. We would have conducted subgroup analyses and more sensitivity analyses (influence of risk of bias, full‐text publications versus abstracts, preliminary results versus mature results) and a funnel plot, however, data were too sparse.
The methods for 'Summary of findings' tables and GRADE were not described in the original protocol. We added these tables for the outcomes: overall survival, progression‐free survival, time to progression to AML, quality of life, infections, severe adverse events and number of blood transfusions.
Contributions of authors
Franz Hutzschenreuter: developed and wrote the first and final draft of the review.
Ina Monsef: developed the search strategies and ran the database searches, provided reference databases.
Karl‐Anton Kreuzer: provided clinical expertise, proof read and commented on the final draft.
Andreas Engert: provided clinical expertise, proof read and commented on the first and final draft.
Nicole Skoetz: provided methodological expertise, drafting of review, proof read and commented on the first and final draft.
Sources of support
Internal sources
-
University Hospital of Cologne, Other.
Authors receive salary from the University Hospital of Cologne, Department I of Internal Medicine
External sources
No sources of support supplied
Declarations of interest
Franz Hutzschenreuter: none known.
Ina Monsef: none known.
Karl‐Anton Kreuzer: Grants, consulting fee or honoraria, support for travel to meetings from: AbbVie, Alexion, Amgen, Ariad, Baxter, Bayer Health Care, Biotest, Boehringer Ingelheim, Bristol Myers Squibb, Celgene, Chugai, Gilead, Glaxo‐SmithKline, Grifols, Hexal, Janssen, Jazz Pharmaceuticals, Leo, Mundipharma, MSD, Novartis, Pfizer, Roche, Shire, Teva. None of the above‐mentioned relationships has a direct influence on my activities within the Cochrane group.
Andreas Engert: none known.
Nicole Skoetz: none known.
New
References
References to studies included in this review
Balleari 2006 {published data only}
- Balleari E, Rossi E, Clavio M, Congiu A, Gobbi M, Grosso M, et al. Erythropoietin plus granulocyte colony‐stimulating factor is better than erythropoietin alone to treat anemia in low‐risk myelodysplastic syndromes: results from a randomized single‐centre study. Annals of Hematology 2006;85(3):174‐80. [DOI] [PubMed] [Google Scholar]
Greenberg 1993 {published data only}
- Greenberg P, Taylor K, Lardon R, Koeffler P, Negrin R, Saba H, et al. Phase III randomized multicenter trial of G‐CSF vs. observation for myelodysplastic syndromes (MDS). Blood 1993;Suppl:196a. [Google Scholar]
Mantovani 1996 {published data only}
- Mantovani L, Lentini G, Hentschel B, Ko Y D, Tesch H, Wickramanayake P, et al. Long term treatment of intermediate risk myelodysplastic syndromes with rhG‐CSF and rhEPO: interim report of an ongoing randomized phase III trial. Annals of Hematology 1996;73(Suppl 2):A28. [Google Scholar]
Ossenkoppele 1999 {published data only}
- Ossenkoppele GJ, Verhoef GE, Holt B, Verdonck LF, Vellenga E, Sonneveld P, et al. Randomized Phase II study on the value of G‐CSF (Filgrastim) in combination with standard induction chemotherapy in myelodysplastic syndromes (MDS). Blood 1995;86(10 Suppl 1):338a. [Google Scholar]
- Ossenkoppele GJ, Holt B, Verhoef GE, Daenen SM, Verdonck LF, Sonneveld P, et al. A randomized study of granulocyte colony‐stimulating factor applied during and after chemotherapy in patients with poor risk myelodysplastic syndromes: a report from the HOVON Cooperative Group. Dutch‐Belgian Hemato‐Oncology Cooperative Group. Leukemia 1999;13(8):1207‐13. [DOI] [PubMed] [Google Scholar]
- Ossenkoppele GJ, Holt B, Verhoef GE, Daenen SM, Verdonck LF, Sonneveld P, et al. A randomized study of granulocyte‐colony stimulating factor applied during and after chemotherapy in patients with poor risk myelodysplastic syndromes: A final report from the HOVON Co‐operative Group. Blood 1998;92(10 Suppl 1 Pt 1):630‐1a. [DOI] [PubMed] [Google Scholar]
Taieb 1998 {published data only}
- Taieb O, Chevret S, Fenaux P, Guerci A, Bordessoule D, Solary E, et al. Evaluation of lenograstim in patients with poor prognosis refractory anaemia with excess of blasts (RAEB) treated with ARA‐C(3mg/m2 x 2). Blood 1998;92(10 Suppl 1 Pt 1):633a. [Google Scholar]
Verbeek 1999 {published data only}
- Hiddemann W, Buchner T, Wormann B, Koch P, Aul C, Balleisen L, et al. Treatment of high‐risk myelodysplastic syndromes with sequential intermediate dose cytosine‐arabinoside and mitoxantrone (S‐HAM) with or without GM‐CSF: a prospective double blinded randomized study. Annals of Hematology 1993;67(Suppl):A51. [Google Scholar]
- Hiddemann W, Buchner Th, Wormann B, Koch P, Aul C, Balleisen L, et al. Intensive therapy of high risk myelodysplastic syndromes with sequential intermediate dose cytosine arabinoside and mitoxantrone with or without GM‐CSF. Annals of Hematology 1995;70 Suppl 1:A109. [Google Scholar]
- Verbeek W, Wormann B, Koch P, Aul C, Hinrichs H F, Balleisen L, et al. Results of a randomized double‐blind placebo‐controlled trial evaluating sequential high‐dose cytosine arabinoside/mitoxantrone chemotherapy with or without granulocyte/macrophage‐colony‐stimulating factor in high‐risk myelodysplastic syndromes. Research & Clinical Oncology 1999;125(6):369‐74. [DOI] [PMC free article] [PubMed] [Google Scholar]
- Verbeek W, Wormann B, Koch P, Aul C, Hinrichs H, Balleisen L, et al. S‐HAM induction chemotherapy with or without GM‐CSF in patients with high‐risk myelodysplastic syndromes. Annals of Hematology 1997;74(5):205‐8. [DOI] [PubMed] [Google Scholar]
Zwierzina 2005 {published data only}
- Gerhartz HH, Walther J, Neuwirtova R, Fenaux P, Harousseau JL, Beksac M. Randomized‐3 armed phase III study of interleukin 3 (IL‐3) or granulocyte/macrophage colony‐stimulating factor (GM‐CSF) as an adjuvant to low doses of cytosine arabinoside (LD‐AraC) for the treatment of high‐risk myelodysplastic syndromes (HR‐MDS). Blood 1996;88(10):580a. [Google Scholar]
- Gerhartz HH, Zwierzina H, Suciu S, Walther J, Dardenne M, Neuwirtova R, et al. Randomized 3 arm phase III study of interleukin 3 (IL‐3) or granulocyte/macrophage colony‐stimulating factor (GM‐CSF) as an adjuvant to low doses of cytosine arabinoside (LD‐AraC) for the treatment of high‐risk myelodysplastic syndrome (HR‐MDS). Blood 1997;90(10 Suppl 1 Pt 1):85a. [Google Scholar]
- Schmetzer HM, Poleck B, Mittermuller J, Duell T, Wilmanns W, Gerhartz HH. Clonality analysis as a tool to study the biology and response to therapy in myelodysplastic syndromes. Leukemia 1997;11(5):660‐6. [DOI] [PubMed] [Google Scholar]
- Zwierzina H, Suciu S, Loeffler‐Ragg J, Neuwirtova R, Fenaux P, Beksac M, et al. Low‐dose cytosine arabinoside (LD‐AraC) vs LD‐AraC plus granulocyte/macrophage colony stimulating factor vs LD‐AraC plus Interleukin‐3 for myelodysplastic syndrome patients with a high risk of developing acute leukemia: final results of a randomized phase III study (06903) of the EORTC Leukemia Cooperative Group. Leukemia 2005;19(11):1929‐33. [DOI] [PubMed] [Google Scholar]
References to studies excluded from this review
Bernasconi 1998 {published data only}
- Bernasconi C, Alessandrino EP, Bernasconi P, Bonfichi M, Lazzarino M, Canevari A, et al. Randomized clinical study comparing aggressive chemotherapy with or without G‐CSF support for high‐risk myelodysplastic syndromes or secondary acute myeloid leukaemia evolving from MDS. British Journal of Haematology 1998;102(3):678‐83. [DOI] [PubMed] [Google Scholar]
Bowen 2004 {published data only}
- Bowen D, Hyslop A, Keenan N, Groves M, Culligan D, Johnson P, et al. Prediction of response to recombinant erythropoietin plus granulocyte‐colony stimulating factor following a single subcutaneous bolus in patients with myelodysplastic syndromes; a randomised placebo controlled study. Blood 2004; Vol. 104:402a.
Bowen 2006 {published data only}
- Bowen D, Hyslop A, Keenan N, Groves M, Culligan D, Johnson P, et al. Predicting erythroid response to recombinant erythropoietin plus granulocyte colony‐stimulating factor therapy following a single subcutaneous bolus in patients with myelodysplasia. Haematologica 2006;91:709‐10. [PubMed] [Google Scholar]
Estey 1999 {published data only}
- Estey EH, Thall PF, Pierce S, Cortes J, Beran M, Kantarjian H, et al. Randomized phase II study of fludarabine + cytosine arabinoside + idarubicin +/‐ all‐trans retinoic acid +/‐ granulocyte colony‐stimulating factor in poor prognosis newly diagnosed acute myeloid leukemia and myelodysplastic syndrome. Blood 1999;93(8):2478‐84. [PubMed] [Google Scholar]
Gerhartz 1994 {published data only}
- Gerhartz HH. Randomized phase II study LD‐ARAC plus rhGM‐CSF in advanced myelodysplasia [abstract no: 249]. European Journal of Cancer 1993;29A:S51. [Google Scholar]
- Gerhartz HH, Delmer A, Jacobs A, Zwierzina H, Ribeiro M, Lowenberg B, et al. Randomized phase II trial of low‐dose ARA‐C and human recombinant GM‐CSF in refractory anemia with excess of blasts. Blut 1989;59:255. [Google Scholar]
- Gerhartz HH, Marcus R, Delmer A, Zwierzina H, Suciu S, Dardenne M, et al. A randomized phase II study of low‐dose cytosine arabinoside (LD‐AraC) plus granulocyte‐macrophage colony‐stimulating factor (rhGM‐CSF) in myelodysplastic syndromes (MDS) with a high risk of developing leukemia. EORTC Leukemia Cooperative Group. Leukemia 1994;8:16‐23. [PubMed] [Google Scholar]
- Gerhartz HH, Marcus R, Delmer A, Zwierzina H, Witte T, Jacobs A. Randomized phase II study with GM‐CSF and low‐dose Ara‐C in patients with "high risk" myelodysplastic syndromes (MDS). Blood 1990;76:274a. [Google Scholar]
- Gerhartz HH, Marcus R, Delmer A, Zwierzina H, Witte T, Jacobs A, et al. Randomized phase II study with GM‐CSF and low‐dose ARAC in patients with "high risk" myelodysplastic syndromes (MDS). Annals of Hematology 1991;62 Suppl 1:A95. [Google Scholar]
- Gerhartz HH, Marcus R, Delmer A, Zwierzina H, Witte T, Jacobs A, et al. Treatment of myelodysplastic syndromes (MDS) and high leukaemic risk with low‐dose cytosine arabinoside (LD‐AraC) plus granulocyte‐macrophage colony‐stimulating factor (rh GM‐CSF). The EORTC Leukaemia Group. Infection 1992;20:Suppl‐23. [DOI] [PubMed] [Google Scholar]
- Gerhartz HH, Visani G, Delmer A, Zwierzina H, Ribeiro M, Jacobs A, et al. Low‐dose Ara‐C plus granulocyte/macrophage colony‐stimulating factor for the treatment of myelodysplastic syndromes. EORTC Leukemia Group. Bone Marrow Transplantation 1989;4:Suppl‐7. [PubMed] [Google Scholar]
- Gerhartz HH, Zwierzina H. Use of rhGM‐CSF or IL‐3 as an adjunct to low‐dose ARA‐C in the treatment of "high‐risk" myelodysplasia. Onkologie 1993;16:21. [Google Scholar]
Gotlib 2009 {published data only}
- Gotlib J, Lavori P, Quesada S, Stein RS, Shahnia S, Greenberg PL. A Phase II intra‐patient dose‐escalation trial of weight‐based darbepoetin alfa with or without granulocyte‐colony stimulating factor in myelodysplastic syndromes. Hematology 2009;84:15‐20. [DOI] [PMC free article] [PubMed] [Google Scholar]
Greenberg 2009 {published data only}
- Greenberg PL, Sun Z, Miller KB, Bennett JM, Tallman MS, Dewald G, et al. Treatment of myelodysplastic syndrome patients with erythropoietin with or without granulocyte colony‐stimulating factor: results of a prospective randomized phase 3 trial by the Eastern Cooperative Oncology Group (E1996). Blood 2009;114:2393‐400. [DOI] [PMC free article] [PubMed] [Google Scholar]
Hast 2003 {published data only}
- Bernell P, Hast R, Hellstrom Lindberg E, Celsing F, Linder O, Lafvenberg E, et al. GM‐CSF in combination with chemotherapy does not improve the remission rate in acute leukaemia after myelodysplastic syndromes ‐ A randomized study. Blood 1998;92(10 Suppl 1 Pt 1):615a. [Google Scholar]
- Hast R, Hellstrom‐Lindberg E, Ohm L, Bjorkholm M, Celsing F, Dahl IM, et al. No benefit from adding GM‐CSF to induction chemotherapy in transforming myelodysplastic syndromes: better outcome in patients with less proliferative disease. Leukemia 2003;17(9):1827‐33. [DOI] [PubMed] [Google Scholar]
- Ohm AC, Hast R, Bernell P, Celsing F, Dahl IM, Dybedal I. Randomized study comparing chemotherapy plus GM‐CSF in high‐risk MDS and AML following MDS (MDS‐AML). Blood 2000;96(11):148a. [Google Scholar]
Miller 1998 {published data only}
- Miller K. Erythropoietin, with and without granulocyte‐colony stimulating factor (G‐CSF), in the treatment of myelodysplastic syndrome (MDS) patients. [Review] [16 refs]. Leukemia Research 1998;22:Suppl‐6. [DOI] [PubMed] [Google Scholar]
Schuster 1989 {published data only}
- Schuster MW, Allen SL, Lichtman SM, Schulman P, DeMarco LC, Budman DR, et al. The efficacy of GM‐CSF in the treatment of myelodysplastic syndrome and aplastic anemia. Blood 1989;74(7 Suppl 1):332a. [Google Scholar]
- Schuster MW, Thompson JA, Larson R, Allen SL, O'Laughlin R, Israel R, et al. Randomized trial of subcutaneous granulocyte‐macrophage colony‐stimulating factor (GM‐CSF) versus observation in patients (PTS) with myelodysplastic syndrome (MDS) or aplastic anemia (AA) [abstract]. Journal of Clinical Oncology 1990;9:205, Abstract. [Google Scholar]
- Schuster, MW, Thompson JA, Larson, R, Allen SL, O'Laughlin R, Israel R, et al. Randomized trial of subcutaneous granulocyte‐macrophage colony‐stimulating factor (GM‐CSF) versus observation in patients (PTS) with myelodysplastic syndrome (MDS) or aplastic anemia (AA) [abstract]. Journal of Cancer Research & Clinical Oncology 1990; Vol. 116(Suppl):1079.
Schuster 1995 {published data only}
- Coiffier B, Bastion Y, Felman P, Tigaud JD, Bryon PA. GM‐CSF treatment of myelodysplastic syndromes: personal experience and preliminary results of a randomized international study. Pathologie Biologie 1992;39(9):957‐8. [PubMed] [Google Scholar]
- Schuster MW, Larson RA, Thompson JA, Coiffier B, Bennett JM, Israel RJ. Granulocyte‐macrophage colony‐stimulating factor (GM‐CSF) for myelodysplastic syndrome (MDS): results of a multi‐center randomized controlled trial. Blood 1990;76(10 Suppl 1):318a. [Google Scholar]
- Schuster MW, Thompson JA, Larson R, Coiffier V, Bennett J, Dugan M. Randomized Phase II study of recombinant granulocyte macrophage‐colony stimulating factor (rGM‐CSF) in patients with neutropenia secondary to myelodysplastic syndrome (MDS). Blood 1995;86(10 Suppl 1):338a. [Google Scholar]
Stasi 2004 {published data only}
- Stasi R, Amadori S, Newland AC, Provan D. Comparison of rHuEpo plus rHuG‐CSF and supportive care: apples to oranges. Blood 2004;104:2201‐2. [DOI] [PubMed] [Google Scholar]
Terpos 2000 {published data only}
- Terpos E, Mougiou A, Stavroyianni N, Kouraklis A, Giannakoulas N, Zoumbos NC. Treatment of anemia in myelodysplastic syndromes with prolonged administration of erythropoietin or erythropoietin and granulocyte colony‐stimulating factor. Blood 2000;96:147a. [Google Scholar]
Thompson 1995 {published data only}
- Thompson J, Gilliland G, Prchal J, Bennett J, Larholt K, Nelson R, et al. The use of GM‐CSF ± r‐HuEPO for the treatment of cytopenias associated with myelodysplastic syndrome (MDS) [he use of GM‐CSF ± r‐HuEPO for the treatment of cytopenias associated with myelodysplastic syndrome (MDS).]. Blood 1995;86(10 Suppl 1):337a, Abstract 1337. [Google Scholar]
Willemze 1992 {published data only}
- Willemze R, Lely N, Zwierzina H, Gerhartz H, Suciu S, Solbu G, et al. GM‐CSF and IL‐3 in myelodysplastic syndromes at low risk of developing acute leukemia (MDS‐LR) [abstract]. Leukemia & Lymphoma 1992;7 Suppl 2:64. [Google Scholar]
References to ongoing studies
04/Q1907/94 {published data only}
- Erythropoietin and GCSF for lowrisk MDS (NCT00234143). Ongoing study October 2004.
REGIME {published data only}
- Comparison study of standard care against combination of growth factors agents for low‐risk MDS (NCT01196715). Ongoing study November 2010.
Additional references
Beekman 2010
- Beekman R, Touw IP. G‐CSF and its receptor in myeloid malignancy. Blood 2010;115(25):5131‐6. [DOI] [PubMed] [Google Scholar]
Bernasconi 1998a
- Bernasconi C, Alessandrino EP, Bernasconi P, Bonfichi M, Lazzarino M, Canevari A. Randomized clinical study comparing aggressive chemotherapy with or without G‐CSF support for high‐risk myelodysplastic syndromes or secondary acute myeloid leukaemia evolving from MDS. British Journal of Haematology 1998;102:678‐83. [DOI] [PubMed] [Google Scholar]
Bohlius 2003
- Bohlius J, Reiser M, Schwarzer G, Engert A. Impact of granulocyte colony‐stimulating factor (CSF) and granulocyte‐macrophage CSF in patients with malignant lymphoma: a systematic review. British Journal of Haematology 2003;122(3):413‐23. [DOI] [PubMed] [Google Scholar]
Bowen 2003
- Bowen D, Culligan D, Jowitt S, Kelsey S, Mufti G, Oscier D, et al. Guidelines for the diagnosis and therapy of adult myelodysplastic syndromes. British Journal of Haematology 2003;120(2):187‐200. [DOI] [PubMed] [Google Scholar]
Buckstein 2011
- Buckstein R, Yee K, Wells RA. 5‐Azacytidine in myelodysplastic syndromes: A clinical practice guideline. Cancer Treatment Reviews 2011;37:160‐7. [DOI] [PubMed] [Google Scholar]
Casadevall 2004
- Casadevall N, Durieux P, Dubois S, Hemery F, Lepage E, Quarré MC, et al. for the Groupe Français des Myélodysplasies. Health, economic, and quality‐of‐life effects of erythropoietin and granulocyte colony‐stimulating factor for the treatment of myelodysplastic syndromes: a randomized, controlled trial. Blood 2004;104:321‐7. [DOI] [PubMed] [Google Scholar]
Deeks 2011
- Deeks JJ, Higgins JPT, Altman DG. Chapter 9: Analysing data and undertaking meta‐analyses. In: Higgins JPT Green S editor(s). Cochrane Handbook for Systematic Reviews of Interventions Version 5.1.0 (updated March 2011). The Cochrane Collaboration, 2011. Available from www.cochrane‐handbook.org, 2011. [Google Scholar]
Economopoulos 1999
- Economopoulos T, Mellou S, Papageorgiou E, Pappa V, Kokkinou V, Stathopoulou E. Treatment of anemia in low risk myelodysplastic syndromes with granulocyte‐macrophage colony‐stimulating factor plus recombinant human erythropoietin. Leukemia 1999;13:1009‐12. [DOI] [PubMed] [Google Scholar]
Ferrini 1998
- Ferrini PR, Grossi A, Vannucchi AM, Barosi G, Guarnone R, Piva N, et al. A randomized double‐blind placebo‐controlled study with subcutaneous recombinant human erythropoietin in patients with low‐risk myelodysplastic syndromes. British Journal of Haematology 1998;103(4):1070‐4. [DOI] [PubMed] [Google Scholar]
Fey 2010
- Fey MF, Dreyling M. Acute myeloblastic leukaemias and myelodysplastic syndromes in adult patients: ESMO Clinical Practice Guidelines for diagnosis, treatment and follow‐up. Annals of Oncology 2010;21 Suppl 5:158‐61. [DOI] [PubMed] [Google Scholar]
Gerhartz 1992a
- Gerhartz HH, Marcus R, Delmer A, Zwierzina H, Witte T, Jacobs A, et al. Treatment of myelodysplastic syndromes (MDS) and high leukaemic risk with low‐dose cytosine arabinoside (LD‐AraC) plus granulocyte‐macrophage colony‐stimulating factor (rh GM‐CSF). The EORTC Leukaemia Group. Infection 1992; Vol. 20 Suppl 2:116‐23. [DOI] [PubMed]
Gerhartz 1994a
- Gerhartz HH, Marcus R, Delmer A, Zwierzina H, Suciu S, Dardenne M, et al. A randomized phase II study of low‐dose cytosine arabinoside (LD‐AraC) plus granulocyte‐macrophage colony‐stimulating factor (rhGM‐CSF) in myelodysplastic syndromes (MDS) with a high risk of developing leukemia. EORTC Leukemia Cooperative Group. Leukemia 1994; Vol. 8, issue 1:16‐23. [PubMed]
Gotze 2010
- Gotze K, Platzbecker U, Giagounidis A, Haase D, Lubbert M, Aul C, et al. Azacitidine for treatment of patients with myelodysplastic syndromes (MDS): practical recommendations of the German MDS Study Group. Annals of Hematology 2010;89:841‐50. [DOI] [PubMed] [Google Scholar]
Greenberg 1997
- Greenberg P, Cox C, LeBeau MM, Fenaux P, Morel P, Sanz G, et al. International scoring system for evaluating prognosis in myelodysplastic syndromes. Blood 1997;89(6):2079‐88. [PubMed] [Google Scholar]
Hansen 1993
- Hansen PB, Johnsen HE, Hippe E, Hellstrom‐Lindberg E, Ralfkiaer E. Recombinant human granulocyte‐macrophage colony‐stimulating factor plus recombinant human erythropoietin may improve anemia in selected patients with myelodysplastic syndromes. American Journal of Hematology 1993;44:229‐36. [DOI] [PubMed] [Google Scholar]
Hellstrom‐Lindberg 1995
- Hellstrom‐Lindberg E. Efficacy of erythropoietin in the myelodysplastic syndromes: a meta‐analysis of 205 patients from 17 studies. British Journal of Haematology 1995;89(1):67‐71. [DOI] [PubMed] [Google Scholar]
Hellstrom‐Lindberg 1997
- Hellstrom‐Lindberg E, Negrin R, Stein R, Krantz S, Lindberg G, Vardiman J, et al. Erythroid response to treatment with G‐CSF plus erythropoietin for the anaemia of patients with myelodysplastic syndromes: proposal for a predictive model. British Journal of Haematology 1997;99(2):344‐51. [DOI] [PubMed] [Google Scholar]
Hellstrom‐Lindberg 1998
- Hellstrom‐Lindberg E, Ahlgren T, Beguin Y, Carlsson M, Carneskog J, Dahl IM, et al. Treatment of anemia in myelodysplastic syndromes with granulocyte colony‐stimulating factor plus erythropoietin: results from a randomized phase II study and long‐term follow‐up of 71 patients. Blood 1998;92(1):68‐75. [PubMed] [Google Scholar]
Hellström‐Lindberg 2003
- Hellström‐Lindberg E, Gulbrandsen N, Lindberg G, Ahlgren T, Dahl IM, Dybedal I, et al. Scandinavian MDS Group. A validated decision model for treating the anaemia of myelodysplastic syndromes with erythropoietin + granulocyte colony‐stimulating factor: significant effects on quality of life. British Journal of Haematology 2003; Vol. 120(6):1037‐46. [DOI] [PubMed]
Higgins 2011
- Higgins JPT, Altman DG, Sterne JAC. Chapter 8: Assessing risk of bias in included studies. Cochrane Handbook for Systematic Reviews of Interventions Version 5.1.0 (updated March 2011). The Cochrane Collaboration, 2011. Available from www.cochrane‐handbook.org, 2011. [Google Scholar]
Higgins 2011b
- Higgins JPT, Deeks JJ. Chapter 7: Selecting studies and collecting data. Cochrane Handbook for Systematic Reviews of Interventions Version 5.1.0 (updated March 2011). The Cochrane Collaboration, 2011. Available from www.cochrane‐handbook.org, 2011. [Google Scholar]
Higgins 2011c
- Higgins JPT, Deeks JJ, Altman DG. Chapter 16: Special topics in statistics. Cochrane Handbook for Systematic Reviews of Interventions Version 5.1.0 (updated March 2011). The Cochrane Collaboration, 2011. Available from www.cochrane‐handbook.org, 2011. [Google Scholar]
Jadersten 2008
- Jadersten M, Malcovati L, Dybedal I, Della Porta MG, Invernizzi R, Montgomery SM, et al. Erythropoietin and granulocyte‐colony stimulating factor treatment associated with improved survival in myelodysplastic syndrome. Journal of Clinical Oncology 2008;26(21):3607‐13. [DOI] [PubMed] [Google Scholar]
Lefebvre 2011
- Lefebvre C, Manheimer E, Glanville J. Chapter 6: Searching for studies. Cochrane Handbook for Systematic Reviews of Interventions Version 5.1.0 (updated March 2011). The Cochrane Collaboration, 2011. Available from www.cochrane‐handbook.org, 2011. [Google Scholar]
Lieschke 1992
- Lieschke GJ, Burgess AW. Granulocyte colony‐stimulating factor and granulocyte‐macrophage colony‐stimulating factor (1). New England Journal of Medicine 1992;327:28‐35. [DOI] [PubMed] [Google Scholar]
Lieschke 1994
- Lieschke GJ, Grail D, Hodgson G, Metcalf D, Stanley E, Cheers C, et al. Mice lacking granulocyte colony‐stimulating factor have chronic neutropenia, granulocyte and macrophage progenitor cell deficiency, and impaired neutrophil mobilization. Blood 1994;84(6):1737‐46. [PubMed] [Google Scholar]
Mantovani 2000
- Mantovani L, Lentini G, Hentschel B, Wickramanayake PD, Loeffler M, Diehl V. Treatment of anaemia in myelodysplastic syndromes with prolonged administration of recombinant human granulocyte colony‐stimulating factor and erythropoietin. British Journal of Haematology 2000;109:367‐75. [DOI] [PubMed] [Google Scholar]
Moher 2009
- Moher D, Liberati A, Tetzlaff J, Altman DG. Preferred Reporting Items for Systematic Reviews and Meta‐Analyses: The PRISMA Statement. Journal of Clinical Epidemiology 2009;62(10):1006‐12. [DOI] [PubMed] [Google Scholar]
Mundle 2009
- Mundle S, Lefebvre P, Vekeman F, Duh MS, Rastogi R, Moyo V. An assessment of erythroid response to epoetin alpha as a single agent versus in combination with granulocyte‐ or granulocyte‐macrophage‐colony‐stimulating factor in myelodysplastic syndromes using a meta‐analysis approach. Cancer 2009;115(4):706‐15. [DOI] [PubMed] [Google Scholar]
NCCN 2012
- Greenberg PL, Attar E, Battiwalla M, Bennett JM, Bloomfield CD, DeCastro CM, et al. Myelodysplastic syndromes. NCCN clinical practice guidlines in oncology.V.1.2012. www.nccn.org/professionals/physician_gls/PDF/mds.pdf.
Negrin 1996
- Negrin RS, Stein R, Doherty K, Cornwell J, Vardiman J, Krantz S, et al. Maintenance treatment of the anemia of myelodysplastic syndromes with recombinant human granulocyte colony‐stimulating factor and erythropoietin: evidence for in vivo synergy. Blood 1996;87(10):4076‐81. [PubMed] [Google Scholar]
O'Connor 2011
- O'Connor D, Green S, Higgins JPT. Chapter 5: Defining the review question and developing criteria for including studies. In: Higgins JPT Green S editor(s). Cochrane Handbook for Systematic Reviews of Interventions Version 5.1.0 (updated March 2011). The Cochrane Collaboration, 2011. Available from www.cochrane‐handbook.org, 2011. [Google Scholar]
Ossenkoppele 1999a
- Ossenkoppele GJ, Holt B, Verhoef GE, Daenen SM, Verdonck LF, Sonneveld P, et al. A randomized study of granulocyte colony‐stimulating factor applied during and after chemotherapy in patients with poor risk myelodysplastic syndromes: a report from the HOVON Cooperative Group. Dutch‐Belgian Hemato‐Oncology Cooperative Group. Leukemia 1999; Vol. 13, issue 8:1207‐13. [DOI] [PubMed]
Park 2008
- Park S, Grabar S, Kelaidi C, Beyne‐Rauzy O, Picard F, Bardet V, et al. GFM group (Groupe Francophone des Myélodysplasies). Predictive factors of response and survival in myelodysplastic syndrome treated with erythropoietin and G‐CSF: the GFM experience. Blood 2008;111(2):574‐82. [DOI] [PubMed] [Google Scholar]
Parmar 1998
- Parmar MK, Torri V, Stewart L. Extracting summary statistics to perform meta‐analyses of the published literature for survival endpoints. Statistics in Medicine 1998;17(24):2815‐34. [DOI] [PubMed] [Google Scholar]
Rapoport 1992
- Rapoport AP, Abboud CN, DiPersio JF. Granulocyte‐macrophage colony‐stimulating factor (GM‐CSF) and granulocyte colony‐stimulating factor (G‐CSF): receptor biology, signal transduction, and neutrophil activation. Blood Reviews 1992;6(1):43‐57. [DOI] [PubMed] [Google Scholar]
RevMan 5.3 [Computer program]
- Cochrane. Review Manager (RevMan) Version 5.3. Copenhagen: The Nordic Cochrane Centre: Cochrane, 2014.
Santini 2010
- Santini V, Alessandrino PE, Angelucci E, Barosi G, Billio A, Maio M, et al. Clinical management of myelodysplastic syndromes: update of SIE, SIES, GITMO practice guidelines. Leukemia Research 2010;34:1576‐88. [DOI] [PubMed] [Google Scholar]
Schuster 1995a
- Schuster MW, Thompson JA, Larson R, Coiffier V, Bennett J, Dugan M, et al. Randomized phase II study of recombinant granulocyte macrophage‐colony stimulating factor (rGM‐CSF) in patients with neutropenia secondary to myelodysplastic syndrome (MDS). Blood, Abstract 1341. 1995:338a.
Schünemann 2011
- Schünemann HJ, Oxman AD, Vist GE. Chapter 12: Interpreting results and drawing conclusions. Cochrane Handbook for Systematic Reviews of Interventions Version 5.1.0 (updated March 2011). The Cochrane Collaboration, 2011. Available from www.cochrane‐handbook.org, 2011. [Google Scholar]
Scott 2008
- Scott BL, Estey E. Management of myelodysplastic syndromes: 2008 update. Oncology (Williston Park, N.Y.) 2008;22(12):1344‐52. [PMC free article] [PubMed] [Google Scholar]
SEER 2010
- Altekruse SF, Kosary CL, Krapcho M, Neyman N, Aminou R, Waldron W, et al. SEER Cancer Statistics Review , 1975‐2007, National Cancer Institute. Bethesda, MD. http://seer.cancer.gov/csr/1975_2007/, based on November 2009 SEER data submission, posted to the SEER website 2010.
Smith 2006
- Smith TJ, Khatcheressian J, Lyman GH, Ozer H, Armitage JO, Balducci L, et al. 2006 update of recommendations for the use of white blood cell growth factors: an evidence‐based clinical practice guideline. Journal of Clinical Oncology 2006;24(19):3187‐205. [DOI] [PubMed] [Google Scholar]
Steensma 2006
- Steensma DP, Bennett JM. The myelodysplastic syndromes: diagnosis and treatment. Mayo Clinic proceedings. Mayo Clinic 2006;81(1):104‐30. [DOI] [PubMed] [Google Scholar]
Sterne 2011
- Sterne JAC, Egger M, Moher D. Chapter 10: Addressing reporting biases. Cochrane Handbook for Systematic Reviews of Interventions Version 5.1.0 (updated March 2011). The Cochrane Collaboration, 2011. Available from www.cochrane‐handbook.org, 2011. [Google Scholar]
Tefferi 2009
- Tefferi A, Vardiman JW. Myelodysplastic syndromes. New England Journal of Medicine 2009;361(19):1872‐85. [DOI] [PubMed] [Google Scholar]
Tierney 2007
- Tierney JF, Stewart LA, Ghersi D, Burdett S, Sydes MR. Practical methods for incorporating summary time‐to‐event data into meta‐analysis. Trials 2007;8:16. [DOI] [PMC free article] [PubMed] [Google Scholar]
Vardiman 2008
- Vardiman JW, Brunning RD, Arber DA, et al. Introduction and overview of the classification of myeloid neoplasms. In: Swerdlow, SH, Campo, E, Harris, NL, et al. editor(s). WHO classification of tumors of hematopoietic and lymphoid tissues. 4. WHO Press, 2008:18. [Google Scholar]
Verbeek 1999a
- Verbeek W, Wörmann B, Koch P, Aul C, Hinrichs HF, Balleisen L, et al. Results of a randomized double‐blind placebo‐controlled trial evaluating sequential high‐dose cytosine arabinoside/mitoxantrone chemotherapy with or without granulocyte/macrophage‐colony‐stimulating factor in high‐risk myelodysplastic syndromes. Journal of Cancer Research and Clinical Oncology 1999; Vol. 6:369‐74. [DOI] [PMC free article] [PubMed]
Williamson 1989
- Williamson PJ, Oscier DG, Mufti GJ, Hamblin TJ. Pyogenic abscesses in the myelodysplastic syndrome. BMJ 1989;299(6695):375‐6. [DOI] [PMC free article] [PubMed] [Google Scholar]
Zwierzina 2005a
- Zwierzina H, Suciu S, Loeffler‐Ragg J, Neuwirtova R, Fenaux P, Beksac M, et al. Low‐dose cytosine arabinoside (LD‐AraC) vs LD‐AraC plus granulocyte/macrophage colony stimulating factor vs LD‐AraC plus Interleukin‐3 for myelodysplastic syndrome patients with a high risk of developing acute leukemia: final results of a randomized phase III study (06903) of the EORTC Leukemia Cooperative Group. Leukemia 2005; Vol. 19, issue 11:1929‐33. [DOI] [PubMed]