

Abstract
The results of in vitro dynamic thrombogenicity testing of biomaterials and medical devices can be significantly impacted by test conditions. To develop and standardize a robust dynamic in vitro thrombogenicity tool, the key test parameters need to be appropriately evaluated and optimized. We used a flow loop test system previously developed in our laboratory to investigate the effects of sample length and the number of samples per test loop on the thrombogenicity results. Porcine blood heparinized to a donor-specific target concentration was recirculated at room temperature through polyvinyl chloride (PVC) tubing loops containing test materials for 1 h at 200 mL/min. Four test materials (polytetrafluoroethylene (PTFE), latex, PVC, and silicone) with various thrombotic potentials in two sample lengths (12 and 18 cm) were examined. For the 12-cm long materials, two different test configurations (one and two samples per loop) were compared. Thrombogenicity was assessed through percent thrombus surface coverage, thrombus weight, and platelet count reduction in the blood. The test system was able to effectively differentiate the thrombogenicity profile of the materials (latex > silicone > PVC ≥ PTFE) at all test configurations. Increasing test sample length by 50% did not significantly impact the test results as both 12 and 18 cm sample lengths were shown to equally differentiate thrombotic potentials between the materials. The addition of a second test sample to each loop did not increase the test sensitivity and may produce confounding results, and thus a single test sample per loop is recommended.
Keywords: blood flow loop, platelets, thrombosis, thrombogenicity, in vitro assay
Introduction
Blood-contacting medical devices, including various cardiovascular, neurovascular, and hemodialysis devices, are widely used for diagnosis and treatment of millions of patients each year. However, due to the non-physiological blood flow patterns induced by the devices and the exposure of patient blood to foreign materials, thrombosis related complications frequently occur in patients. Both long term and short term use devices can cause thrombosis, resulting in patient morbidity or death [1–8]. Thus, thrombogenicity evaluation of blood-contacting medical devices and biomaterials prior to clinical use is important for ensuring patient safety and is generally needed for regulatory approval/clearance of new devices [9,10]. Current preclinical thrombogenicity testing approaches rely heavily on animal studies, which are not only very resource-demanding but also sometimes produce questionable data due to confounding factors and inherent limitations of the animal models. For example, in the commonly used in vivo non-anticoagulated venous implant (NAVI) assay, the implant technique, the device placement, the blood coagulability of individual animals, and the size of the device as compared to the diameter of the vessel may all affect thrombus formation and lead to inconsistent thrombogenicity predictions [10–12]. In addition, this type of in vivo test requires the animals to be sacrificed and may cause ethical concerns.
In an effort to resolve some of the issues associated with the NAVI assay, we developed an in vitro blood flow loop thrombogenicity test system described in a previous study using ovine blood [13]. This dynamic flow loop test system was able to effectively compare the thrombogenicity of biomaterials in catheter-like geometries [13]. In a separate study, we also found that ovine, porcine, and bovine blood may be suitable alternatives to human blood for differentiating between thromboresistant and thrombogenic materials if appropriate control materials and donor-specific anticoagulation levels are used [14]. Additionally, in a third study comparing the effect of test temperature, we found that, compared to room temperature, testing at 37 °C did not appear to increase the sensitivity of the dynamic thrombogenicity assay [15]. While the above studies established the framework of the dynamic test system and provided a new static pretest method to estimate donor-specific anticoagulation levels, there are still several key test conditions (e.g., test sample dimensions and preparation, blood flow rates, and test durations) that require further investigation. Several in vitro flow loop thrombogenicity test systems have also been described by other research groups [11,16–26]. However, the test conditions and test protocols vary greatly among these reported methods. For example, while most blood flow loops used only one test sample per loop, up to three negative and positive control samples per loop were used in the study by Grove et al. [11] Since the appropriate test conditions may be dependent on the individual test system, it is important to evaluate the key test parameters for each test system to optimize the test sensitivity and understand each loop's capabilities. To build on the framework established in our previous studies [13–15] toward developing and standardizing a robust dynamic in vitro thrombogenicity test system, we investigated the effects of test sample length and the number of test samples per loop on the thrombogenicity results and the test sensitivity of our dynamic test system in the current study.
Materials and Methods
Test Materials.
Four materials with varying thrombogenic potentials were tested in this study: a negative control polytetrafluoroethylene (PTFE), a positive control latex [27], and two commonly used biomaterials, polyvinyl chloride (PVC) and silicone. Except for PTFE, which was available as a solid cord with a diameter of 2.5 mm, all the other test materials were available as small-bore tubing with an outer diameter of 3.2 mm. Both ends of the tubing were plugged with a PTFE cord to prevent blood from entering the lumen of the three tubing materials.
Blood Preparation and Static Pretest Using Latex Tubes.
Donor porcine blood (Lampire Biological Laboratories Inc, Pipersville, PA) was drawn into containers with anticoagulant citrate dextrose solution A (ACDA, the volume ratio of ACDA to whole blood was 15:85), shipped to the testing laboratory overnight, and testing was completed within 24–36 h of the blood draw. The study was performed with blood from a total of twelve unique donors on twelve separate days, with blood from six donors used to study the effect of test sample length and the other six for the effect of test sample number per test loop. Immediately before starting each dynamic flow test, the blood was recalcified and heparinized to a donor-specific concentration. Similar to previous studies, the blood was recalcified by adding an appropriate amount of CaCl2 solution to the blood to obtain a targeted CaCl2 concentration of 13 mM in whole blood [13,28,29].
A static thrombosis-based pretest developed in a previous study was utilized to help determine the donor specific heparin concentration [13]. The incubation time, temperature, and heparin concentration range used were modified to account for species differences (ovine versus porcine) in response to heparin anticoagulation. Briefly, latex tubes (4 cm length, 4.8 mm ID, and 8.0 mm OD, Fisher Scientific, catalog #S50616A) were incubated in recalcified blood (8 cm2/mL latex surface area to blood volume) under a series of heparin concentrations (3.0–7.0 U/ml, 0.5 U/ml increments) for 15 min at 37 °C (Fig. 1(a)) with gentle agitation (Edvotek® 10 L Digital Shaking Waterbath, Edvotek Inc., Washington, DC) set at 60 rpm. Based on preliminary data that correlated the thrombus formation from the static pretest to material performance in the dynamic test, the minimum heparin level that resulted in a thrombus surface coverage ≤ 10% on the latex tubes during the pretest was defined as the threshold concentration. The initial concentration used to start the flow loop testing was selected to be 1.5 U/mL less than the threshold concentration. For example, if the threshold concentration was 5.0 U/mL, then the initial concentration used in the flow loops would be 3.5 U/mL (Fig. 1(b)).
Fig. 1.

(a) Schematic of static pretest protocol to assess donor-specific blood coagulability using latex tubing. (b) Representative images of thrombus coverage from the static latex tubing pretest. For this specific donor, the threshold concentration was determined to be 5.0 U/ml and 3.5 U/ml (1.5 U/ml less than the threshold concentration) of heparin was chosen as the initial heparin concentration in the flow loop.
Flow Loop Assembly.
The dynamic recirculating blood flow loop was based on a system developed previously in our laboratory [13]. It consisted of a reusable section of PVC tubing (32 cm long, 6.4 mm ID), that was used for all tests conducted with the same donor blood, inserted into a roller pump and connected to the material test section via 6.4 mm OD straight polypropylene connectors. In this study, we utilized three flow loop configurations (Table 1, Fig. 2) to evaluate the effect of test sample length and number of samples per test loop on the thrombogenicity results. The first two flow loop configurations (Single-12 and Single-18) contained only one 12 cm or 18 cm long test sample in the loop; the third flow loop configuration (Double-12) contained two 12 cm long test samples in the loop. Of note, as we evaluated the effects of sample length and sample number/loop separately with different groups of donors (six unique blood donors per comparison), the 12-cm single sample configuration (Single-12) was used in both comparisons. The test sections of the flow loop were prepared by introducing one or two test materials into the straight lumen sections of PVC tubing (6.4 mm ID) through a small cut in the PVC tubing wall (Fig. 2(a)) and securing the materials within the tubing by sealing the incision site around the material with Parafilm (Bemis Company Inc, Neenah, WI). For the Double-12 configuration, the first test sample was inserted 5 cm distal to the tubing connector exiting the pump (1st position, Fig. 2(c)) and the second sample was positioned so its end was 5 cm proximal to the tubing connector at the pump inlet (2nd position, Fig. 2(c)). To maintain similar flow rates within the loops throughout the experiments, the pump tubing sections were exercised with phosphate buffered saline (PBS) for 30 min at 70 rpm and the roller occlusion was adjusted so that the time-averaged generated pressure for each roller pump head was 150 mmHg (at 50 rpm) prior to the start of the blood circulation experiments.
Table 1.
Flow loop configurations
| Configuration label | PVC loop test section length (cm) | Test sample length (cm) | Samples per loop | Blood volume (ml) |
|---|---|---|---|---|
| Single-12 | 45 | 12 | 1 | 26 |
| Single-18 | 51 | 18 | 1 | 28 |
| Double-12 | 71 | 12 | 2 | 35 |
Fig. 2.

Experimental setup of the dynamic flow loop. The loop consists of PVC Tubing (ID 6.4 mm, length 32 cm) that is inserted into a roller pump and connected to a test sample section: (a)Representative image of a test material inserted into the PVC tubing “test material segment” of the flow loop, (b) one 12 cm long sample/loop, (c) one 18 cm sample/loop, and (d) two 12 cm samples/loop. For each of the above configurations, the multichanneled roller pump was used to drive two identical flow loops, allowing comparison of two different test materials simultaneously.
Blood Circulation.
Whole blood was added to the flow loop and circulated at room temperature (approximately 21–25 °C) at a targeted flowrate of 200 mL/min (65 rpm) for each of the test samples. The average flowrate was measured to be 203 ± 4 ml/min. This flowrate was selected to produce a physiological venous shear rate of approximately 130 s−1. After 1 h circulation, the loops were drained and gently rinsed with PBS at a reduced pump speed of 50 rpm to avoid thrombus dislodgement from the test samples. The PVC tubing test sections were removed from the loops and dissected with a blade. The test samples were then carefully removed from the tubing, photographed, and visually inspected for thrombus deposition. Before starting the next test, the reusable pump-head tubing sections of the loops were vigorously rinsed by recirculating PBS for around 3 min at the highest rpm setting of the pump (flowrate of approximately 2 L/min). The loops were then drained, and a swab was used to remove any visible thrombi that were attached to the inner lumen of the PVC tubing, before performing a final rinse with PBS.
To verify that the initial heparin concentration selected from the static pretest would provide appropriate anticoagulation during the dynamic testing for each blood pool, a set of control materials (negative control PTFE and positive control latex) were investigated first using the dynamic test loops. If the thrombus surface coverage produced on the PTFE was ≤ 10% and on the latex was > 50% (classified as severe thrombus according to NAVI scoring scheme in the ISO 10993-4 standard [10]), the initial heparin concentration was used for the remainder of the dynamic loop experiments. Although the NAVI scoring scheme categorizes 1–25% thrombus surface coverage as minimal thrombus [10], a lower thrombus surface coverage threshold (10%) [13] on the negative control was used for this study to reduce the variance of the test and to allow for a larger percentage differentiation between the positive and negative control materials. If the thrombus surface area deposition was > 10% on the PTFE material or < 50% on the latex, the heparin concentration was increased or decreased by 0.5 U/mL, respectively. This verification process was repeated until the thrombus surface area coverage on the control materials tested in the dynamic loops was within the acceptance criteria range (PTFE ≤ 10% and latex ≥ 50%). Once an acceptable heparin concentration was determined, this donor-specific heparin concentration was used in the dynamic flow loop tests to investigate the remaining test materials in a random order. Approximately 33% of the received donor blood had to be discarded because an acceptable heparin concentration could not be identified in the dynamic flow loop.
Data Collection and Statistical Analysis.
To characterize thrombogenicity of the test samples, the percent of thrombus surface coverage, thrombus weight, and platelet count reduction were measured. To obtain the thrombus-covered surface areas of the test samples, the lengths of the thrombi were measured using a ruler and their widths were determined by estimating the fraction of the material's circumference covered by the thrombi. Then the percent of thrombus surface coverage was calculated by the following equation:
To determine the thrombus weight after the dynamic flow loop testing, the test materials were dried overnight (≥ 12 h at room temperature) and their weights were measured using an analytical balance (Mettler Toledo, XS64 Analytical Balance). The original test material weight, that was collected prior to insertion in the flow loop, was subtracted from the post-test measurement to calculate the dry weight of the adherent thrombi. To account for the diameter difference between the test materials, the dry thrombus weight was then divided by the blood contacting surface area of the test material to obtain a normalized thrombus weight value (mg/cm2). Blood platelet counts were measured before and after the 1 h circulation duration using a complete blood cell counter (Hemavet 950 FS, Drew Scientific Inc., FL) to determine the extent of platelet count reduction during the test. The data were statistically analyzed using a one-way analysis of variance (ANOVA) with a Fisher pairwise comparisons post hoc test. The results were considered statistically significant if p < 0.05.
Results
Donor-Specific Heparin Concentrations.
Based on the static thrombosis pretest assessment of latex tubing and the dynamic loop verification test with the negative and positive controls, the donor-specific final heparin concentrations utilized in the test flow loops ranged from 3.5 U/mL to 5.5 U/mL. It was observed that a change in concentration of 1.0 U/mL of heparin had a substantial effect on the extent of thrombus deposition, and a small number of donors was sensitive to an adjustment as low as 0.5 U/mL of heparin. For all the dynamic loop tests in which the blood samples met the thrombus-coverage acceptance criteria of the positive and negative controls, the static pretest was able to predict the effective final heparin concentration for each donor within ± 0.5 U/mL.
Impact of Test Sample Length.
Representative images of thrombus deposition on the 12 cm and 18 cm long test samples are shown in Fig. 3. The percentage thrombus surface coverage, thrombus weight (normalized to the test sample surface area), and the platelet count reduction in the test blood after 1 h of blood circulation are shown in Figs. 4–6, respectively. For both test sample lengths, latex had significantly more thrombus deposition (thrombus surface area coverage and thrombus weight) and platelet reduction than all the other test materials (p < 0.05), with only one exception: there was no significant difference in platelet count reduction between the latex and the silicone samples for the 18 cm length. Silicone exhibited intermediate thrombogenicity compared to the other materials with significantly more thrombus surface area coverage, thrombus weight, and platelet count reduction than PTFE and PVC at both test sample lengths (p < 0.05).
Fig. 3.

Representative images of thrombus formation on the 12 cm and 18 cm length test materials after 1 h of blood circulation. Blood flow direction was from right to left.
Fig. 4.

The effect of test sample length on % thrombus surface area coverage after 1 h of blood circulation (N = 6)
Fig. 6.

The effect of test sample length on the reduction of platelet count within the blood after 1 h of circulation (N = 6)
Fig. 5.

The effect of test sample length on adhered dry thrombus weight, normalized to each test material's surface area, after 1 h of blood circulation (N = 6)
Impact of Doubling Number of Test Samples in Each Loop.
The test results when adding a second sample to the loop are shown in Figs. 7–9. For the three thrombogenicity markers (thrombus surface coverage %, thrombus weight, and platelet reduction), the single sample testing (Single-12) and the double sample testing (Double-12) exhibited the same relative thrombogenicity trend among the different test materials: latex > silicone > PVC ≥ PTFE. From the statistical p-values shown in Figs. 7–9, the relative thrombogenicity comparisons for the test materials within the Single-12 and Double-12 test loops were the same, except for the following two cases: (1) Silicone had significantly more thrombus surface coverage than PTFE and PVC in the Single-12 loop (p < 0. 05), but only had significantly more thrombus surface coverage than PTFE for the samples in the Double-12 loop. (2) The normalized thrombus weights of the silicone samples in the Single-12 loop and in the second position of the Double-12 loop were significantly greater than PTFE and PVC (P < 0.05), but the difference was not significant (P > 0.05) for the first position material of the Double-12 loop. When comparing the thrombus surface coverage and thrombus weight between the first and the second sample positions in the Double-12 loop, there were no statistically significant differences except for one case: The normalized thrombus weight for the latex in the first position of the Double-12 loop was significantly less than the latex in the second position of the Double-12 loop (p < 0.05). Representative images demonstrating different thrombus deposition in the first and second positions of Double-12 loops are shown in Fig. 10.
Fig. 7.

The effect of the number of samples per loop on % thrombus surface area coverage after 1 h of blood circulation (N = 6)
Fig. 9.
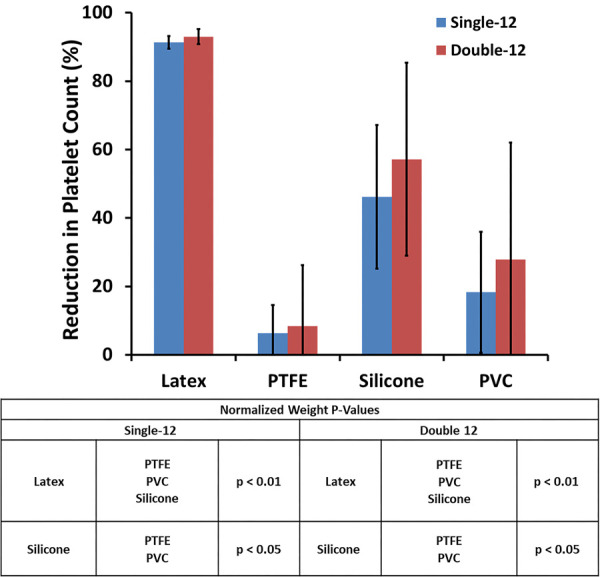
The effect of the number of samples per loop on the reduction of platelet concentration within the blood after 1 h of circulation (N = 6)
Fig. 10.

Representative images of nonuniform thrombus deposition across two test materials inserted into the same flow loop
Discussion
The main differences between the current study and our previous dynamic flow loop thrombogenicity study [13] were: (1) The blood species utilized was porcine instead of ovine, (2) two sample lengths were studied (Single-12 cm and Single-18 cm lengths), and (3) test sample number in select flow loops was varied from one to two (Single-12 cm versus Double-12 cm). All the other test parameters were the same between the two studies (e.g., test duration, blood temperature, age of the blood, thrombogenicity characterization methods, etc.). The justifications for selecting these test parameters were thoroughly discussed in our previous publications [13–15]. Of note, testing at room temperature was chosen because it eliminates the need for cumbersome heating equipment and simplifies the test system, which improves testing efficiency. Additionally, in a previous study with our flow loop test system, compared to room temperature, testing at 37 °C did not appear to increase the sensitivity of the in vitro thrombogenicity test [15].
The rationale for why we selected the specific thrombogenicity characterization markers has been discussed previously [13]. Briefly, thrombus surface area coverage is a common thrombogenicity marker used in NAVI in vivo studies [10] and in some dynamic in vitro assays [11], and has been shown to provide a reasonable assessment of hemocompatibility. However, the results may be affected by the subjective judgment of an evaluator because the surface coverage is measured manually. Also, it does not consider the thickness of the thrombi. The normalized dry thrombus weight was utilized along with the thrombus surface area coverage to provide a more comprehensive thrombogenicity assessment, as the thrombus weight takes thrombus thickness into account. The reduction in circulating platelets was also included in this study as another measurement of thrombogenicity. For the specific materials tested, a larger reduction in platelet count was generally associated with a greater thrombus surface area coverage; however, this relationship may not be true for all device materials. Measuring the reduction in circulating platelets within this flow system may help to detect thrombogenic devices or materials that are also nonthromboadherent.
We chose to utilize porcine blood because, like ovine blood, it is commonly used as a substitute for human blood for thrombogenicity testing [14,19,22,26,30–32]. Additionally, in a previous study, we found that porcine blood may be a suitable alternative to human blood for use in an in vitro flow loop thrombogenicity test [14]. Other studies that examined activation and adhesion of platelets from various species identified substantial differences between ovine and porcine blood [30–32]. Goodman et al. and Pelagalli et al. reported that ovine platelets were less active than porcine blood [30,31]. However, no universal agreement exists regarding the relative activity of blood from different species. When comparing the results from the current study with the results from our previous publication [13], it does appear that there are some differences in the coagulability of the different species blood. The final donor-specific heparin concentration range used in the dynamic flow loops was substantially higher for porcine blood (3.5–5.5 U/mL) than that of ovine blood (1.4–1.8 U/mL), suggesting that the porcine blood may be more coagulable than ovine blood. Additionally, the incubation time, temperature, and heparin concentration range used for the static latex pretest needed to be modified from 30 min at room temperature with a heparin concentration range of 1.0–2.4 U/ml in 0.2 U/ml increments for ovine blood to 15 min at 37 °C with a heparin concentration range of 3.0–7.0 U/ml in 0.5 U/ml increments for porcine blood to reliably predict the donor specific heparin concentration. Despite these differences, the dynamic flow loop test system was able to effectively differentiate the thrombogenicity of biomaterials in catheter-like geometries with both porcine and ovine blood. This data further support the conclusions of our previous study comparing blood from different species suggesting that multiple blood sources may be appropriate for use in this dynamic in vitro assessment if suitable negative and positive controls are included, and donor-specific and species-dependent heparin concentrations are utilized [14].
For our previous study, we selected one 12 cm long test sample per loop (same as single-12 in this study) to minimize the blood volume required per loop and to allow for multiple loops to be tested with blood from a single donor [13]. In the first part of the current study, we increased the length of the test sample by 50% to 18 cm and evaluated the effect of sample length on the system's ability to differentiate the relative thrombogenicity of different materials. To ensure that the test sample remained straight within the loop and to avoid any blood flow disturbances that may occur due to bending or curving of the test material, the length of the test section of the flow loop was also increased by 6 cm for the 18 cm long test sample. The data in Figs. 4–6 demonstrated that the test sample length did not have a significant effect on the relative thrombogenicity results. The system was able to effectively differentiate the relative thrombogenicity of materials at both sample lengths (latex > silicone >PVC ≥ PTFE), but the test sensitivity did not increase for the longer 18 cm samples. This suggests that the system may be able to be catered to evaluate devices of varying sizes. However, since only a limited range of lengths were investigated, further testing will need to be performed to determine the minimum and maximum test sample lengths that can be reliably evaluated in the in vitro dynamic blood flow loop system.
The second part of the current study was to investigate the effect of multiple test samples in the same flow loop (Fig. 2(d)). There are some potential benefits to including multiple test samples within a single loop. A larger number of samples can be tested in a study, and it could help demonstrate test consistency within a loop. Additionally, if a device is relatively small, the use of multiple samples per loop would help to increase the surface area to blood volume ratio of the test device. A blood flow loop test system containing multiple samples per loop was developed by Grove et al. [11] to evaluate the relative thrombogenicity of medical devices and biomaterials. Their control loops were prepared by inserting up to three positive control materials (abraded uncoated Polyurethane tubing) in one loop and three negative control materials (heparin coated polyurethane tubing) in another loop. Two additional loops containing one test article per loop were also included in that study. The results from Grove et al. showed that their test system was able to effectively differentiate between the positive and negative controls based on relative thrombus surface coverage. Furthermore, the authors did not note inconsistencies in thrombus deposition observed on the positive or negative control articles tested within their respective flow loops. However, in our current study, we did not observe any notable improvement in the test sensitivity when comparing the results between the two-sample and one-sample per loop testing, and we did not observe any other benefit of including multiple samples in the same loop. Conversely, we found that including multiple samples per loop could increase the complexity of the test and may also increase the likelihood of producing confounding results between the multiple test samples. For example, in some of the loops that contained two latex samples, the latex in the first position generated significantly less thrombus deposition than the latex in the second position (Figs. 8–10). While the actual mechanism that causes the difference is not apparent to us and its investigation is beyond the scope of the current study, the potential difference in the blood flow patterns (e.g., the blood flow pulsatility produced by the roller pump is expected to be greater at the position closer to the exit of the pump and will likely be dampened downstream) could have contributed to the thrombus deposition difference at the different test positions. Regardless of the cause, if similar discrepancies were produced while testing multiple medical devices per loop, it would make it more difficult to interpret the results and determine the device's relative thrombogenicity potential. Thus, including only a single test article per loop in a dynamic in vitro thrombogenicity assay may reduce the chances of producing confounding results and simplifying data interpretation.
Fig. 8.
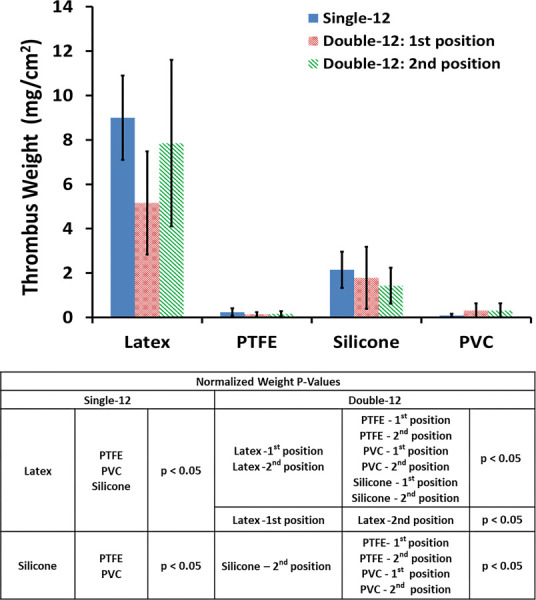
The effect of the number of samples per loop on adhered dry thrombus weight, normalized to each test material's surface area, after 1 h of blood circulation (N = 6)
There are several differences between the test parameters used for the flow loop systems used in the current study and the one developed by Grove et al. [11] Grove et al. circulated fresh heparinized ovine blood for 4 h at 30–32 °C through flow loops containing up to three 10 cm length control or test articles. The inner diameter of the flow loop tubing and volume of blood used per loop was large in the Grove et al. study compared to the current study (9.5 mm versus 6.4 mm and 100 mL versus 35 mL, respectively), while the outer diameter of the positive control materials was smaller in the Grove et al. study compared to the current study (1.7 mm versus 3.2 mm). These differences in test parameters may have contributed to the more consistent thrombus deposition observed on the multiple control samples per loop in the Grove et al. study. In addition, the use of abraded positive control articles in the Grove et al. study may have also contributed to more consistent thrombus deposition on multiple samples in the same test loop, because abrading the tubing increases the blood contacting surface area of the control article which could promote better platelet adhesion and a more uniform thrombus deposition compared to a smooth sample. While multiple samples in the same loop might work well with abraded positive controls, it may not work for actual medical device test samples that generally have smooth surfaces. We plan to perform further studies in the future to evaluate the effect of surface roughness on thrombus deposition within the flow loop system.
There are several limitations to this study. First, like many laboratories, we are not able to obtain freshly drawn donor porcine blood, so we investigated the usability of donor blood that was drawn and shipped overnight to our laboratory and used within 24–36 h postdraw. To ensure that the blood had relatively normal coagulability after overnight shipping, positive and negative control materials (PTFE and Latex) were utilized within the dynamic flow loop to qualify the blood from each donor, with the requirement to meet the thrombus surface coverage inclusion criteria (PTFE < 10%, latex > 50%) to be usable. Even though our data showed that most of the blood shipments that we received were able to meet the above thrombus coverage criteria and allowed the test loop system to effectively compare the relative thrombogenicity of the test materials, approximately one-third of the received donor blood could not be adjusted with heparin to meet the above inclusion criteria and could not be used to complete the testing. Despite this limitation, it is still more efficient and cost-effective to use a commercial source to obtain 24 h postdraw porcine blood for the testing, in comparison to maintaining an animal facility to obtain freshly drawn blood.
Another limitation is that the outer diameter of the negative PTFE control material was smaller than all the other test materials (2.5 mm and 3.5 mm, respectively). To mitigate the possible effect of diameter on the results, the dry thrombus weight was normalized to the blood contacting surface area of the test materials. Of note, the test system was able to effectively differentiate the relative thrombogenicity potentials of the test materials that had the same outer diameters (latex > Silicone > PVC).
While medical devices often combine different materials together, only smooth catheter-like test samples with simple geometry were evaluated in the flow loop test system in the current study. Future studies will need to be performed to evaluate whether the thrombogenicity of devices with more complex geometries and surfaces can be effectively differentiated using this dynamic flow loop test system. Lastly, the test methodology developed in this study requires more validation, including interlaboratory studies, prior to standardization. In future studies, we will also investigate other key test parameters (circulation time, flowrate, anticoagulation, test surface area to blood volume ratio, additional sample lengths, etc.) to aid in the development of a more robust dynamic in vitro thrombogenicity assessment tool.
Conclusion
The dynamic flow loop test system was able to effectively compare the thrombogenicity of biomaterials in catheter-like geometries in all three configurations. The test sample length did not have a significant effect on the relative thrombogenicity results. In this system, a sample length of 12 cm was sufficient to enable the differentiation of materials with various thrombogenic potentials. However, up to 18 cm in sample length has been shown to be acceptable. The addition of a second material sample to the loop did not increase the test sensitivity and may produce confounding results, and thus we recommend one test sample per test loop for simplicity and test consistency.
Acknowledgment
We wish to thank Dr. Mehulkumar Patel at the FDA for reviewing the paper and for providing valuable input. This work was supported financially by funding from the FDA Center for Devices and Radiological Health Critical Path Program. This project was also supported in part by an appointment to the Research Participation Program at the FDA, administered by the Oak Ridge Institute for Science and Education through an interagency agreement between the U.S. Department of Energy and FDA.
Disclaimer
The mention of commercial products and/or manufacturers does not imply endorsement by the FDA or the U.S. Department of Health and Human Services.
Data Availability Statement
The datasets generated and supporting the findings of this article are obtainable from the corresponding author upon reasonable request.
References
- [1]. Wiper, A. , Hashmi, I. , Srivastava, V. , Shaktawat, S. , Sogliani, F. , Tang, G. , Chauhan, A. , et al., 2014, “ Guide Wire Thrombus Formation During Trans-Femoral TAVI,” Cardiovasc. Revasc. Med., 15(6–7), pp. 360–361. 10.1016/j.carrev.2014.04.001 [DOI] [PubMed] [Google Scholar]
- [2]. Chin, T. , Priyesh, P. , and Islam, A. M. , 2017, “ A Novel Approach to Extraction of a Large Thrombus on the Intraventricular Guide-Wire During Transcatheter Aortic Valve Replacement,” Catheter. Cardiovasc. Interventions, 89(3), pp. 495–498. 10.1002/ccd.26113 [DOI] [PubMed] [Google Scholar]
- [3]. Scalone, G. , Brugaletta, S. , Garcia-Garcia, H. M. , Martin-Yuste, V. , Azpeitia, Y. , Otsuki, S. , Gomez, O. , et al., 2015, “ Frequency and Predictors of Thrombus Inside the Guiding Catheter During Interventional Procedures: An Optical Coherence Tomography Study,” Int. J. Cardiovasc. Imaging, 31(2), pp. 239–246. 10.1007/s10554-014-0544-3 [DOI] [PubMed] [Google Scholar]
- [4]. Gobeil, F. , Juneau, C. , and Plante, S. , 2002, “ Thrombus Formation on Guide Wires During Routine PTCA Procedures: A Scanning Electron Microscopic Evaluation,” Can. J. Cardiol., 18(3), pp. 263–269.https://pubmed.ncbi.nlm.nih.gov/11907615/ [PubMed] [Google Scholar]
- [5]. Eckman, P. M. , and John, R. , 2012, “ Bleeding and Thrombosis in Patients With Continuous-Flow Ventricular Assist Devices,” Circulation, 125(24), pp. 3038–3047. 10.1161/CIRCULATIONAHA.111.040246 [DOI] [PubMed] [Google Scholar]
- [6]. de Mel, A. , Cousins, B. G. , and Seifalian, A. M. , 2012, “ Surface Modification of Biomaterials: A Quest for Blood Compatibility,” Int. J. Biomater., 2012, pp. 1–8. 10.1155/2012/707863 [DOI] [PMC free article] [PubMed] [Google Scholar]
- [7]. Li, S. , and Henry, J. J. , 2011, “ Nonthrombogenic Approaches to Cardiovascular Bioengineering,” Annu. Rev. Biomed. Eng., 13(1), pp. 451–475. 10.1146/annurev-bioeng-071910-124733 [DOI] [PubMed] [Google Scholar]
- [8]. Cunningham, E. J. , Fiorella, D. , and Masaryk, T. J. , 2005, “ Neurovascular Rescue,” Semin. Vasc. Surg., 18(2), pp. 101–109. 10.1053/j.semvascsurg.2005.04.007 [DOI] [PubMed] [Google Scholar]
- [9].U.S. Food and Drug Administration, 2020, “Guidance for Industry and Food and Drug Administration Staff: Use of International Standard ISO 10993-1, “Biological Evaluation of Medical Devices - Part 1: Evaluation and Testing Within a Risk Management Process”,” U.S. Food and Drug Administration (FDA), Silver Spring, MD.https://www.fda.gov/media/85865/download [Google Scholar]
- [10].International Organization for Standardization, 2017, ISO 10993-4: Biological Evaluation of Medical Devices - Part 4: Selection of Tests for Interactions With Blood, The International Organization for Standardization (ISO), Arlington, VA. [Google Scholar]
- [11]. Grove, K. , Deline, S. M. , Schatz, T. F. , Howard, S. E. , Porter, D. , and Smith, M. E. , 2017, “ Thrombogenicity Testing of Medical Devices in a Minimally Heparinized Ovine Blood Loop,” ASME J. Med. Device, 11(2), p. 021008. 10.1115/1.4035724 [DOI] [Google Scholar]
- [12]. Wolf, M. F. , and Anderson, J. M. , 2020, “ Practical Approach to Blood Compatibility Assessments: General Considerations and Standards,” Biocompatibility and Performance of Medical Devices, Boutrand J. P., ed., Woodhead Publishing, Cambridge, UK, pp. 167–205. 10.1016/B978-0-08-102643-4.00008-2 [DOI] [Google Scholar]
- [13]. Jamiolkowski, M. A. , Hartung, M. C. , Malinauskas, R. A. , and Lu, Q. , 2020, “ An In Vitro Blood Flow Loop System for Evaluating the Thrombogenicity of Medical Devices and Biomaterials,” ASAIO J., 66(2), pp. 183–189. 10.1097/MAT.0000000000000958 [DOI] [PMC free article] [PubMed] [Google Scholar]
- [14]. Jamiolkowski, M. A. , Patel, M. , Golding, M. D. , Malinauskas, R. A. , and Lu, Q. , 2022, “ Comparison of Animal and Human Blood for In Vitro Dynamic Thrombogenicity Testing of Biomaterials,” Artif. Organs, 46(12), pp. 2400–2411. 10.1111/aor.14366 [DOI] [PMC free article] [PubMed] [Google Scholar]
- [15]. Patel, M. , Jamiolkowski, M. A. , Vejendla, A. , Bentley, V. , Malinauskas, R. A. , and Lu, Q. , 2023, “ Effect of Temperature on Thrombogenicity Testing of Biomaterials in an In Vitro Dynamic Flow Loop System,” ASAIO J., 69(6), pp. 576–582. 10.1097/MAT.0000000000001897 [DOI] [PMC free article] [PubMed] [Google Scholar]
- [16]. Krajewski, S. , Neumann, B. , Kurz, J. , Perle, N. , Avci-Adali, M. , Cattaneo, G. , and Wendel, H. P. , 2015, “ Preclinical Evaluation of the Thrombogenicity and Endothelialization of Bare Metal and Surface-Coated Neurovascular Stents,” AJNR Am. J. Neuroradiol., 36(1), pp. 133–139. 10.3174/ajnr.A4109 [DOI] [PMC free article] [PubMed] [Google Scholar]
- [17]. Stang, K. , Krajewski, S. , Neumann, B. , Kurz, J. , Post, M. , Stoppelkamp, S. , Fennrich, S. , et al., 2014, “ Hemocompatibility Testing According to ISO 10993-4: Discrimination Between Pyrogen- and Device-Induced Hemostatic Activation,” Mater. Sci. Eng. C, 42, pp. 422–428. 10.1016/j.msec.2014.05.070 [DOI] [PubMed] [Google Scholar]
- [18]. van Oeveren, W. , Tielliu, I. F. , and de Hart, J. , 2012, “ Comparison of Modified Chandler, Roller Pump, and Ball Valve Circulation Models for In Vitro Testing in High Blood Flow Conditions: Application in Thrombogenicity Testing of Different Materials for Vascular Applications,” Int. J. Biomater., 2012, pp. 1–7. 10.1155/2012/673163 [DOI] [PMC free article] [PubMed] [Google Scholar]
- [19]. Walker, E. K. , Nauman, E. A. , Allain, J. P. , and Stanciu, L. A. , 2015, “ An In Vitro Model for Preclinical Testing of Thrombogenicity of Resorbable Metallic Stents,” J. Biomed. Mater. Res. A, 103(6), pp. 2118–2125. 10.1002/jbm.a.35348 [DOI] [PubMed] [Google Scholar]
- [20]. Böswald, M. , Lugauer, S. , Bechert, T. , Greil, J. , Regenfus, A. , and Guggenbichler, J. , 1999, “ Thrombogenicity Testing of Central Venous Catheters In Vitro,” Infection, 27(S1), pp. S30–S33. 10.1007/BF02561614 [DOI] [PubMed] [Google Scholar]
- [21]. Nguyen, K. T. , Su, S. H. , Sheng, A. , Wawro, D. , Schwade, N. D. , Brouse, C. F. , Greilich, P. E. , et al., 2003, “ In Vitro Hemocompatibility Studies of Drug-Loaded Poly-(l-Lactic Acid) Fibers,” Biomaterials, 24(28), pp. 5191–5201. 10.1016/S0142-9612(03)00451-4 [DOI] [PubMed] [Google Scholar]
- [22]. Paul, R. , Marseille, O. , Hintze, E. , Huber, L. , Schima, H. , Reul, H. , and Rau, G. , 1998, “ In Vitro Thrombogenicity Testing of Artificial Organs,” J. Artif. Organs, 21(9), pp. 548–552. 10.1177/039139889802100910 [DOI] [PubMed] [Google Scholar]
- [23]. Blok, S. L. J. , Oeveren, W. , and Engels, G. E. , 2019, “ The Optimal Incubation Time for In Vitro Hemocompatibility Testing: Assessment Using Polymer Reference Materials Under Pulsatile Flow With Physiological Wall Shear Stress Conditions,” J. Biomed. Mater. Res., Part B, 107(7), pp. 2335–2342. 10.1002/jbm.b.34326 [DOI] [PMC free article] [PubMed] [Google Scholar]
- [24]. Olsen, A. L. , and Long, M. , 2018, “ Comparison of Catheter Thrombogenicity in a Modified Chandler Loop Model Using Goat Blood,” J. Biomed. Mater. Res. A, 106(12), pp. 3143–3151. 10.1002/jbm.a.36509 [DOI] [PubMed] [Google Scholar]
- [25]. Girdhar, G. , Andersen, A. , Pangerl, E. , Jahanbekam, R. , Ubl, S. , Nguyen, K. , Wainwright, J. , and Wolf, M. F. , 2018, “ Thrombogenicity Assessment of Pipeline Flex, Pipeline Shield, and FRED Flow Diverters in an In Vitro Human Blood Physiological Flow Loop Model,” J. Biomed. Mater. Res. A, 106(12), pp. 3195–3202. 10.1002/jbm.a.36514 [DOI] [PMC free article] [PubMed] [Google Scholar]
- [26]. Weaver, J. D. , and Ku, D. N. , 2012, “ Biomaterial Testing for Covered Stent Membranes: Evaluating Thrombosis and Restenosis Potential,” J. Biomed. Mater. Res. B, 100B(1), pp. 103–110. 10.1002/jbm.b.31927 [DOI] [PubMed] [Google Scholar]
- [27].ASTM F2888, 2019, Standard Practice for Platelet Leukocyte Count—An In Vitro Measure for Hemocompatibility Assessment of Cardiovascular Materials, ASTM International, West Conshohocken, PA. [Google Scholar]
- [28]. Ogawa, S. , Ohnishi, T. , Hosokawa, K. , Szlam, F. , Chen, E. P. , and Tanaka, K. A. , 2013, “ Haemodilution-Induced Changes in Coagulation and Effects of Haemostatic Components Under Flow Conditions,” Br. J. Anaesth., 111(6), pp. 1013–1023. 10.1093/bja/aet229 [DOI] [PubMed] [Google Scholar]
- [29]. Pretorius, E. , Oberholzer, H. M. , van der Spuy, W. J. , and Franz, R. C. , 2011, “ Comparing Techniques: The Use of Recalcified Plasma in Comparison With Citrated Plasma Alone and in Combination With Thrombin in Ultrastructural Studies,” Hematology, 16(6), pp. 337–340. 10.1179/102453311X13127324303515 [DOI] [PubMed] [Google Scholar]
- [30]. Pelagalli, A. , Belisario, M. A. , Tafuri, S. , Lombardi, P. , d'Angelo, D. , Avallone, L. , and Staiano, N. , 2003, “ Adhesive Properties of Platelets From Different Animal Species,” J. Comp. Pathol., 128(2–3), pp. 127–131. 10.1053/jcpa.2002.0615 [DOI] [PubMed] [Google Scholar]
- [31]. Goodman, S. L. , 1999, “ Sheep, Pig, and Human Platelet-Material Interactions With Model Cardiovascular Biomaterials,” J. Biomed. Mater. Res., 45(3), pp. 240–250. [DOI] [PubMed] [Google Scholar]
- [32]. Chan, C. H. H. , Pieper, I. L. , Robinson, C. R. , Friedmann, Y. , Kanamarlapudi, V. , and Thornton, C. A. , 2017, “ Shear Stress-Induced Total Blood Trauma in Multiple Species,” Artif. Organs, 41(10), pp. 934–947. 10.1111/aor.12932 [DOI] [PubMed] [Google Scholar]