Abstract
Abrupt aggregation of amyloid beta (Aβ) peptide is strongly associated with Alzheimer’s disease. In this study, we used atomic force microscopy−infrared (AFM-IR) spectroscopy to characterize the secondary structure of Aβ oligomers, protofibrils and fibrils formed at the early (4 h), middle (24 h), and late (72 h) stages of protein aggregation. This innovative spectroscopic approach allows for label-free nanoscale structural characterization of individual protein aggregates. Using AFM-IR, we found that at the early stage of protein aggregation, oligomers with parallel β-sheet dominated. However, these species exhibited slower rates of fibril formation compared to the oligomers with antiparallel β-sheet, which first appeared in the middle stage. These antiparallel β-sheet oligomers rapidly propagated into fibrils that were simultaneously observed together with parallel β-sheet fibrils at the late stage of protein aggregation. Our findings showed that aggregation of Aβ is a complex process that yields several distinctly different aggregates with dissimilar toxicities.
Keywords: amyloid β1–42, Alzheimer’s disease, oligomers, fibrils, atomic force microscopy, infrared spectroscopy
Graphical Abstract
INTRODUCTION
There are nearly 44 million people around the world who are diagnosed with Alzheimer’s disease (AD). It is one of the most common diseases in Western Europe and the sixth leading death cause in the U.S.1,2 A hallmark of AD is a progressive neurodegeneration of the frontal cortex. Histological analysis of AD brains revealed the presence of extracellular protein deposits together with intracellular neurofibrillary tangles.3–8 Electron microscopy showed that in these protein deposits, amyloid beta (Aβ) peptides are aggregated into long unbranched fibrils.9,10 In vitro studies confirmed that under physiological conditions both 40 and 42 amino acid long peptides (Aβ1–40 and Aβ1–42, respectively) could aggregate, forming highly toxic prefibrillar oligomers that later propagated into protofibrils and fibrils.1–8
Solid-state nuclear magnetic resonance (ss-NMR) and cryoelectron microscopy (cryo-EM) demonstrated that Aβ peptides could form several structurally different fibrils.11–13 This phenomenon is known as fibril polymorphism. However, to date, very little if anything is known about the structure of Aβ oligomers. These transient species exhibit high structural and morphological heterogeneity, which limits the use of ss-NMR and cryo-EM for their study. Barghorn et al. discovered that stable homogeneous Aβ 1–42 oligomers could be formed if the monomeric peptide was aggregated in low concentrations of sodium dodecyl sulfate (SDS).14 Similar findings were reported by Serra-Batiste et al. who observed growth of detergent-stabilized Aβ 42 oligomers in the presence of dodecyl phosphocholine (DPC) micelles.15 Although such aggregates exerted cell toxicities, their structural relevance to Aβ 42oligomers formed in the absence of detergents remains unclear.
There is a growing body of evidence that high structural complexity of Aβ aggregates can be probed by infrared (IR) spectroscopy.16–19 Time-resolved IR studies revealed that a short Aβ fragment (Aβ1–28) first adopted a β-strand, which yielded an increase in the intensity of the 1623.5 cm−1 band in the corresponding IR spectra.20 Several research groups found that antiparallel β-sheet was the major conformational contributor in oligomers.21,22 These conclusions could be made based on a 1695 cm−1band present in the IR spectra collected from Aβ oligomers. At the same time, IR spectra of mature fibrils exhibit vibrations around 1630 cm−1, which correspond to the parallel β-sheet secondary structure.16,17,19 It has been proposed that such antiparallel to parallel β-sheet rearrangement was possible due to repeated reorganization of β-strands.23,24 Recently, Vosough and Barth showed that a combination of IR and gel electrophoresis could be used to examine the size distribution of Aβ1–42 aggregates formed at early and late stages of protein aggregation.19 This analysis allowed for establishing a relationship between the IR spectrum and the size of the aggregates. The researchers also showed that the heterogeneity of the β-sheet structures varied with aggregation time.
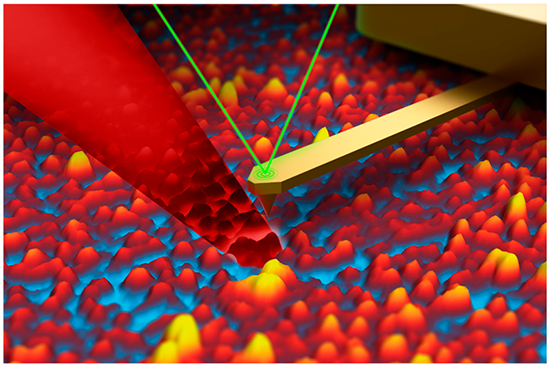
Atomic force microscopy−infrared (AFM-IR) spectroscopy offers nanoscale spatial resolution in the IR analysis of protein aggregates.25–27 In AFM-IR, a metalized scanning probe is positioned above the aggregate, which is illuminated by pulsed tunable IR light.28,29 IR-induced thermal expansions in the sample are recorded by the scanning probe. If a resonance frequency of the scanning probe matches the laser frequency, the resulting resonance effect enables single-monolayer and even single-molecule sensitivity.30,31 This high sensitivity and nanometer spatial resolution made AFM-IR highly attractive for structural analysis of amyloid fibrils,32–37 plant epicuticular waxes,38,39 polymers,40 bacteria,41,42 and liposomes.43
Using AFM-IR, our group was able to determine structural changes that took place upon aggregation of α-synuclein (α-Syn), a protein that is directly linked to Parkinson’s disease (PD).44 Zhou and Kurouski found that on early stages of aggregation, α-Syn formed two types of oligomers: one dominated by α-helical or unordered structure and the second mostly composed of antiparallel and parallel β-sheet.44 The first type of oligomer remained unchanged during the course of protein aggregation, whereas antiparallel β-sheet was rearranged into parallel-β-sheet secondary in the second type of oligomers upon their propagation into fibrils.44 Expanding upon these findings, we performed nanoscale AFM-IR analysis of Aβ1–42 oligomers, protofibrils and fibrils that are formed at early and late states of protein aggregation.
RESULTS AND DISCUSSION
Aβ1–42 rapidly aggregated (t1/2 = 31 h) after a short lag-phase (tlag = 12.5 h) reaching a plateau at 68 h, Figure 1 and Figure S1. Using AFM, we examined morphologies of Aβ1–42 aggregates present at the lag-phase (4 h), during exponential growth (24 h), and at the plateau (72 h and 168 h) of protein aggregation.
Figure 1.
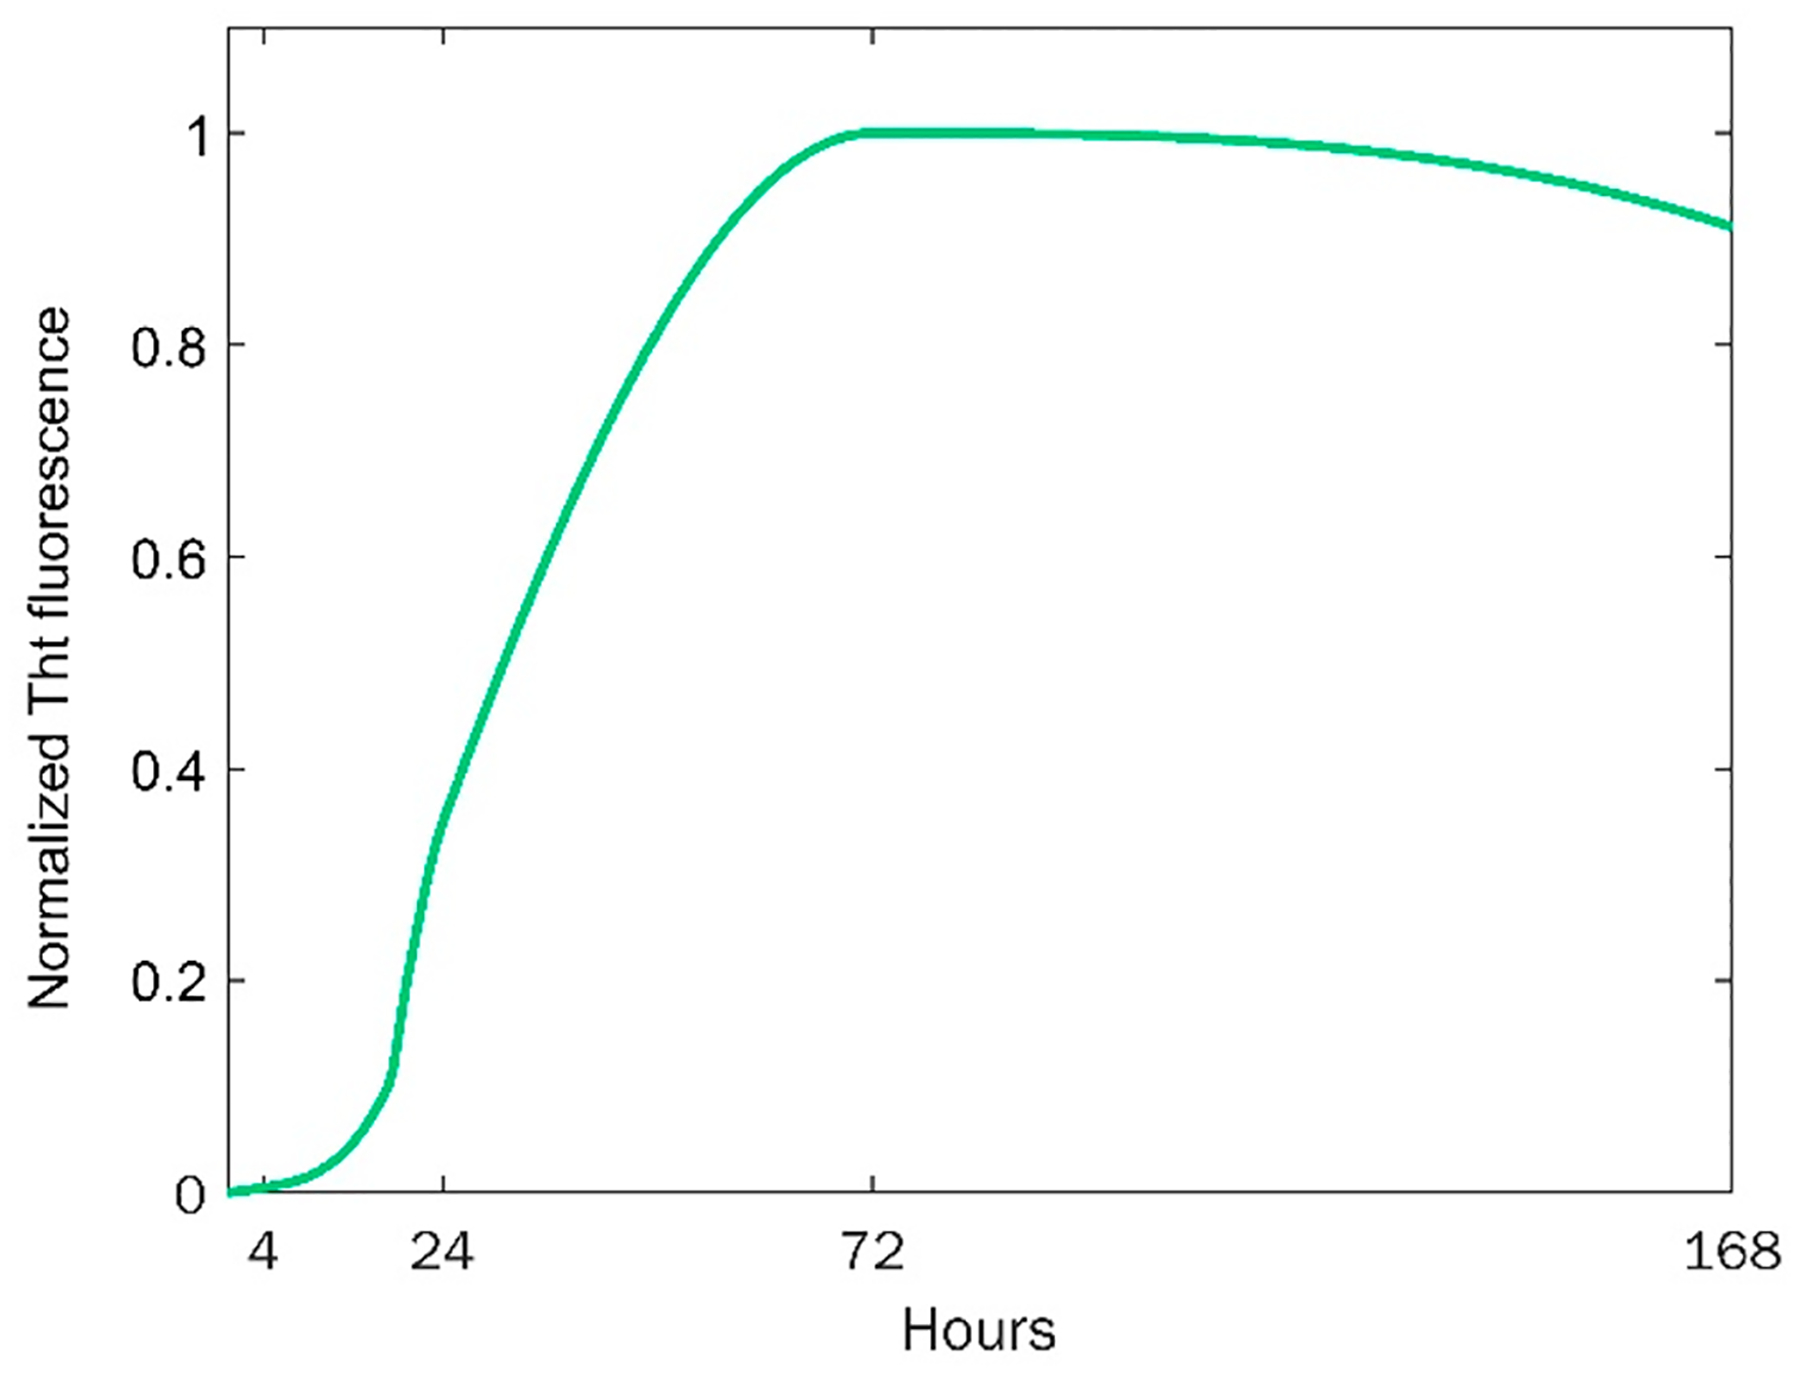
Kinetics of Aβ1–42 aggregation determined by ThT assay.
Oligomers observed at the lag-phase (4 h) had spherical appearance with heights ranging from 1 to 9 nm, Figure 2. The average size of oligomers detected at 24 h did not increase compared to the size of oligomers found at 4 h. However, we observed small protofibrils with heights ranging from 2 to 10 nm at this time point of protein aggregation. We also found that oligomers and protofibrils detected in the plateau phase (72 and 168 h) had similar height profiles as the aggregates observed at the early stages of protein aggregation. At 72 and 168 h, we observed substantially larger aggregates present in the analyzed specimens, which can be classified as fibrils. Their heights ranged from 6 to 10 nm and from 9 to 12 nm at 72 and 168 h, respectively.
Figure 2.
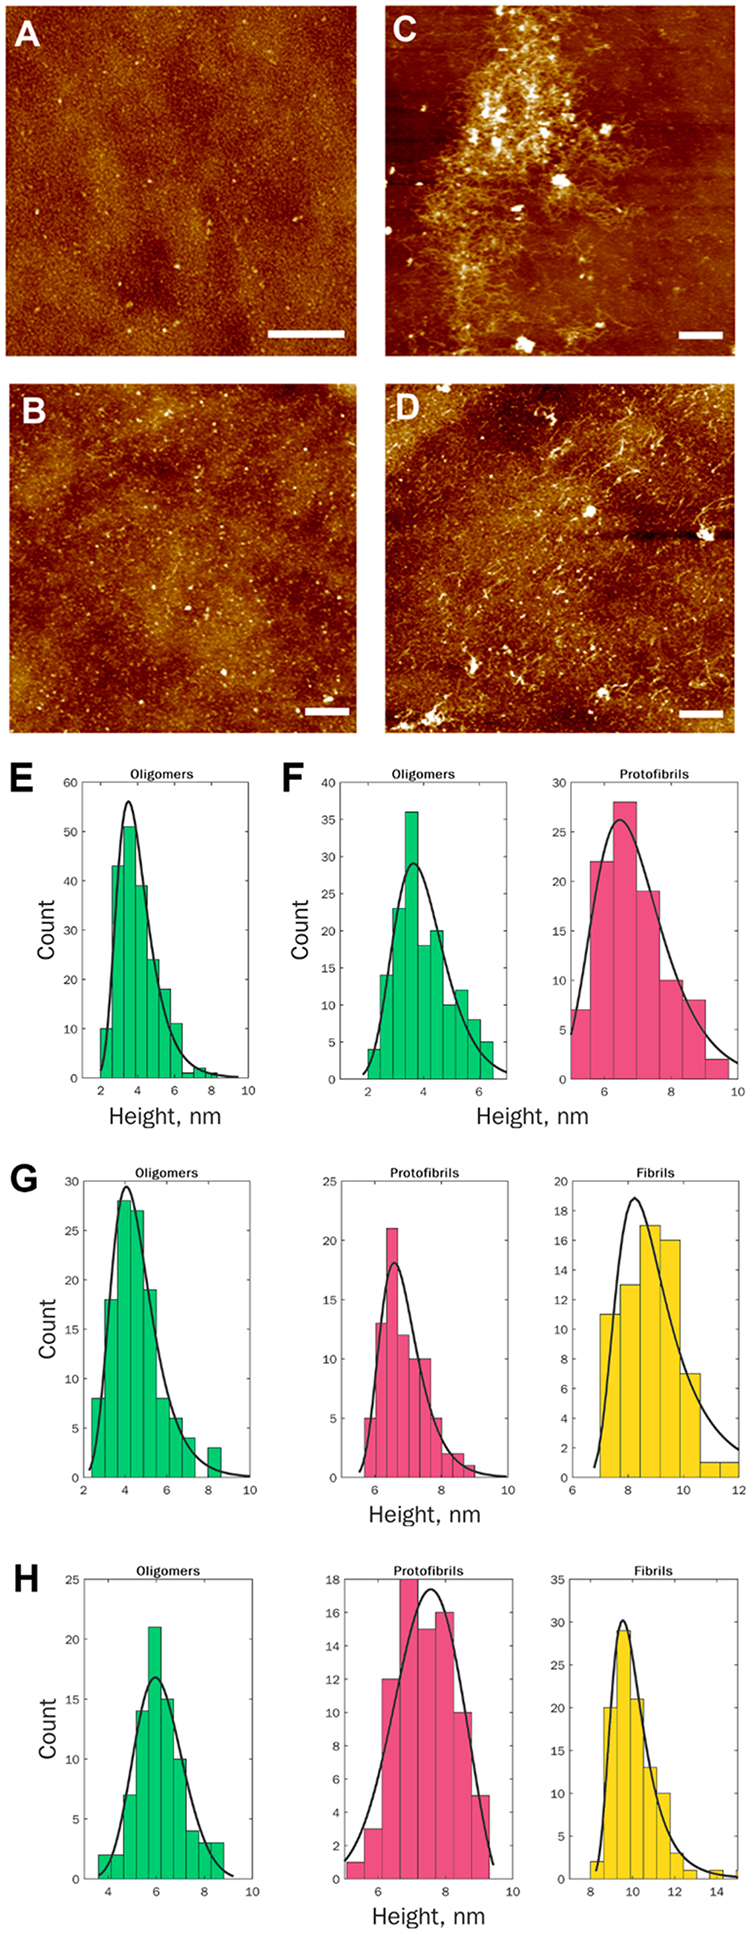
Morphological examination of Aβ1–42 aggregates observed at different states of protein aggregation. AFM images (A–D) and height profiles (E–H) of protein aggregates observed at 4 h (A and E), 24 h (B and F), 72 h (C and G) ,and 168 h (D and H) after the initiation of Aβ1–42 aggregation. Scale bars are 1 μm (A) and 2 μm (B–D).
We performed systematic AFM-IR analysis of Aβ1–42 aggregates observed at different stages of protein aggregation. For this, at least 60 individual aggregates were analyzed at 4, 24, 72 and 168 h, Figures 3 and 4. Aβ1–42 oligomers detected at 4 h exhibited very uniform AFM-IR spectra with an amide I centered around 1630 cm−1, which indicates the predominance of parallel β-sheet in their secondary structure. We also observed an intense vibrational band around 1667 cm−1 and a small shoulder at ~ 1694 cm−1.These spectroscopic signatures point to the presence of a substantial amount of unordered protein secondary structure and antiparallel β-sheet in these Aβ1–42 aggregates. Spectral fitting enabled quantitative assessment of the contributions of parallel and antiparallel β-sheets and unordered protein in the secondary structure of Aβ1–42 oligomers detected at 4 h. We found that 4 h Aβ1–42 oligomers possess 81% parallel β-sheet structures, whereas 11% and 8% of their secondary structure could be assigned to unordered and antiparallel β-sheet, respectively.
Figure 3.
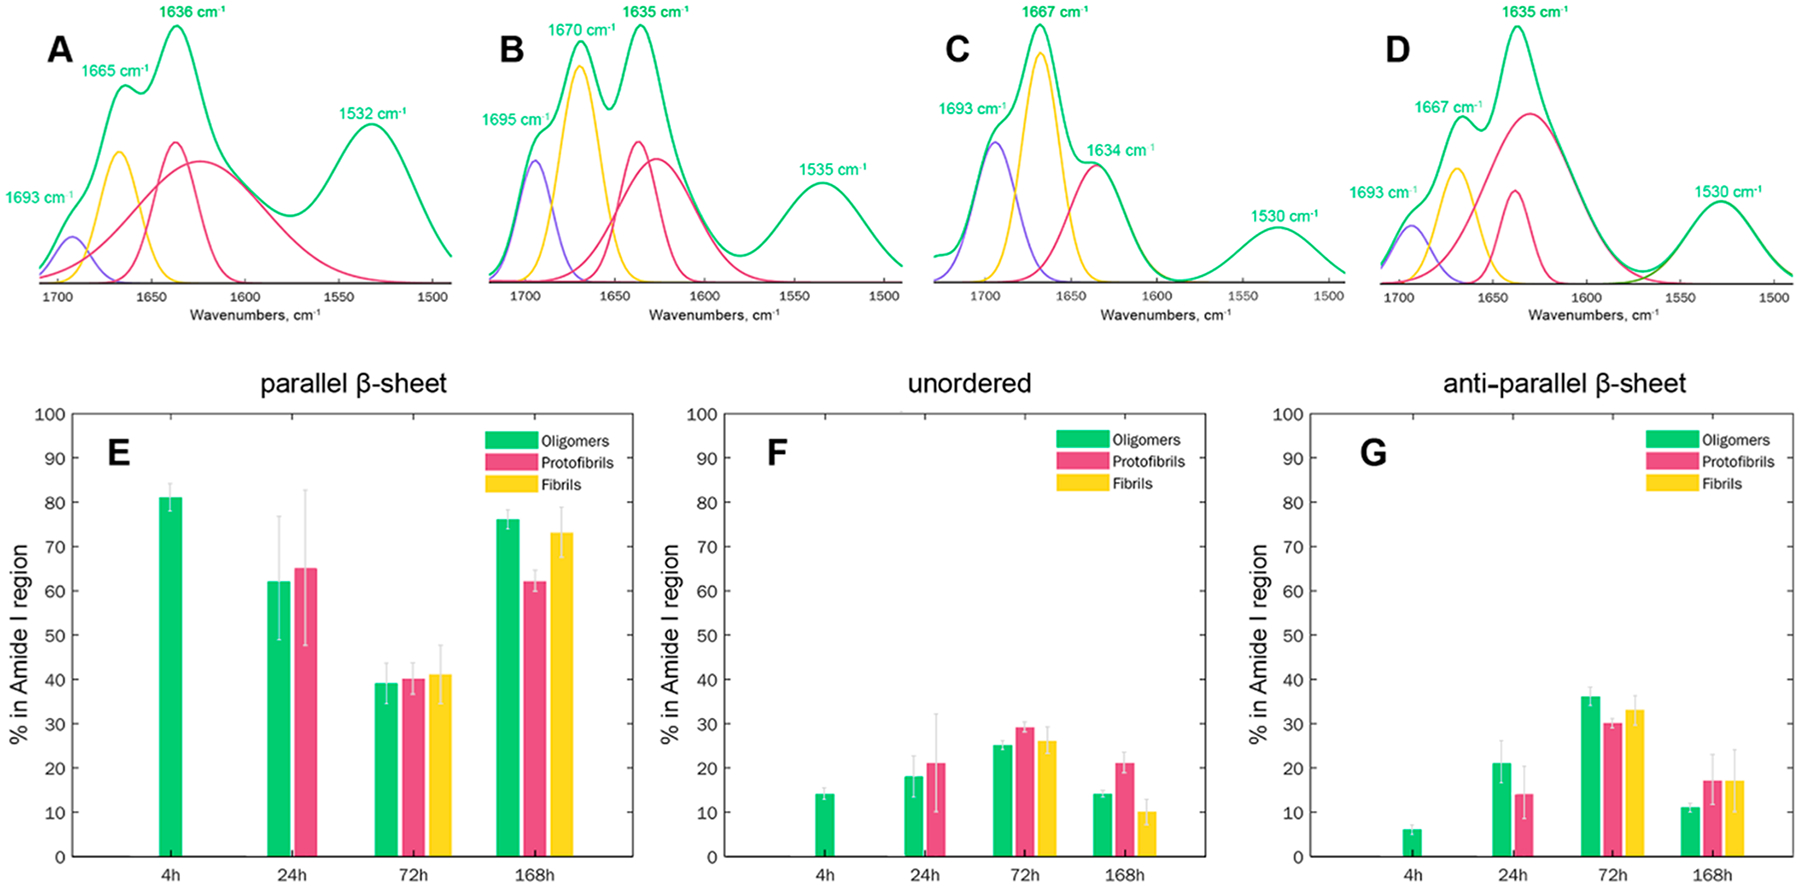
Structural analysis of Aβ1−42 aggregates formed at different states of protein aggregation. Averaged AFM-IR spectra (green) acquired from individual aggregates observed at 4 (A), 24 (B), 72 (C), and 168 h (D) after initiation of Aβ1–42 aggregation reveal the presence of antiparallel β-sheet (1693–1695 cm−1), unordered protein (1665–1670 cm−1), and parallel β-sheet (1634–1636 cm−1) in their structure. Spectral fitting of the amide I region (1693–1634 cm−1) enabled quantification of relative contributions of antiparallel β-sheet (purple), unordered protein (yellow), and parallel β-sheet (red and maroon) protein secondary structures in oligomers, protofibrils, and fibrils (E–G).
Figure 4.
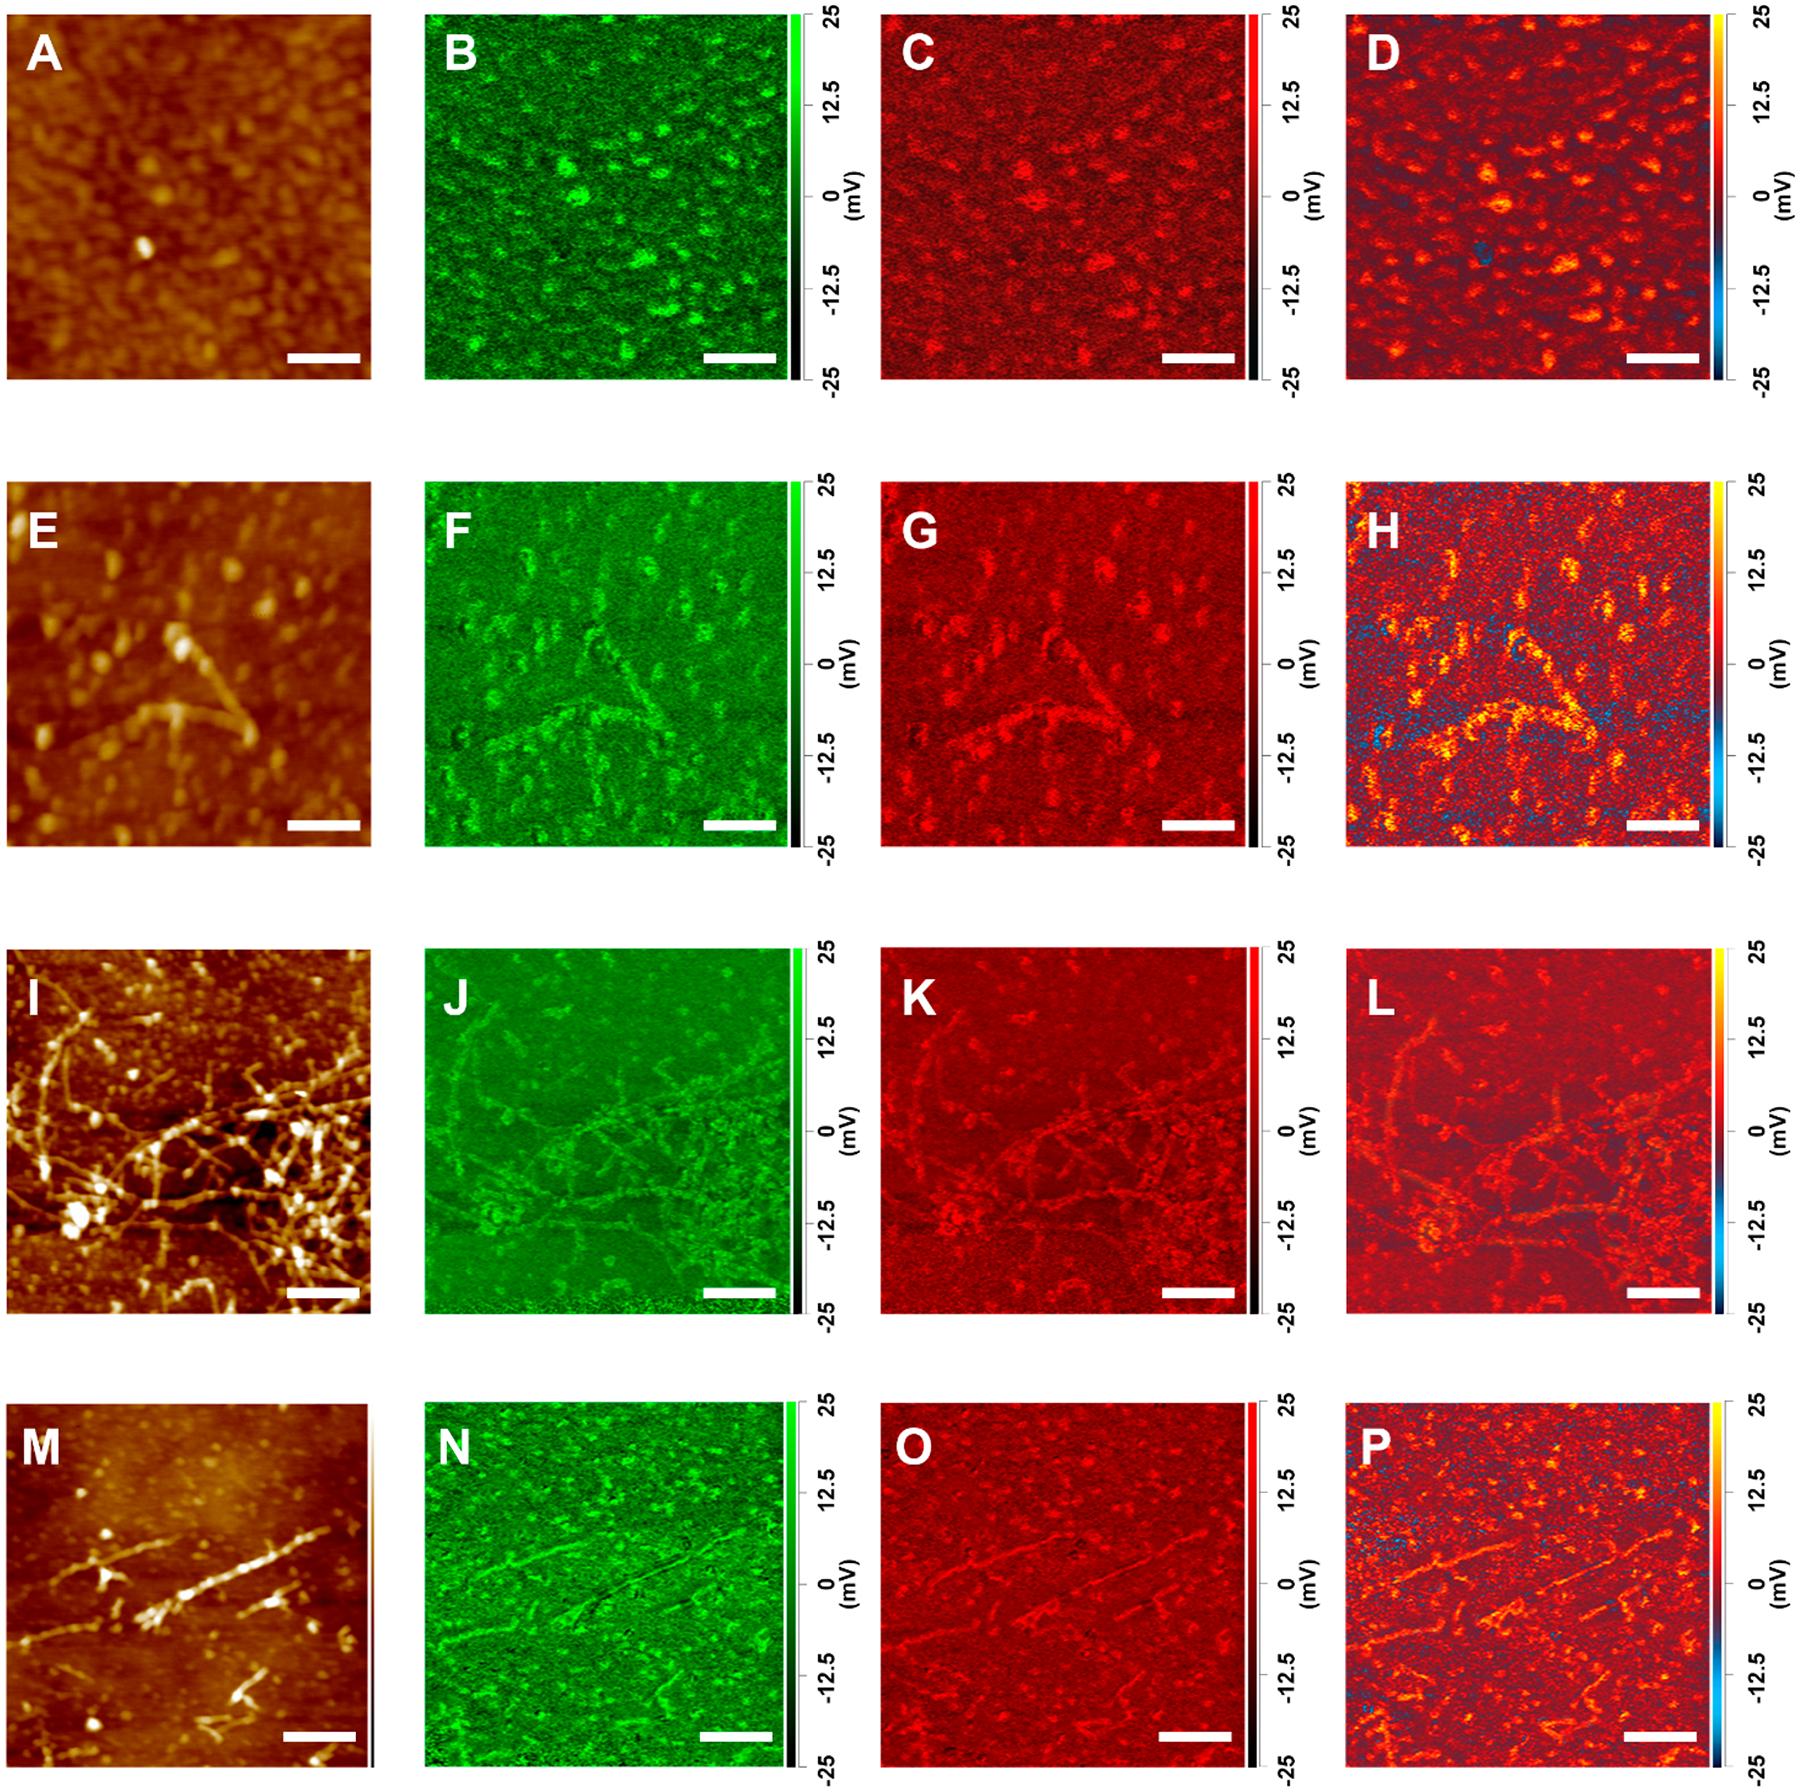
AFM-IR maps of Aβ1–42 aggregates observed at 4 (A–D), 24 (E–H), 72 (I–L), and 168 h (M–P) after initiation of protein aggregation. AFM height images (A, E, I, and M) and IR maps acquired at 1624 cm–1 (unordered) (C, G, K, O), and (parallel β-sheet) (B, F, J, N), 1655 cm–1 at 1694 cm (antiparallel β-sheet) (D, H, L, P). Scale bars are 100 nm (A–H) and 200 nm (I–P).
Oligomers detected at 24 h exhibited slightly lower content of parallel β-sheet (62%), than 4 h oligomers (81%), Figure 3 and Table S1. At the same time, these oligomers possessed significantly higher amounts of antiparallel β-sheet (20%) and unordered protein secondary structure (18%). We also found protofibrils with secondary structure similar to the these oligomer protein. All Aβ1–42 aggregates (oligomers, protofibrils and fibrils) observed at 72 h had very similar content of a parallel β-sheet (40%), as well as unordered protein (27%).Similar content of the antiparallel β-sheet was also observed in protofibrils (30%) and fibrils (34%), whereas oligomers detected at this time point exhibited a slightly larger amount of this secondary structure (36%). Oligomers observed at 168 h had secondary structure nearly identical to 4 h oligomers. At this time point, we also observed protofibrils that had 62% and 17% of parallel and antiparallel β-sheet, respectively, simultaneously possessing ~20% of unordered protein secondary structure. Fibrils present at 168 h had a similar amount of antiparallel β-sheet to protofibrils present at the same time point. These fibrils also exhibited higher content of parallel β-sheet and lower amount of unordered protein secondary structure compared to protofibrils present in the analyzed sample.
Next, we used principal component analysis (PCA) to determine the extent to which AFM-IR spectra collected at the same time point of Aβ1–42 aggregation are similar, Figure S2–S9, Table S1. PCA showed that spectra collected from oligomers formed at 4 h can be split into three groups. These groups had similar content of parallel and antiparallel β-sheet and unordered protein secondary structure, Figure 5. However, 24 h oligomers exhibited drastically different contents of parallel and antiparallel β-sheet. We found that group 2 had the highest, group 1 medium, and group 3 the lowest amount of parallel β-sheet. These group had low, medium and high amounts, respectively, of antiparallel β-sheet. We also found two distinctly different protofibril polymorphs at 24 h with high and low content of parallel β-sheet. While the first group of protofibrils had very low amounts of unordered and antiparallel β-sheet, protofibrils of the second group had nearly 2 times higher amounts of these protein secondary structures.
Figure 5.

Histograms of distribution of parallel β-sheet (1625–1636 cm−1), unordered protein (1655–1667 cm–1), and antiparallel β-sheet (1694 cm−1) in different groups of oligomers, protofibrils and fibrils. Groups were determined by PCA analysis of the acquired spectra (Figures S2–S10).
We also found that oligomers and protofibrils present at 72 h could be classified into 3 groups based on the variability in the amount of parallel and antiparallel β-sheet secondary structures, Figure 5. However, these aggregates had very similar if not identical amounts of unordered protein in their secondary structure. We also found two groups of fibrils at both 72 and 168 h that had distinctly different amounts of parallel and antiparallel β-sheet and unordered protein. Similar differences were found for two groups of protofibrils present at 168 h.
These findings suggest that at early states of Aβ1–42 aggregation (4 h), oligomers with parallel β-sheet are formed first, Figure 6A. Some of these oligomers propagate into group 1 protofibrils observed at 24h, which later forms fibrils (72 h). At the same time, at 24 h, a new class of oligomers with substantially higher amount of antiparallel β-sheet is formed. It should be noted that these antiparallel β-sheet-rich oligomers are a minor population of all observed oligomers present at this time point. Nanoscale structural analysis of individual oligomers present at 24 h confirmed this hypothesis, Figure 3. Specifically, we found that some of these oligomers had predominantly parallel β-sheet (Figure 6B), whereas others predominantly possessed antiparallel β-sheet. Simultaneous presence of antiparallel β-sheet-rich oligomers and protofibrils at the same time point (24 h) suggests that structures with antiparallel β-sheet have high growth rates (Figure 6D).Although the aggregates with parallel β-sheet have apparently slower growth rates compared to the antiparallel β-sheet-rich aggregates, both parallel and antiparallel β-sheet-rich aggregates have similar abundance at 72 h, Figure 6A.
Figure 6.
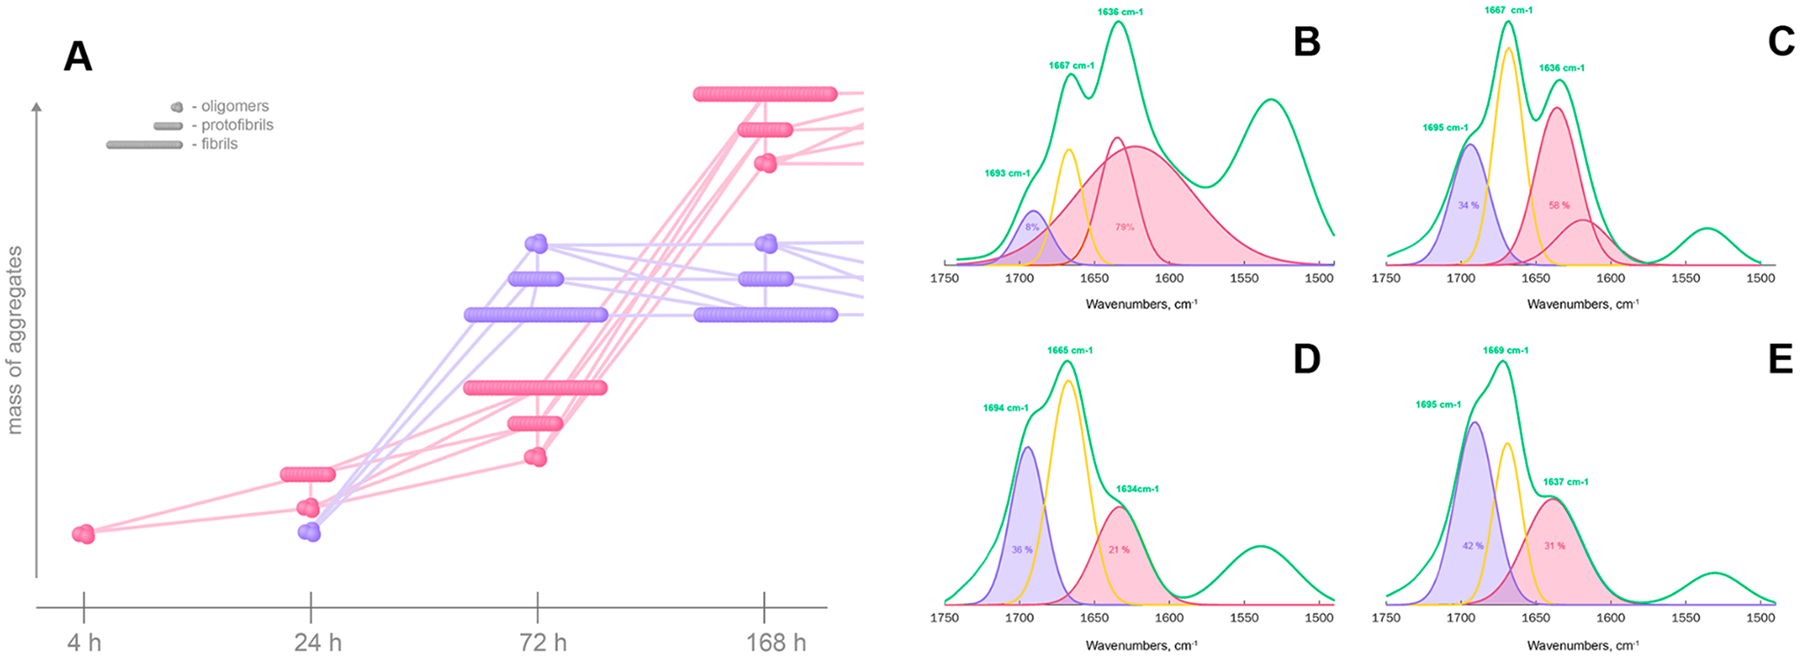
Scheme of formation and development of aggregates with parallel (pink) and antiparallel (purple) β-sheet at different stages of protein aggregation. AFM-IR spectra collected from individual oligomers (B and D) at 24 h and fibrils (C and E) at 168 h after the initiation of protein aggregation. At 24 h, oligomers with predominantly parallel β-sheet (B) and antiparallel β-sheet (D) are observed that later propagate into fibrils with predominantly parallel β-sheet (C) and antiparallel β-sheet (E) secondary structures.
The dominance of oligomers, protofibrils, and fibrils with parallel β-sheet at 168 h can have two possible explanations.According to the first one, aggregates with antiparallel β-sheet convert to parallel β-sheet as time progresses. Alternatively, more protofibrils and fibrils with parallel β-sheet could be formed at later stages of protein aggregation, Figure 6B. It should be noted that AFM-IR analysis of individual fibrils present at 168 h revealed that some of these aggregates possessed high amount of parallel β-sheet (Figure 6C), whereas others were dominated by antiparallel β-sheet (Figure 6E). These results suggest that the above discussed oligomers and fibrils with both parallel and antiparallel β-sheet can be far away from their free energy minima, which allows for the observed structural and morphological transformations in this study.
The question to ask is why oligomers with similar amide I profiles could be detected at all stages of Aβ1–42 aggregation.This observation could be explained by a continuous process of oligomer formation from Aβ1–42 monomers during the course of protein aggregation. Alternatively, these structurally similar Aβ1–42 oligomers could be present at different time points because once formed at 4 h, these oligomers propagated into neither protofibrils nor fibrils. More detailed structural characterization of these species is required to disentangle these two possibilities. It should be noted that the Hemmingsen group recently reported the coexistence of parallel and antiparallel β-sheet structures upon Aβ1–40 aggregation.45 Similar experimental evidence was reported by the D’Arrigo group.46 Furthermore, Herzberg and co-workers proposed an autocatalytic conversion of antiparallel to parallel β-sheet species,45 which is in a good agreement with the results previously reported by Zhou and Kurouski for α-Syn aggregates.44
One may question whether such a detailed examination of different populations of Aβ1–42 aggregates could be achieved using conventional IR and CD spectroscopies. These analytical approaches probe bulk volume of the sample. At the early stages of protein aggregation, protein monomers dominate in solution. Consequently, utilization of CD and conventional IR prevents direct detection and structural characterization of protein oligomers present at these time points. Furthermore, CD does not provide required sensitivity to differentiate between parallel and antiparallel β-sheet secondary structure.Our own results show that CD can reveal only major transitions between unordered (4 h) and β-sheet (24–168h) conformations of Aβ1–42, Figure S10. Conventional IR analysis, although it could be used to track changes in parallel β-sheet, does not allow for visualization of low quantities of protein aggregates with antiparallel β-sheet present at early stages of Aβ1–42 aggregation, Figure S11.
There is an ongoing discussion whether Aβ1–42 aggregates with parallel or antiparallel β-sheet exert higher cell toxicities.47,48 Also, it remains unclear whether Aβ oligomers or fibrils are more toxic to cells.48–50 To end this, we compared toxicities of Aβ1–42 oligomers and aggregates grown at 72 and 168 h. At 168 h, Aβ1–42 aggregates primarily possessed parallel β-sheet secondary structure, whereas a mixture of aggregates with parallel and antiparallel β-sheet was present at 72 h. LDH test showed that 168 h Aβ1–42 aggregates exerted the highest cell toxicity, whereas toxicity of 72 h aggregates was nearly 2 times lower, Figure 7. Finally, Aβ1–42 oligomers (4 h) showed the lowest cell toxicity.Importantly, monomeric Aβ1–42 exerted no cell toxicity. These findings are in a good agreement with previously reported studies by Vendruscolo and Baskakov groups, which showed that oligomers have insignificant cell toxicity or exert substantially lower toxicity than fibrils.49,51
Figure 7.
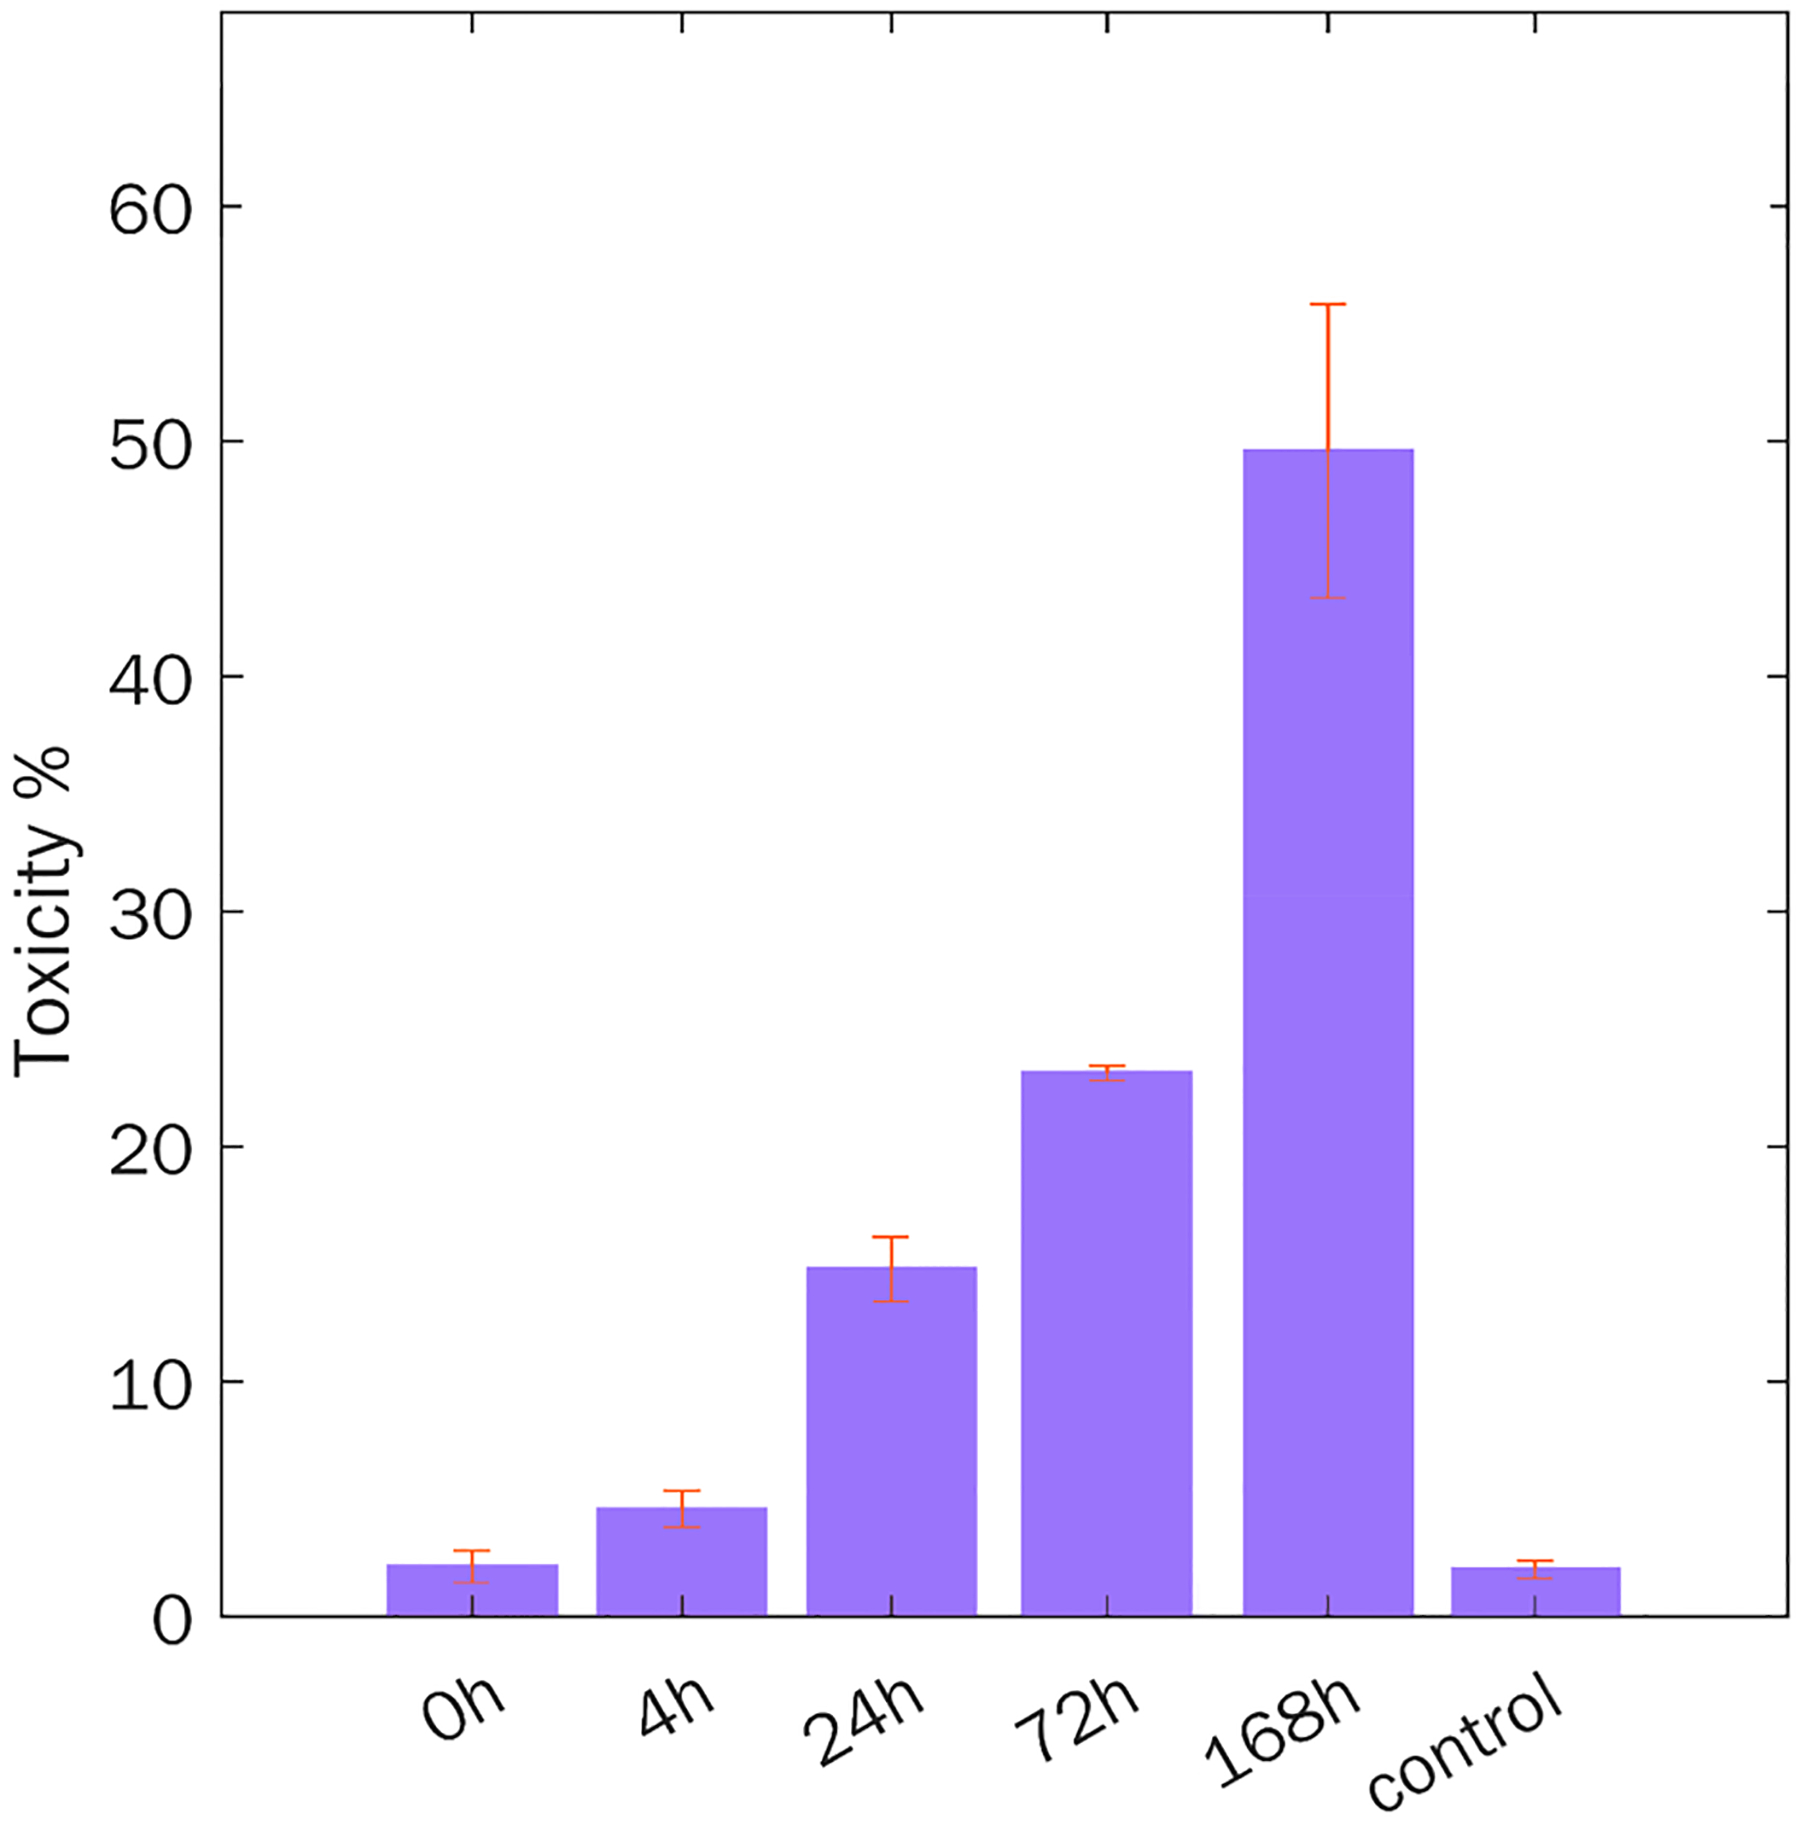
Toxicity of Aβ1–42 oligomers (4 h), a mixture of aggregates with parallel and antiparallel (72 h), and parallel β-sheet (168 h) secondary structures, as well as Aβ1–42 monomers. Error bars represent standard errors of the mean (SEM) of three replicates. According to the ANOVA and Bonferroni corrected post hoc t test, difference in the LDH levels between all classes was significant except for 0 h (monomers) and 4 h (oligomers), control, 0 h and 4 h (Table S2).
CONCLUSION
Nanoscale IR analysis of Aβ1–42 aggregates formed at different stages of aggregation revealed substantial complexity of these protein species. We found that Aβ first formed oligomers with parallel β-sheet structure that had much slower rates of fibril formation. Right after their appearance, we detected oligomers with antiparallel β-sheet that rapidly propagated into protofilaments and fibrils. At 72 h after initiation of Aβ aggregation, we observed nearly equal amounts of aggregates with parallel and antiparallel β-sheet secondary structures. We also found that aggregates with antiparallel β-sheet remained as a subpopulation, whereas at the late stages, aggregates with parallel β-sheet dominated. Finally, we found that such parallel β-sheet aggregates exert higher cell toxicities than protofibrils and fibrils with antiparallel β-sheet. These findings show that aggregation dynamics of Aβ is a complex process that yields several distinctly different aggregates with dissimilar toxicities.
MATERIALS AND METHODS
Protein Aggregation.
Recombinant human Aβ1–42 (1 mg; Genscript cat. no. RP10017) was dissolved in 1 mL of hexafluoroisopropanol (HFIP; Acros Organics, code 445820500); after all peptide was fully dissolved, HFIP was evaporated under N2.The resulting protein film was dissolved in 6 M guanidine chloride at 4 °C. Next, 6 M guanidine chloride was replaced with 20 mM PB, pH 7.4, using a PD-10 desalting column (Cytiva, cat. No 17085101) at 4 °C to suppress peptide aggregation. The final sample contained 240 μM Aβ1–42; the samples were incubated at 25 °C under quiescent conditions.
Kinetic Measurements.
Aβ1–42 aggregation was monitored using thioflavin T (ThT) fluorescence assay. Protein solution was mixed with ThT right before measurements to reach final concentration of ThT equal to 25 μM. Measurement was performed in quartz cuvettes with 3 mm path length using a home-build spectrofluorimeter; excitation was 450 nm, and emission signal was collected at 495 nm. Measurements were performed every 2 h.
AFM Imaging.
AFM imaging was performed using silicon AFM probes (purchased from Appnano, Mountain View, CA) with related parameters of force constant = 2.7 N/m and resonance frequency = 50–80 kHz on an AIST-NT-HORIBA system (Edison, NJ). Analysis of collected images was performed using AIST-NT software (Edison, NJ).
AFM-IR.
AFM-IR imaging was conducted using a Nano-IR3 system (Bruker Nano, Santa Barbara, CA, USA). The IR source was a QCL laser. Contact-mode AFM tips (ContGB-G AFM probe, NanoAndMore) were used to obtain all spectra and maps. Spectral differences between AFM-IR signals acquired from individual oligomers and the sample background are shown in Figure S12. Treatment and analysis of collected spectra was performed in Matlab. All raw spectra were treated by 10 points smoothing filter in Analysis Studio v3.15 and normalized by average area.
Spectral fitting was performed in GRAMS/AI 7.0 (Thermo Galactic, Salem, NH). The amide I region (1600–1700 cm−1) was fitted with 3 or 4 peaks centered at 1616 and 1636 cm−1 (parallel β-sheet), 1665 cm−1 (unordered protein), and 1693 cm−1 (antiparallel β-sheet). Peak area for each secondary structure was normalized relative to the total peak area of the amide I region. Corresponding percentages of the amide I band region for each secondary structure were reported in Figures 3 and 5. Standard deviations of the peak areas of each of the secondary structure are shown by the error bars in Figure 3.
Circular Dichroism (CD).
CD spectra were collected from 100 μM solution of Aβ1–42 in 20 mM phosphate buffer, pH 7.4, at 25 °C on a J-1000 CD spectrometer (Jasco, Easton, MD, USA). Three spectra were collected for each sample within 205–250 nm.
Attenuated Total Reflectance Fourier-Transform Infrared (ATR-FTIR) Spectroscopy.
Sample aliquots were placed onto an ATR crystal and dried at room temperature. Spectra were measured using a Spectrum 100 FTIR spectrometer (PerkinElmer, Waltham, MA, USA). Three spectra were collected from each sample.
Cell Toxicity Assays.
Mouse midbrain N27 cells were grown in RPMI 1640 medium (Thermo Fisher Scientific, Waltham, MA, USA) with 10% fetal bovine serum (FBS) (Invitrogen, Waltham, MA, USA) in a 96 well plate (5000 cells per well) at 37 °C under 5% CO2. After 24 h, the cells were found to fully adhere to the wells reaching ~70% confluency. Next, 100 μL of the cell culture medium was replaced with 100 μL of RPMI 1640 medium with 5% FBS containing protein samples. After 48 h of incubation, lactate dehydrogenase (LDH) assay was performed on the cell medium using CytoTox 96 nonradioactive cytotoxicity assay (G1781, Promega, Madison, WI, USA). Absorption measurements were made in a plate reader (Tecan, Männedorf, Switzerland) at 490 nm. Every well was measured 25 times in different locations. All measurements were made in triplicate. A t test was used to determine the significance level of differences between toxicity of analyzed samples. We also used ANOVA and Bonferroni corrected post hoc t test to analyze results of the LDH toxicity assay.
Supplementary Material
ACKNOWLEDGMENTS
We are grateful to the National Institutes of Health for the provided financial support (R35GM142869).
Footnotes
Supporting Information
The Supporting Information is available free of charge at https://pubs.acs.org/doi/10.1021/acschemneuro.2c00180.
Fitted kinetic curve of thioflavin T fluorescence using modified version of the Avrami equation, PCA of spectra of Aβ1–42 aggregates collected at different time points after initiation of protein aggregation and fitted average IR-spectra acquired from Aβ1–42 aggregates with the corresponding second derivatives of amide I and amide II regions, CD spectra of Aβ1–42 aggregates collected at different time points of protein aggregation, content of unordered (1667 cm−1), and parallel β-sheet (1625–1636 cm−1) from FTIR-spectra and fitted FTIR spectrum of Aβ1–42 aggregates at 0, 4, 24, 72, and 168 h time points, with corresponded structures, AFM maps of single oligomers, protofibrils and fibrils of Aβ1–42 formed at different time points of protein aggregation and spectra of these protein aggregates together with the corresponding background spectra, contents of conformations in percentage of amide I area in selected by PCA groups of aggregates, and ANOVA and Bonferroni corrected post hoc t test results for LDH toxicity assay used to analyze toxicity of Aβ1–42 aggregates formed at different stages of protein aggregation (PDF)
Notes
The authors declare no competing financial interest.
Contributor Information
Kiryl Zhaliazka, Department of Biochemistry and Biophysics, Texas A&M University, College Station, Texas 77843, United States.
Dmitry Kurouski, Department of Biochemistry and Biophysics, Texas A&M University, College Station, Texas 77843, United States; Department of Biomedical Engineering, Texas A&M University, College Station, Texas 77843, United States;.
REFERENCES
- (1).Chiti F; Dobson CM Protein Misfolding, Amyloid Formation, and Human Disease: A Summary of Progress over the Last Decade. Annu. Rev. Biochem 2017, 86, 27–68. [DOI] [PubMed] [Google Scholar]
- (2).Iadanza MG; Jackson MP; Hewitt EW; Ranson NA; Radford SE A New Era for Understanding Amyloid Structures and Disease. Nat. Rev. Mol. Cell Biol 2018, 19, 755–773. [DOI] [PMC free article] [PubMed] [Google Scholar]
- (3).Pieri L; Madiona K; Melki R Structural and Functional Properties of Prefibrillar A-Synuclein Oligomers. Sci. Rep 2016, 6, 24526. [DOI] [PMC free article] [PubMed] [Google Scholar]
- (4).Chen SW; et al. Structural Characterization of Toxic Oligomers That Are Kinetically Trapped During Alpha-Synuclein Fibril Formation. Proc. Natl. Acad. Sci. U. S. A 2015, 112, E1994–2003. [DOI] [PMC free article] [PubMed] [Google Scholar]
- (5).Cremades N; et al. Direct Observation of the Interconversion of Normal and Toxic Forms of Alpha-Synuclein. Cell 2012, 149, 1048–59. [DOI] [PMC free article] [PubMed] [Google Scholar]
- (6).Apetri MM; Maiti NC; Zagorski MG; Carey PR; Anderson VE Secondary Structure of Alpha-Synuclein Oligomers: Characterization by Raman and Atomic Force Microscopy. J. Mol. Biol 2006, 355, 63–71. [DOI] [PubMed] [Google Scholar]
- (7).Kurouski D; Van Duyne RP; Lednev IK Exploring the Structure and Formation Mechanism of Amyloid Fibrils by Raman Spectroscopy: A Review. Analyst 2015, 140, 4967–80. [DOI] [PubMed] [Google Scholar]
- (8).Hong DP; Han S; Fink AL; Uversky VN Characterization of the Non-Fibrillar Alpha-Synuclein Oligomers. Prot. Pept. Lett 2011, 18, 230–40. [DOI] [PubMed] [Google Scholar]
- (9).Wischik CM; Crowther RA; Stewart M; Roth M Subunit Structure of Paired Helical Filaments in Alzheimer’s Disease. J. Cell. Biol 1985, 100, 1905–12. [DOI] [PMC free article] [PubMed] [Google Scholar]
- (10).Wischik CM; Novak M; Thogersen HC; Edwards PC; Runswick MJ; Jakes R; Walker JE; Milstein C; Roth M; Klug A Isolation of a Fragment of Tau Derived from the Core of the Paired Helical Filament of Alzheimer Disease. Proc. Natl. Acad. Sci. U. S. A 1988, 85, 4506–10. [DOI] [PMC free article] [PubMed] [Google Scholar]
- (11).Li B; et al. Cryo-Em of Full-Length Alpha-Synuclein Reveals Fibril Polymorphs with a Common Structural Kernel. Nat. Commun 2018, 9, 3609. [DOI] [PMC free article] [PubMed] [Google Scholar]
- (12).Guerrero-Ferreira R; Taylor NM; Mona D; Ringler P; Lauer ME; Riek R; Britschgi M; Stahlberg H Cryo-Em Structure of Alpha-Synuclein Fibrils. Elife 2018, 7, e36402. [DOI] [PMC free article] [PubMed] [Google Scholar]
- (13).Tycko R Solid-State Nmr Studies of Amyloid Fibril Structure. Annu. Rev. Phys. Chem 2011, 62, 279–99. [DOI] [PMC free article] [PubMed] [Google Scholar]
- (14).Barghorn S; et al. Globular Amyloid Beta-Peptide Oligomer - a Homogenous and Stable Neuropathological Protein in Alzheimer’s Disease. J. Neurochem 2005, 95, 834–47. [DOI] [PubMed] [Google Scholar]
- (15).Serra-Batiste M; Ninot-Pedrosa M; Bayoumi M; Gairi M; Maglia G; Carulla N Abeta42 Assembles into Specific Beta-Barrel Pore-Forming Oligomers in Membrane-Mimicking Environments. Proc. Natl. Acad. Sci. U. S. A 2016, 113, 10866–71. [DOI] [PMC free article] [PubMed] [Google Scholar]
- (16).Lomont JP; Rich KL; Maj M; Ho JJ; Ostrander JS; Zanni MT Spectroscopic Signature for Stable Beta-Amyloid Fibrils Versus Beta-Sheet-Rich Oligomers. J. Phys. Chem. B 2018, 122, 144–153. [DOI] [PMC free article] [PubMed] [Google Scholar]
- (17).Sarroukh R; Goormaghtigh E; Ruysschaert JM; Raussens V Atr-Ftir: A ″Rejuvenated″ Tool to Investigate Amyloid Proteins. Biochim. Biophys. Acta 2013, 1828, 2328–38. [DOI] [PubMed] [Google Scholar]
- (18).Dou T; Zhou L; Kurouski D Unravelling the Structural Organization of Individual Alpha-Synuclein Oligomers Grown in the Presence of Phospholipids. J. Phys. Chem. Lett 2021, 12, 4407–4414. [DOI] [PubMed] [Google Scholar]
- (19).Vosough F; Barth A Characterization of Homogeneous and Heterogeneous Amyloid-Beta42 Oligomer Preparations with Biochemical Methods and Infrared Spectroscopy Reveals a Correlation between Infrared Spectrum and Oligomer Size. ACS Chem. Neurosci 2021, 12, 473–488. [DOI] [PMC free article] [PubMed] [Google Scholar]
- (20).Peralvarez-Marin A; Barth A; Graslund A Time-Resolved Infrared Spectroscopy of Ph-Induced Aggregation of the Alzheimer Abeta(1−28) Peptide. J. Mol. Biol 2008, 379, 589–96. [DOI] [PubMed] [Google Scholar]
- (21).Cerf E; Sarroukh R; Tamamizu-Kato S; Breydo L; Derclaye S; Dufrene YF; Narayanaswami V; Goormaghtigh E; Ruysschaert JM; Raussens V Antiparallel Beta-Sheet: A Signature Structure of the Oligomeric Amyloid Beta-Peptide. Biochem. J 2009, 421, 415–23. [DOI] [PubMed] [Google Scholar]
- (22).Sandberg A; et al. Stabilization of Neurotoxic Alzheimer Amyloid-Beta Oligomers by Protein Engineering. Proc. Natl. Acad. Sci. U. S. A 2010, 107, 15595–600. [DOI] [PMC free article] [PubMed] [Google Scholar]
- (23).Petty SA; Decatur SM Experimental Evidence for the Reorganization of Beta-Strands within Aggregates of the Abeta(16–22) Peptide. J. Am. Chem. Soc 2005, 127, 13488–9. [DOI] [PubMed] [Google Scholar]
- (24).Petty SA; Decatur SM Intersheet Rearrangement of Polypeptides During Nucleation of {Beta}-Sheet Aggregates. Proc. Natl. Acad. Sci. U. S. A 2005, 102, 14272–7. [DOI] [PMC free article] [PubMed] [Google Scholar]
- (25).Dazzi A; Glotin F; Carminati R Theory of Infrared Nanospectroscopy by Photothermal Induced Resonance. J. Appl. Phys 2010, 107, 124519. [Google Scholar]
- (26).Dazzi A; Prater CB Afm-Ir: Technology and Applications in Nanoscale Infrared Spectroscopy and Chemical Imaging. Chem. Rev 2017, 117, 5146–5173. [DOI] [PubMed] [Google Scholar]
- (27).Kurouski D; Dazzi A; Zenobi R; Centrone A Infrared and Raman Chemical Imaging and Spectroscopy at the Nanoscale. Chem. Soc. Rev 2020, 49, 3315–3347. [DOI] [PMC free article] [PubMed] [Google Scholar]
- (28).Katzenmeyer AM; Aksyuk V; Centrone A Nanoscale Infrared Spectroscopy: Improving the Spectral Range of the Photothermal Induced Resonance Technique. Anal. Chem 2013, 85, 1972–1979. [DOI] [PubMed] [Google Scholar]
- (29).Katzenmeyer AM; Holland G; Kjoller K; Centrone A Absorption Spectroscopy and Imaging from the Visible through Mid-Infrared with 20 Nm Resolution. Anal. Chem 2015, 87, 3154–3159. [DOI] [PubMed] [Google Scholar]
- (30).Ruggeri FS; Mannini B; Schmid R; Vendruscolo M; Knowles TPJ Single Molecule Secondary Structure Determination of Proteins through Infrared Absorption Nanospectroscopy. Nat. Commun 2020, 11, 2945. [DOI] [PMC free article] [PubMed] [Google Scholar]
- (31).Lu F; Jin MZ; Belkin MA Tip-Enhanced Infrared Nanospectroscopy Via Molecular Expansion Force Detection. Nat. Photonics 2014, 8, 307–312. [Google Scholar]
- (32).Ruggeri FS; Benedetti F; Knowles TPJ; Lashuel HA; Sekatskii S; Dietler G Identification and Nanomechanical Characterization of the Fundamental Single-Strand Protofilaments of Amyloid Alpha-Synuclein Fibrils. Proc. Natl. Acad. Sci. U. S. A 2018, 115, 7230–7235. [DOI] [PMC free article] [PubMed] [Google Scholar]
- (33).Ruggeri FS; Flagmeier P; Kumita JR; Meisl G; Chirgadze DY; Bongiovanni MN; Knowles TPJ; Dobson CM The Influence of Pathogenic Mutations in Alpha-Synuclein on Biophysical and Structural Characteristics of Amyloid Fibrils. ACS Nano 2020, 14, 5213–5222. [DOI] [PubMed] [Google Scholar]
- (34).Ruggeri FS; Longo G; Faggiano S; Lipiec E; Pastore A; Dietler G Infrared Nanospectroscopy Characterization of Oligomeric and Fibrillar Aggregates During Amyloid Formation. Nat. Commun 2015, 6, 7831. [DOI] [PMC free article] [PubMed] [Google Scholar]
- (35).Ruggeri FS; Vieweg S; Cendrowska U; Longo G; Chiki A; Lashuel HA; Dietler G Nanoscale Studies Link Amyloid Maturity with Polyglutamine Diseases Onset. Sci. Rep 2016, 6, 31155. [DOI] [PMC free article] [PubMed] [Google Scholar]
- (36).Rizevsky S; Kurouski D Nanoscale Structural Organization of Insulin Fibril Polymorphs Revealed by Atomic Force Microscopy-Infrared Spectroscopy (Afm-Ir). Chembiochem 2020, 21, 481–485. [DOI] [PubMed] [Google Scholar]
- (37).Ramer G; Ruggeri FS; Levin A; Knowles TPJ; Centrone A Determination of Polypeptide Conformation with Nanoscale Resolution in Water. ACS Nano 2018, 12, 6612–6619. [DOI] [PMC free article] [PubMed] [Google Scholar]
- (38).Farber C; Li J; Hager E; Chemelewski R; Mullet J; Rogachev AY; Kurouski D Complementarity of Raman and Infrared Spectroscopy for Structural Characterization of Plant Epicuticular Waxes. ACS Omega 2019, 4, 3700–3707. [Google Scholar]
- (39).Farber C; Wang R; Chemelewski R; Mullet J; Kurouski D Nanoscale Structural Organization of Plant Epicuticular Wax Probed by Atomic Force Microscope Infrared Spectroscopy. Anal. Chem 2019, 91, 2472–2479. [DOI] [PubMed] [Google Scholar]
- (40).Dazzi A Photothermal Induced Resonance. Application to Infrared Spectromicroscopy. In Thermal Nanosystems and Nanomaterials; Volz S, Ed.; Springer: Berlin, 2009; Vol. 118, pp 469–503. [Google Scholar]
- (41).Dazzi A; Prazeres R; Glotin F; Ortega JM; Al-Sawaftah M; de Frutos M Chemical Mapping of the Distribution of Viruses into Infected Bacteria with a Photothermal Method. Ultramicroscopy 2008, 108, 635–641. [DOI] [PubMed] [Google Scholar]
- (42).Kochan K; Perez-Guaita D; Pissang J; Jiang JH; Peleg AY; McNaughton D; Heraud P; Wood BR In Vivo Atomic Force Microscopy-Infrared Spectroscopy of Bacteria. J. Royal Soc. Interface 2018, 15, 20180115. [DOI] [PMC free article] [PubMed] [Google Scholar]
- (43).Wieland K; Ramer G; Weiss VU; Allmaier G; Lendl B; Centrone A Nanoscale Chemical Imaging of Individual Chemotherapeutic Cytarabine-Loaded Liposomal Nanocarriers. Nano Res 2019, 12, 197–203. [DOI] [PMC free article] [PubMed] [Google Scholar]
- (44).Zhou L; Kurouski D Structural Characterization of Individual Alpha-Synuclein Oligomers Formed at Different Stages of Protein Aggregation by Atomic Force Microscopy-Infrared Spectroscopy. Anal. Chem 2020, 92, 6806–6810. [DOI] [PubMed] [Google Scholar]
- (45).Herzberg M; Szunyogh D; Thulstrup PW; Hassenkam T; Hemmingsen L Probing the Secondary Structure of Individual Abeta40 Amorphous Aggregates and Fibrils by Afm-Ir Spectroscopy. Chembiochem 2020, 21, 3521–3524. [DOI] [PubMed] [Google Scholar]
- (46).Galante D; Ruggeri FS; Dietler G; Pellistri F; Gatta E; Corsaro A; Florio T; Perico A; D’Arrigo C A Critical Concentration of N-Terminal Pyroglutamylated Amyloid Beta Drives the Misfolding of Ab1-42 into More Toxic Aggregates. Int. J. Biochem. Cell Biol 2016, 79, 261–270. [DOI] [PubMed] [Google Scholar]
- (47).Jan A; Adolfsson O; Allaman I; Buccarello AL; Magistretti PJ; Pfeifer A; Muhs A; Lashuel HA Abeta42 Neurotoxicity Is Mediated by Ongoing Nucleated Polymerization Process Rather Than by Discrete Abeta42 Species. J. Biol. Chem 2011, 286, 8585–8596. [DOI] [PMC free article] [PubMed] [Google Scholar]
- (48).Ono K; Condron MM; Teplow DB Structure-Neurotoxicity Relationships of Amyloid Beta-Protein Oligomers. Proc. Natl. Acad. Sci. U. S. A 2009, 106, 14745–50. [DOI] [PMC free article] [PubMed] [Google Scholar]
- (49).Cataldi R; et al. A Dopamine Metabolite Stabilizes Neurotoxic Amyloid-Beta Oligomers. Commun. Biol 2021, 4, 19. [DOI] [PMC free article] [PubMed] [Google Scholar]
- (50).Shea D; et al. Alpha-Sheet Secondary Structure in Amyloid Beta-Peptide Drives Aggregation and Toxicity in Alzheimer’s Disease. Proc. Natl. Acad. Sci. U. S. A 2019, 116, 8895–8900. [DOI] [PMC free article] [PubMed] [Google Scholar]
- (51).Novitskaya V; Bocharova OV; Bronstein I; Baskakov IV Amyloid Fibrils of Mammalian Prion Protein Are Highly Toxic to Cultured Cells and Primary Neurons. J. Biol. Chem 2006, 281, 13828–13836. [DOI] [PubMed] [Google Scholar]
Associated Data
This section collects any data citations, data availability statements, or supplementary materials included in this article.


