

Abstract
Docosahexaenoic (DHA) and arachidonic acids (ARA) are omega-3 and omega-6 long-chain polyunsaturated fatty acids (LCPUFAs). These molecules constitute a substantial portion of phospholipids in plasma membranes. Therefore, both DHA and ARA are essential diet components. Once consumed, DHA and ARA can interact with a large variety of biomolecules, including proteins such as insulin and α-synuclein (α-Syn). Under pathological conditions known as injection amyloidosis and Parkinson’s disease, these proteins aggregate forming amyloid oligomers and fibrils, toxic species that exert high cell toxicity. In this study, we investigate the role of DHA and ARA in the aggregation properties of α-Syn and insulin. We found that the presence of both DHA and ARA at the equimolar concentrations strongly accelerated aggregation rates of α-Syn and insulin. Furthermore, LCPUFAs substantially altered the secondary structure of protein aggregates, whereas no noticeable changes in the fibril morphology were observed. Nanoscale Infrared analysis of α-Syn and insulin fibrils grown in the presence of both DHA and ARA revealed the presence of LCPUFAs in these aggregates. We also found that such LCPUFAs-rich α-Syn and insulin fibrils exerted significantly greater toxicities compared to the aggregates grown in the LCPUFAs-free environment. These findings show that interactions between amyloid-associated proteins and LCPUFAs can be the underlying molecular cause of neurodegenerative diseases.
Keywords: AFM-IR, alpha-synuclein, arachidonic acid, docosahexaenoic acid, insulin, LDH, ROS, unsaturated farry acids
1 |. INTRODUCTION
Arachidonic acid (ARA) is an essential component of the human diet that facilitates the repair and growth of skeletal muscle tissue.1,2 This omega-6 long-chain polyunsaturated fatty acid (LCPUFAs) is also involved in cell signaling and inflammatory responses. Finally, ARA presents in phospholipids of both organelle and plasma membranes.3 Docosahexaenoic acid (DHA) is an omega-3 PFA that is abundant in cold-water fish, including tuna and salmon.4,5 It plays a key role in the development of the retina and neurons.3,6 Therefore, constituting around 40% of LCPUFAs, DHA is the most abundant fatty acid present in brain phospholipids.7,8 Both of these LCPUFAs are broadly used as food supplies.
In the human body, LCPUFAs interact with a large number of molecules, including proteins and carbo-hydrates.9,10 Brain tissue is reached with α-synuclein (α-Syn), a small unordered protein that is primarily localized in synapse, where it regulates vesicle trafficking. In the presence of lipids and LCPUFAs, α-Syn adopts an α-helical secondary structure.7,8,11,12 This and other pieces of evidence suggest that both lipids and LCPUFAs can play an important role in the aggregation properties of α-Syn.13,14 These findings are significant because α-Syn aggregates are found in Lewy bodies, protein deposits observed in substantia nigra pars compacta, midbrain, hypothalamus, and thalamus upon Parkinson’s disease (PD).15,16 This severe neurodegenerative disorder affects more than 5 million people worldwide.15,17 Galvagnion and co-workers found that lipids could alter the rate of α-Syn aggregation.18–20 Our group found that lipids not only changed the rates of α-Syn aggregation but also uniquely modified the secondary structure of protein oligomers, toxic species that cause the spread of PD.21,22 Matveyenka and co-workers recently found that lipids could also alter the rates of insulin and lysozyme aggregation, as well as uniquely modify secondary structure and toxicity of insulin and lysozyme oligomers and fibrils.23–25
Insulin aggregation is associated with diabetes type 2 and injection amyloidosis.26 In a former case, insulin over-production in pancreas leads to protein misfolding and aggregation. In the latter case, high local concentrations of insulin are created upon the hormone injection into the skin dermis.27,28 This not only leads to insulin aggregation but can also catalyze aggregation of other proteins present in cell media which may result in systemic amyloidosis.29 Furthermore, lipids were found to be present in the structure of insulin oligomers and fibrils.23,24,30,31 These conclusions were made using atomic force microscopy Infrared (AFM-IR) spectroscopy.32–36 In AFM-IR, pulsed tunable IR light is used to cause thermal expansions in the analyzed samples. Next, a metallized scanning probe is positioned above the sample of interest to record these thermal expansions that are later converted to the IR spectra.37–39 If the laser frequency will be tuned to the resonance frequency of the scanning probe, the appearing resonance effect can be used for single-monolayer and even single-molecule sensitivity.40,41 This high sensitivity and nanometer spatial resolution was utilized to reveal the secondary structure of amyloid fibrils,32,34,35,42–44 plant epicuticular waxes,45,46 polymers,47 malaria-infected blood cells,48 bacteria,49–51 liposomes,52 and polycrystal-line perovskite films.53
In this study, we utilize AFM-IR, as well as set of biophysical and molecular biology assays, to investigate the extent to which both ARA and DHA can alter rates of α-Syn and insulin aggregation. We also determine LCPUFAs-induced changes in the secondary structure, morphology, and toxicity of α-Syn and insulin oligomers and fibrils.
2 |. MATERIALS AND METHODS
2.1 |. Materials
Bovine insulin was purchased from Sigma-Aldrich (CAS 11070–73-8, St. Louis, MO, USA), α-Syn was purchased from AnaSpec (Cat. N. AS-55555–1000, Fremont, CA, USA), (5Z,8Z,11Z,14Z)-Icosa-5,8,11,14-tetraenoic acid (ARA) from Spectrum chemical MFG Corp. (CAS 506–30-9), and (4Z,7Z,10Z,13Z,16Z,19Z)-docosa-4,7,10,13,16,19-hexaenoic acid (DHA) from Acros organics (CAS 6217–54-5).
2.2 |. Insulin aggregation
In the PFA-free environment, 400 μM of insulin was dissolved in 1×PBS; the solution pH was adjusted to pH 3.0 using concentrated HCl. For ARA-Ins and DHA-Ins, 400 μM of insulin was mixed with an equivalent concentration of the corresponding LCPUFAs; the pH of the final solution was adjusted to pH 3.0 using concentrated HCl. Next, samples were placed into 96-well plate that was kept in the plate reader (Tecan, Männedorf, Switzerland) at 37°C for 70 h under 510 rpm agitation.
2.3 |. α-Syn aggregation
α-Syn was dissolved to the final concentration of 50 μM, in 50 uM Tris buffer, 150 mM NaCl, pH at 7.5. Next, the solution of the α-Syn was immediately mixed with equimolar concentration of either ARA or DHA and kept at 37°C for 70 h under 510 rpm agitation.
2.4 |. Kinetic measurements
Rates of insulin and α-Syn aggregation were measured using thioflavin T (ThT) fluorescence assay. For this, samples were mixed with 2 mM of ThT solution and placed into 96-well plate that was kept in the plate reader (Tecan, Männedorf, Switzerland) at 37°C for 70 h under 510 rpm agitation. Fluorescence measurements were taken every 10 min (excitation wavelength was 450 nm; emission wavelength was 488 nm).
2.5 |. AFM imaging
Microscopic analysis of protein aggregates was performed on Nano-IR3 system (Bruker, Santa Barbara, CA, USA). An aliquot of the sample was diluted using DI water and then placed onto silicon wafer. After 2–3 min of sample exposition, its excess was removed, and the wafer surface was dried under a flow of dry nitrogen gas. Silicon AFM probes were used for all measurements (ContGB-G AFM probe, NanoAndMore, Watsonville, CA, USA). Pre-processing of the collected AFM images was made using Bruker Imaging software.
2.6 |. AFM-IR
AFM-IR spectra were collected on Nano-IR3 system (Bruker, Santa Barbara, CA, USA) equipped with a QCL laser using contact-mode AFM scanning probes (ContGB-G AFM probe, NanoAndMore, Watsonville, CA, USA). An aliquot of the protein sample was diluted using DI water and then placed on the silicon wafer. After 2–3 min, sample excess was removed from the silicon surface. Next, the wafer surface was dried under a flow of dry nitrogen gas. Collected spectra were pre-processed using Bruker Imaging software.
2.7 |. Attenuated total reflectance Fourier-transform Infrared (ATR-FTIR) spectroscopy
An aliquot of the protein sample was placed onto ATR crystal and dried at room temperature. Spectra were measured using Spectrum 100 FTIR spectrometer (Perkin-Elmer, Waltham, MA, USA). Three spectra were collected from each sample and averaged using Thermo Grams Suite software (Thermo Fisher Scientific, Waltham, MA, USA).
2.8 |. Cell toxicity assays
Rat midbrain N27 cells were grown in RPMI 1640 Medium (Thermo Fisher Scientific, Waltham, MA, USA) with 10% fetal bovine serum (FBS) (Invitrogen, Waltham, MA, USA) in 96-well plate (10 000 cells per well) at 37°C under 5% CO2. We ensured that after 24 h, the cells were fully adhered to the wells and reached ~70% confluency. Next, 100 μL of the cell culture was replaced with 100 μL RPMI 1640 Medium with 5% FBS-containing protein samples. After 24 h of incubation with the sample of the protein aggregates, lactate dehydrogenase (LDH) assay was performed on the cell medium using CytoTox 96 non-radioactive cytotoxicity assay (G1781, Promega, Madison, WI, USA). Absorption measurements were made in plate reader (Tecan, Männedorf, Switzerland) at 490 nm. Every well was measured 25 times in different locations.
In parallel, a reactive oxygen species (ROS) assay was performed using the same cell culture. Briefly, ROS reagent (C10422, Invitrogen, Waltham, MA, USA) was added to reach the final concentration of 5 μM and incubated at 37°C under 5% CO2 for 30 min. After the supernatant was removed, cells were washed with PBS and resuspended in 200 μL of PBS in the flow cytometry tubes. Sample measurements were made in LSRII BD flow cytometer (BD, San Jose, CA, USA) using red channel (λ = 633 nm). Percentages of ROS cells were determined using LSRII BD software. For JC-1 staining, 1 μL of JC-1 reagent (M34152A, Invitrogen, Waltham, MA, USA) was added to cells and incubated at 37°C under 5% CO2 for 30 min. After the supernatant was removed, cells were washed with PBS and resuspended in 200 μL of PBS in the flow cytometry tubes. Sample measurements were made in LSRII BD flow cytometer (BD, San Jose, CA, USA) using red channel (λ = 633 nm). Percentages of ROS cells were determined using LSRII BD software.
3 |. RESULTS
3.1 |. Kinetics of protein aggregation
We first investigated whether ARA and DHA could have any effect on the rate of α-Syn and insulin aggregation. For this, both proteins were mixed in 1:1 molar ratio with ARA and DHA. The protein-lipid solutions were mixed with ThT and kept at 37°C under 510 rpm agitation.
In the lipid-free environment, α-Syn and insulin aggregation has a lag phase (α-Syn tlag = 22.1 h ± 0.5 h; insulin tlag = 14.4 h ± 0.3 h), Figure 1, that is followed by a rapid increase in the ThT fluorescence, which demonstrates the formation of protein aggregates. The presence of both ARA and DHA drastically shortened the lag phase of α-Syn aggregation (α-Syn:ARA and α-Syn:DHA tlag = 14.9 h ± 0.8 h). We observed an even stronger effect of LCPUFAs on the rate of insulin aggregation. Specifically, in the presence of DHA, insulin tlag shortened to 5.0 h ± 0.1 h, whereas ARA caused nearly instantaneous protein aggregation with tlag = 2.1 h ± 0.1 h. These findings show that both ARA and DHA strongly accelerate the aggregation of α-Syn and insulin.
FIGURE 1.
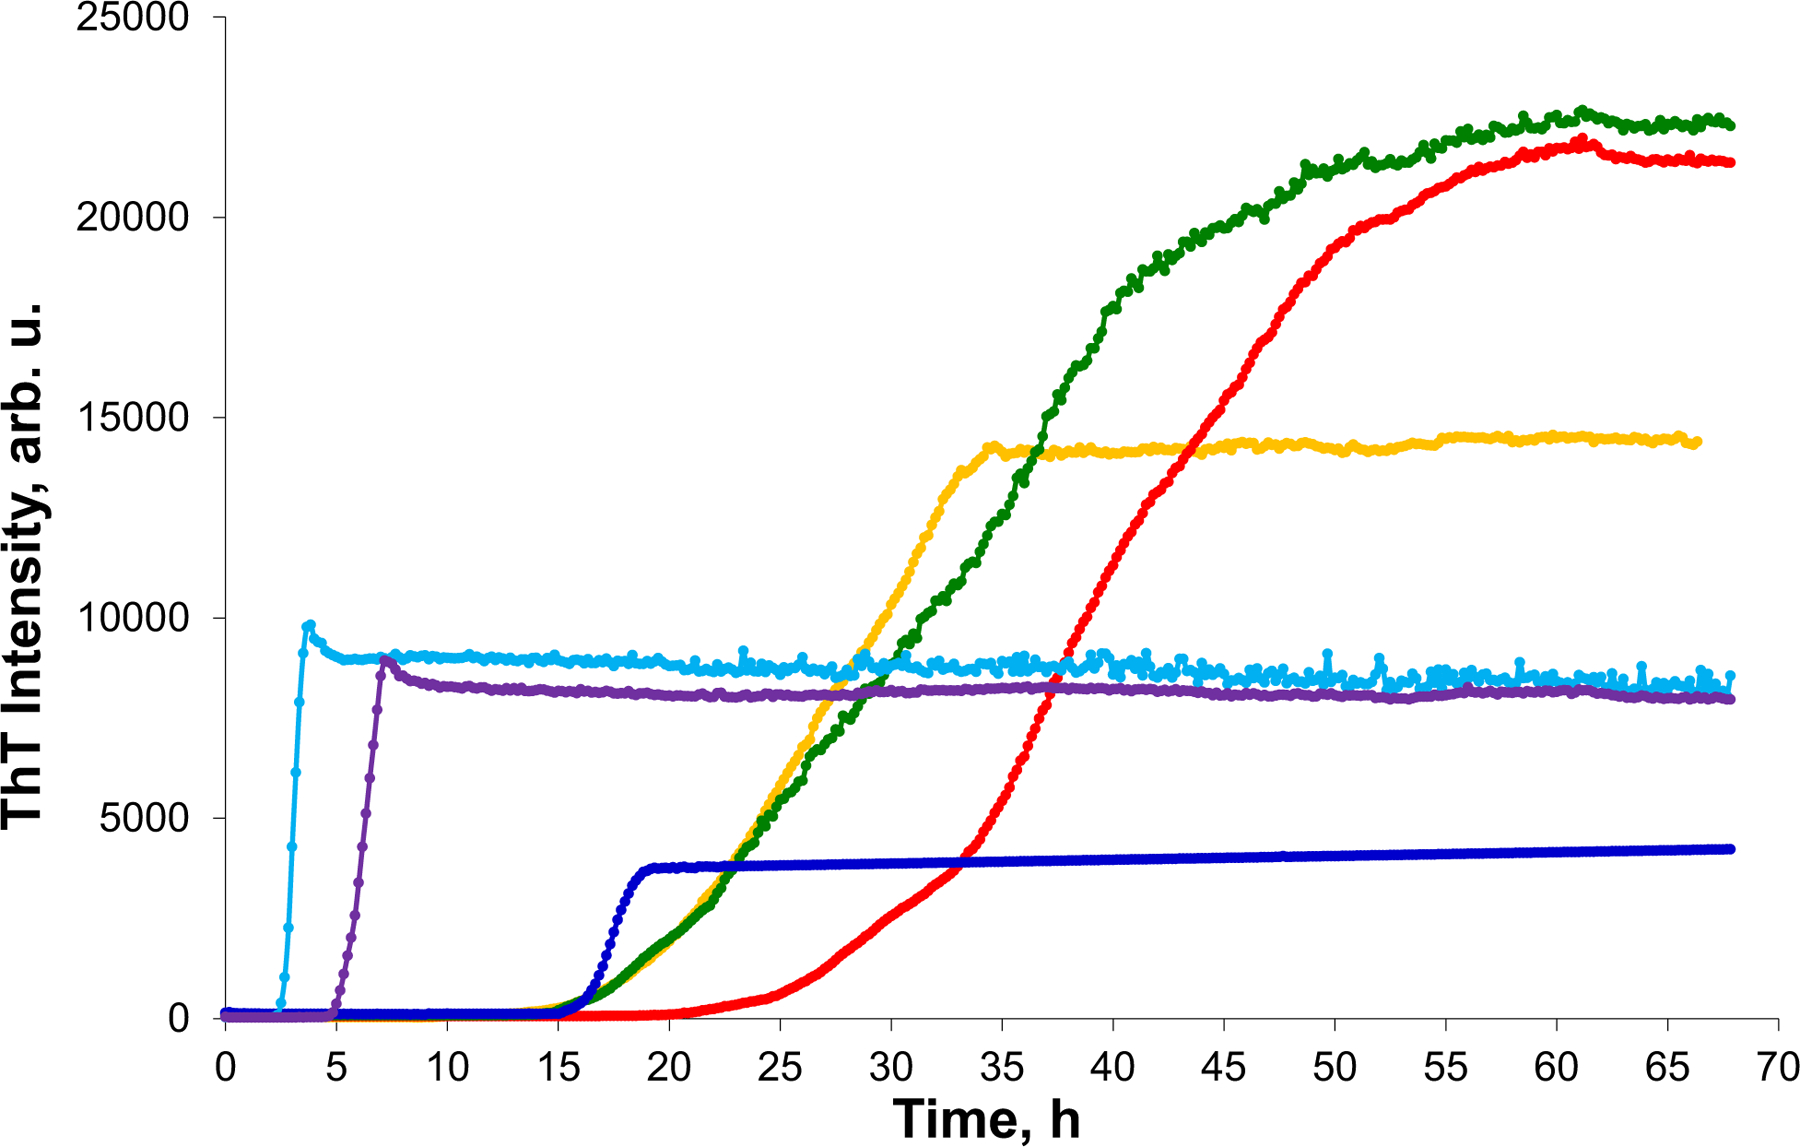
ARA and DHA uniquely alter the rate of α-Syn and insulin aggregation. ThT aggregation kinetics of α-Syn (red) in the lipid-free environment, in the presence of ARA (yellow) and DHA (green); insulin (blue), insulin in the presence of ARA (light blue) and DHA (purple) at 1:1 molar ratio. tlag was calculated as 10% of ThT intensity maximum, and t1/2 as 50% of ThT intensity maximum. Data were analyzed using ANOVA, p < 0.05. Tuckey HSD posthoc test was used for further group comparison.
We also found that the rate (t1/2) of α-Syn and insulin aggregation was affected by ARA and DHA (Figure 1). Specifically, in the presence of ARA and DHA, t1/2 of insulin was 2.5 h ± 0.1 h (Ins:ARA) and 6.2 ± 0.2 h (Ins:DHA), whereas in the lipid-free environment insulin aggregation rate was t1/2 = 18.0 ± 0.4 h. In the presence of ARA and DHA, t1/2 of α-Syn was 28.4.2 ± 0.4 h (α-Syn:ARA) and 35.2 ± 0.4 h (α-Syn:DHA), whereas in the lipid-free environment, α-Syn aggregation rate was t1/2 = 40.7 ± 0.4 h. This finding shows that ARA and DHA uniquely alter rates of both α-Syn and insulin aggregation.
3.2 |. Morphological analysis of protein aggregates
AFM imaging did not reveal substantial differences in morphologies of α-Syn and insulin aggregates grown in the presence of ARA and DHA, as well as in the LCPUFAs-free environment. We found long fibrils in α-Syn:ARA and α-Syn:DHA that had 7–8 nm in height and stretched for hundreds of microns in length (Figure 2). Morphologically similar fibrils were found for α-Syn grown in the LCPUFAs-free environment. The same conclusion can be made about insulin aggregates grown in the presence of ARA and DHA, as well as in the LCPUFAs-free environment. Specifically, we found fibrils in Ins, Ins:ARA, and Ins:DHA that had ~6–9 nm in height and 300–500 nm in length. Thus, we can conclude that LCPUFAs did not significantly change morphologies of α-Syn and Ins fibrils.
FIGURE 2.

Morphologies of α-Syn and insulin aggregates grown in the presence of LCPUFAs, as well as in the LCPUFAs-free environment. AFM images of α-Syn:ARA (A–C), Ins:ARA (D–F), α-Syn:DHA (G–I), Ins:DHA (J–L), α-Syn (M–O), and Ins (P–R) aggregates.
3.3 |. Structural characterization of protein aggregates
We utilized ATR-FTIR to examine the secondary structure of α-Syn and insulin aggregates grown in the presence of LCPUFAs, as well as in the LCPUFAs-free environment (Figure 3). We found that α-Syn aggregates grown in the LCPUFAs-free environment exhibited IR spectrum with the amide I band centered around 1630 cm−1 with a shoulder at ~1660 cm−1 (Figure 3A). These bands correspond to parallel β-sheet and unordered protein secondary structure, respectively.23–25 We also observed amide II bands with two major peaks at 1520 and 1542 cm−1 (Figure 3A). These results show that secondary structure of α-Syn aggregates grown in the LCPUFAs-free environment is dominated by parallel β-sheet with a small contribution of unordered protein secondary structure. α-Syn:ARA and α-Syn:DHA aggregates exhibited similar to LCPUFAs-free α-Syn fibrils IR spectra, which indicates that these fibrils are primarily composed of parallel β-sheet (Figure 3A). However, we observed a small shift of 1630 cm−1 (LCPUFAs-free α-Syn) to 1625 cm−1 in the IR spectra of both α-Syn:ARA and α-Syn:DHA. These results demonstrate substantial differences in the conformation of β-sheet secondary structure in LCPUFAs-free α-Syn fibrils and α-Syn aggregates grown in the presence of both ARA and DHA. It should be noted that ARA and DHA lipids themselves exhibit vibrational bands neither in the amide I nor in amide II region of the IR spectra. However, these LCPUFAs show strong vibrational bands in the lower frequency region (Figure 3B). Specifically, in the IR spectra of ARA and DHA, we observed vibrational bands at ~860 cm−1 and 950 cm−1 that can be assigned to C-C stretching vibrations and carbonyl vibrations, respectively.23–25 We also observed bands between 1050 and 1170 cm−1 (Figure 3B). These vibrational bands correspond to C=O bending and -HC=CH- vibrations of LCPUFAs polar heads and aliphatic tails, respectively.23–25 We found similar vibrational bands in the IR spectra acquired from α-Syn:ARA and α-Syn:DHA that were absent in the IR spectra acquired from LCPUFAs-free α-Syn fibrils (Figure 3B). These suggest that both LCPUFAs are present in the structures of the corresponding protein aggregates. Furthermore, we found that frequencies of the discussed above vibrations shifted in the IR spectra acquired from α-Syn:ARA and α-Syn:DHA compared to the frequencies of these bands in the IR spectra of LCPUFAs themselves. Specifically, we observed a blueshift of 864 to 846 cm−1, 986 to 970 cm−1, and a redshift of 1078 to 1108 cm−1 (Figure 3B). These spectroscopic changes point to the interactions that are taken place between the α-Syn and LCPUFAs. Thus, both ARA and DHA were not only co-present with the protein in α-Syn:ARA and α-Syn:DHA aggregates, but also developed hydrophobic and electro-static interactions with α-Syn.
FIGURE 3.

IR spectra acquired from α-Syn, α-Syn:ARA and α-Syn:DHA (A,B) and Ins, Ins:ARA and Ins:DHA (C,D) aggregates, as well as from ARA and DHA lipids themselves (A–D).
IR spectrum of insulin fibrils grown in the LCPUFAs-free environment (Ins) exhibited IR spectrum with the amide I band centered around 1625 cm−1 with a shoulder at ~1660 cm−1, which indicates the predominance of parallel β-sheet in the secondary structure of these aggregates (Figure 3C). In the IR spectra acquired from both Ins:ARA and Ins:DHA, we found a shoulder at ~1660 cm−1 much more intense relative to the peak at ~1630 cm−1 than in the spectra of Ins. These results point to the larger amount of unordered protein in the secondary structure of Ins:ARA and Ins:DHA aggregates compared to Ins fibrils. We also found a small shift of 1625 cm−1 (LCPUFAs-free Ins) to 1630 cm−1 in the IR spectra of both Ins:ARA and Ins:DHA. These results demonstrate substantial differences in the conformation of β-sheet secondary structure in Ins fibrils grown in the LCPUFAs-free environment compared to Ins aggregates grown in the presence of both ARA and DHA.
We also found changes in the lower wavenumber region of IR spectra that point to the interactions between Ins and LCPUFAs (Figure 3D). Specifically, 864 cm−1 of both ARA and DHA redshifted to 885 cm−1 in the IR spectra acquired from Ins:ARA and Ins:DHA. We also observed an intense vibration centered at 960 cm−1 in the spectra collected from Ins:ARA and Ins:DHA that was not observed in the IR spectra of LCPUFAs themselves. Finally, we found substantial changes in 1050–1150 cm−1 between the spectra of LCPUFAs and Ins:ARA and Ins:DHA aggregates (Figure 3D). These results point to strong interactions of hydrophobic tails and charged polar heads of LCPUFAs and insulin that are taken place upon protein aggregation in the presence of both ARA and DHA. Based on these results, we can conclude that ARA and DHA drastically change secondary structure of both insulin and α-Syn aggregates grown in their presence.
Next, we utilized AFM-IR to perform quantitative analysis of protein secondary structure in the analyzed α-Syn and insulin fibrils. AFM-IR allows for a precise positioning of the scanning probe directly on the sample of interest. Thus, it allows for minimization or complete elimination of the signal from unaggregated protein monomers that could not be excluded using discussed above ATR-FTIR. AFM-IR revealed striking differences in the secondary structure of α-Syn:ARA and α-Syn:DHA aggregates (Figure 4A–C). Specifically, we found that α-Syn:ARA fibrils had ~48% of parallel β-sheet and ~24% of anti-parallel β-sheet in their structure, whereas ~28% were occupied by unordered protein (Figure 4D). α-Syn:DHA aggregates possessed similar amount of parallel β-sheet (45%); however, these aggregates contained significantly lower amounts of anti-parallel β-sheet in their structure (12%), whereas nearly 47% of their secondary structure was dominated by unordered protein secondary structure (Figure 4D). These findings demonstrate that LCPUFAs uniquely altered the secondary structure of α-Syn fibrils grown in their presence. This conclusion is further supported by the quantitative assessment of the secondary structure profile of α-Syn fibrils grown in a lipid-free environment. Specifically, we found that α-Syn fibrils were dominated by parallel β-sheet (69%) with only a small amount of anti-parallel β-sheet (4%). These fibrils contained ~27% of unordered protein secondary structure (Figure 4D).
FIGURE 4.

AFM-IR spectra were acquired from α-Syn:ARA (A), α-Syn:DHA (B), and α-Syn (C) fibrils. Histograms of relative amount of anti-parallel β-sheet, unordered protein, and parallel β-sheet in the analyzed fibrils (D).
It should be noted that in the AFM-IR spectra acquired from α-Syn:ARA and α-Syn:DHA fibrils, we observed vibrational bands centered around 1725 cm−1, which could be assigned to the carbonyl vibration of LCPUFAs (Figure 4A–C). These bands were not observed in the AFM-IR spectra collected from α-Syn fibrils grown in the LCPUFAs-free environment. These results further confirm discussed above experimental evidence that points to the presence of both ARA and DHA in the structure of corresponding α-Syn fibrils.
We also utilized AFM-IR to examine the secondary structure of Ins:ARA, Ins:DHA, and Ins fibrils (Figure 5A–C). We found that Ins:ARA fibrils had ~47% of parallel β-sheet and ~23% of anti-parallel β-sheet in their structure, whereas ~30% were occupied by unordered protein (Figure 5D). Ins:DHA fibrils possessed a similar amount of parallel β-sheet (49%); however, these aggregated contained significantly higher amounts of unordered protein secondary structure (47%), with only 4% of anti-parallel β-sheet in their structure (Figure 5D). These findings demonstrate that both ARA and DHA uniquely altered the secondary structure of insulin fibrils grown in their presence. It should be noted that secondary structures of both Ins:ARA and Ins:DHA were drastically different from the secondary structure of Ins fibrils that had ~72% of parallel β-sheet, 22% of unordered protein, and 6% of anti-parallel β-sheet (Figure 5D). These results point to a drastic difference in insulin fibrils grown in the presence of LCPUFAs compared to the aggregates formed in the lipid-free environment.
FIGURE 5.

AFM-IR spectra acquired from Ins:ARA (A), Ins:DHA (B), and Ins (C) fibrils. Histograms of relative amount of anti-parallel β-sheet, unordered protein, and parallel β-sheet in the analyzed fibrils (D).
In the AFM-IR spectra acquired from Ins:ARA and Ins:DHA fibrils, we observed vibrational bands that could be assigned to the carbonyl vibration of LCPUFAs (Figure 5A–C). Similar to α-Syn fibrils, these bands were not observed in the AFM-IR spectra collected from Ins fibrils grown in the LCPUFAs-free environment. These results further confirm the experimental evidence discussed above that points to the presence of both ARA and DHA in the structure of corresponding Ins fibrils.
3.4 |. Toxicity of insulin aggregates
The question to ask is whether the observed structural differences have any biological significance. To answer this question, we investigated the extent to which α-Syn, α-Syn:ARA and α-Syn:DHA, Ins, Ins:ARA and Ins:DHA exert cell toxicity, induce mitochondrial dysfunction, and cause ROS stress in rat midbrain N27 cell line (Figure 6). LDH test indicated that both α-Syn:ARA exerted nearly twice higher cell toxicity compared to α-Syn fibrils grown in the LCPUFAs-free environment. Similar findings were observed for Ins:ARA and Ins:DHA. These aggregates were found to be nearly two times more toxic than Ins fibrils formed in the lipid-free envieronment. We also observed statistically significant differences between toxicity exerted by Ins:ARA and Ins:DHA aggregates. These results demonstrate that LCPUFAs drastically increase toxicity of amyloid aggregates. It should be noted that neither DHA nor ARA themselves was found to be toxic to mice midbrain N27 cells.
FIGURE 6.

α-Syn and insulin aggregates grown in the presence of LCPUFAs exert different cell toxicity compared to the aggregates grown in the LCPUFAs-free environment. Histograms of LDH (A), ROS (B), and JC-1 (C) assays of α-Syn, α-Syn:ARA, α-Syn:DHA, Ins, Ins:ARA and Ins:DHA, as well as ARA and DHA themselves. Black asterisks (*) show significance level of differences between α-Syn and α-Syn:ARA, α-Syn:DHA, ARA, DHA, and control; red asterisks (*) show significance level of differences between Ins, Ins:ARA and Ins:DHA, ARA, DHA, and control; green NS shows insignificance level of differences between ARA, DHA and control. *p ≤ .05; **p ≤ .01; ***p ≤ .001; ****p ≤ .0001; NS, non significant difference.
We found a similar relationship between the structure of the protein:LCPUFAs aggregates and the induced ROS levels and mitochondrial dysfunction in mice midbrain N27 cells. However, we found that both α-Syn:ARA and α-Syn:DHA exerted significantly higher ROS levels and stronger mitochondrial impairment compared to α-Syn fibrils grown in the LCPUFAs-free environment. We also found that Ins:ARA and Ins:DHA aggregates induced significantly stronger ROS levels and greater mitochondrial dysfunction in the cells compared to Ins fibrils. It should be noted that we did not observe significant differences in ROS levels between α-Syn:ARA and α-Syn:DHA, as well as between Ins:ARA and Ins:DHA aggregates. Similar conclusions could be made about the levels of mitochondrial dysfunction in mice midbrain N27 cells caused by these pairs of protein:LCPUFAs aggregates. It should be noted that neither DHA nor ARA themselves was found to be causing significant levels of ROS stress and mitochondrial dysfunction in mice midbrain N27 cells. Thus, we can conclude that both ARA and DHA drastically increase the toxicity of insulin and α-Syn fibrils grown in their presence.
4 |. DISCUSSION
Humans cannot synthesize omega-6 and omega-3 PUFAs de novo. Therefore, both ARA and DHA are broadly used food supplies.3,6 These PUFAs constitute substantial fraction of FAs in lipids of plasma membranes, as well as perform important roles in physiological homeostasis.7,8 A growing body of evidence demonstrated the role of PUFAs in cognitive attention and memory, mood states, coronary circulation, and cirrhosis.54–57 However, the role of both ARA and DHA in neurodegeneration remained poorly understood.
Previously reported experimental findings by our and other research groups demonstrated that lipids uniquely altered the aggregation rates of amyloid-associated proteins, such as insulin, lysozyme, and α-Syn.19,20,22–25,30,31,58–60 Furthermore, we found that lipids drastically changed secondary structure of protein aggregates formed in their presence.23,24,30,31,58,61 These structural changes have clear biological significance as the toxicity exerted by such protein: lipid aggregates uniquely changed. Specifically, we found that insulin and lysozyme aggregates grown in the presence of phospholipids exhibited significantly lower cell toxicity compared to those formed in the lipid-free environment.24,25,58 However, our recent findings demonstrated that such conclusion could hold true only for phospholipids with saturated FAs.23,30 Specifically, insulin aggregation in the presence of lipids with unsaturated FAs yielded significantly more toxic fibrils compared to those formed in the presence of lipids with saturated FAs.23,30 These findings suggest that unsaturated FAs that present in lipids at the stage of protein aggregation drastically increased the toxicity of corresponding protein aggregates.
Our current findings demonstrate that free PUFAs, which can be encountered by amyloidogenic proteins in the human body, accelerate the aggregation of such proteins. This results in the formation of structurally different fibrils compared to those formed in the PUFAs-free environment. Our experimental results show that both ARA and DHA were present in insulin and α-Syn fibrils that were grown in the presence of these PUFAs. This results in significantly higher toxicity than such protein:PUFAs expert to mice midbrain N27 cell line compared to insulin and but not to α-Syn fibrils formed in the PUFAs-free environment.
Our previous results showed that amyloid aggregates are endocytosed by cells.24,58 Next, they damage endosomal membranes, which triggers de novo endosomal biogenesis and leakages of Ca2+ into the cytosol.24,58 In the cell, amyloid aggregates exert cell toxicity by causing mitochondrial dysfunction, as well as enchanting ROS levels.23–25,30,31,58 We also found that the presence of amyloid aggregates in the cytosol causes strong unfolded protein response, which indicates amyloid-induced damage of endoplasmic reticulum of cells.58 One can expect that presence of PUFAs in the structure of the protein aggregates facilitates their membrane permeability, which results in enhanced cell toxicity compared to the fibrils grown in the PUFAs-free environment.
5 |. CONCLUSIONS
Our results show that ARA and DHA accelerate aggregation of both α-Syn and insulin, which results in the formation of morphologically similar fibrils. However, these α-Syn:PUFAs and Ins:PUFAs aggregates have drastically different secondary structures compared to both α-Syn and Ins fibrils formed in the PUFAs-free environment. AFM-IR analysis of protein aggregates grown in the presence of PUFAs suggests that both ARA and DHA uniquely altered their secondary structure. Furthermore, we found that both ARA and DHA were present in the structure of α-Syn and insulin fibrils that were formed in their presence. This structural difference, as well as the presence of PUFAs enhanced toxicity of insulin fibrils, but not aSyn fibrils. These results show that PUFAs can have a strongly negative effect on neurodegeneration.
ACKNOWLEDGMENTS
We are grateful to the National Institute of Health for providing financial support (R35GM142869).
Funding information
HHS | NIH | National Institute of General Medical Sciences (NIGMS), Grant/Award Number: R35GM142869
Abbreviations:
- AFM
atonic force microscopy
- AFM-IR
atomic force microscopy Infrared spectroscopy
- ARA
arachidonic acid
- ATR-FTIR
attenuated total reflection Fourier-transformed Infrared spectroscopy
- DHA
docosahexaenoic acid; Ins, insulin
- LCPUFAs
long-chain polyunsaturated fatty acids
- LDH
lactate dehydrogenase
- PBS
phosphate buffer saline
- ROS
reactive oxygen species
- ThT
thioflavin T
- α-Syn
alpha-synuclein
Footnotes
DISCLOSURES
The authors declare no competing financial interests.
DATA AVAILABILITY STATEMENT
All the data in this study can be provided by the corresponding author if needed.
REFERENCES
- 1.van Meer G, Voelker DR, Feigenson GW. Membrane lipids: where they are and how they behave. Nat Rev Mol Cell Biol. 2008;9(2):112–124. doi: 10.1038/nrm2330 [DOI] [PMC free article] [PubMed] [Google Scholar]
- 2.Fahy E, Subramaniam S, Murphy RC, et al. Update of the LIPID MAPS comprehensive classification system for lipids. J Lipid Res. 2009;50(Suppl):S9–S14. doi: 10.1194/jlr.R800095-JLR200 [DOI] [PMC free article] [PubMed] [Google Scholar]
- 3.Fitzner D, Bader JM, Penkert H, et al. Cell-type- and brain-region-resolved mouse brain Lipidome. Cell Rep. 2020;32(11):108132. doi: 10.1016/j.celrep.2020.108132 [DOI] [PubMed] [Google Scholar]
- 4.Pope S, Land JM, Heales SJ. Oxidative stress and mitochondrial dysfunction in neurodegeneration; cardiolipin a critical target? Biochim Biophys Acta. 2008;1777(7–8):794–799. doi: 10.1016/j.bbabio.2008.03.011 [DOI] [PubMed] [Google Scholar]
- 5.Falabella M, Vernon HJ, Hanna MG, Claypool SM, Pitceathly RDS. Cardiolipin, mitochondria, and neurological disease. Trends Endocrinol Metab. 2021;32(4):224–237. doi: 10.1016/j.tem.2021.01.006 [DOI] [PMC free article] [PubMed] [Google Scholar]
- 6.Michaelson DM, Barkai G, Barenholz Y. Asymmetry of lipid organization in cholinergic synaptic vesicle membranes. Biochem J. 1983;211(1):155–162. doi: 10.1042/bj2110155 [DOI] [PMC free article] [PubMed] [Google Scholar]
- 7.Sonntag Y, Musgaard M, Olesen C, et al. Mutual adaptation of a membrane protein and its lipid bilayer during conformational changes. Nat Commun. 2011;2:304. doi: 10.1038/ncomms1307 [DOI] [PubMed] [Google Scholar]
- 8.Kayed R, Sokolov Y, Edmonds B, et al. Permeabilization of lipid bilayers is a common conformation-dependent activity of soluble amyloid oligomers in protein misfolding diseases. J Biol Chem. 2004;279(45):46363–46366. doi: 10.1074/jbc.C400260200 [DOI] [PubMed] [Google Scholar]
- 9.Ruiperez V, Darios F, Davletov B. Alpha-synuclein, lipids and Parkinson’s disease. Prog Lipid Res. 2010;49(4):420–428. doi: 10.1016/j.plipres.2010.05.004 [DOI] [PubMed] [Google Scholar]
- 10.Chen CT, Green JT, Orr SK, Bazinet RP. Regulation of brain polyunsaturated fatty acid uptake and turnover. Prostaglandins Leukot Essent Fatty Acids. 2008;79(3–5):85–91. doi: 10.1016/j.plefa.2008.09.003 [DOI] [PubMed] [Google Scholar]
- 11.Jiang Z, de Messieres M, Lee JC. Membrane remodeling by alpha-synuclein and effects on amyloid formation. J Am Chem Soc. 2013;135(43):15970–15973. doi: 10.1021/ja405993r [DOI] [PMC free article] [PubMed] [Google Scholar]
- 12.Jo E, McLaurin J, Yip CM, St George-Hyslop P, Fraser PE. Alpha-synuclein membrane interactions and lipid specificity. J Biol Chem. 2000;275(44):34328–34334. doi: 10.1074/jbc.M004345200 [DOI] [PubMed] [Google Scholar]
- 13.Davidson WS, Jonas A, Clayton DF, George JM. Stabilization of alpha-synuclein secondary structure upon binding to synthetic membranes. J Biol Chem. 1998;273(16):9443–9449. doi: 10.1074/jbc.273.16.9443 [DOI] [PubMed] [Google Scholar]
- 14.Zhu M, Fink AL. Lipid binding inhibits alpha-synuclein fibril formation. J Biol Chem. 2003;278(19):16873–16877. doi: 10.1074/jbc.M210136200 [DOI] [PubMed] [Google Scholar]
- 15.Surmeier DJ, Obeso JA, Halliday GM. Selective neuronal vulnerability in Parkinson disease. Nat Rev Neurosci. 2017;18(2):101–113. doi: 10.1038/nrn.2016.178 [DOI] [PMC free article] [PubMed] [Google Scholar]
- 16.Goedert M, Spillantini MG, Del Tredici K, Braak H. 100 years of Lewy pathology. Nat Rev Neurol. 2013;9(1):13–24. doi: 10.1038/nrneurol.2012.242 [DOI] [PubMed] [Google Scholar]
- 17.Hawkes CH, Del Tredici K, Braak H. Parkinson’s disease: a dual-hit hypothesis. Neuropathol Appl Neurobiol. 2007;33(6):599–614. doi: 10.1111/j.1365-2990.2007.00874.x [DOI] [PMC free article] [PubMed] [Google Scholar]
- 18.Alza NP, Iglesias Gonzalez PA, Conde MA, Uranga RM, Salvador GA. Lipids at the crossroad of alpha-synuclein function and dysfunction: biological and pathological implications. Front Cell Neurosci. 2019;13:175. doi: 10.3389/fncel.2019.00175 [DOI] [PMC free article] [PubMed] [Google Scholar]
- 19.Galvagnion C The role of lipids interacting with—synuclein in the pathogenesis of Parkinson’s disease. J Parkinsons Dis. 2017;7:433–450. [DOI] [PubMed] [Google Scholar]
- 20.Galvagnion C, Brown JW, Ouberai MM, et al. Chemical properties of lipids strongly affect the kinetics of the membrane-induced aggregation of alpha-synuclein. Proc Natl Acad Sci USA. 2016;113(26):7065–7070. doi: 10.1073/pnas.1601899113 [DOI] [PMC free article] [PubMed] [Google Scholar]
- 21.Dou T, Zhou L, Kurouski D. Unravelling the structural organization of individual alpha-synuclein oligomers grown in the presence of phospholipids. J Phys Chem Lett. 2021;12(18):4407–4414. doi: 10.1021/acs.jpclett.1c00820 [DOI] [PubMed] [Google Scholar]
- 22.Dou T, Kurouski D. Phosphatidylcholine and phosphatidylserine uniquely modify the secondary structure of alpha-synuclein oligomers formed in their presence at the early stages of protein aggregation. ACS Chem Nerosci. 2022;13(16):2380–2385. doi: 10.1021/acschemneuro.2c00355 [DOI] [PMC free article] [PubMed] [Google Scholar]
- 23.Matveyenka M, Rizevsky S, Kurouski D. The degree of unsaturation of fatty acids in phosphatidylserine alters the rate of insulin aggregation and the structure and toxicity of amyloid aggregates. FEBS Lett. 2022;596(11):1424–1433. doi: 10.1002/1873-3468.14369 [DOI] [PMC free article] [PubMed] [Google Scholar]
- 24.Matveyenka M, Rizevsky S, Pellois JP, Kurouski D. Lipids uniquely alter rates of insulin aggregation and lower toxicity of amyloid aggregates. Biochim Biophys Acta Mol Cell Biol Lipids. 2023;1868(1):159247. doi: 10.1016/j.bbalip.2022.159247 [DOI] [PMC free article] [PubMed] [Google Scholar]
- 25.Matveyenka M, Zhaliazka K, Rizevsky S, Kurouski D. Lipids uniquely alter secondary structure and toxicity of lysozyme aggregates. FASEB J. 2022;36(10):e22543. doi: 10.1096/fj.202200841R [DOI] [PMC free article] [PubMed] [Google Scholar]
- 26.D’Souza A, Theis JD, Vrana JA, Buadi F, Dispenzieri A, Dogan A. Localized insulin-derived amyloidosis: a potential pitfall in the diagnosis of systemic amyloidosis by fat aspirate. Am J Hematol. 2012;87(11):E131–E132. doi: 10.1002/ajh.23334 [DOI] [PubMed] [Google Scholar]
- 27.Gupta Y, Singla G, Singla R. Insulin-derived amyloidosis. Indian J Endocrinol Metab. 2015;19(1):174–177. doi: 10.4103/2230-8210.146879 [DOI] [PMC free article] [PubMed] [Google Scholar]
- 28.Shikama Y, Kitazawa J, Yagihashi N, et al. Localized amyloidosis at the site of repeated insulin injection in a diabetic patient. Intern Med. 2010;49(5):397–401. doi: 10.2169/internalmedicine.49.2633 [DOI] [PubMed] [Google Scholar]
- 29.Iwaya K, Zako T, Fukunaga J, et al. Toxicity of insulin-derived amyloidosis: a case report. BMC Endocr Disord. 1991;19:61. [DOI] [PMC free article] [PubMed] [Google Scholar]
- 30.Matveyenka M, Rizevsky S, Kurouski D. Unsaturation in the fatty acids of phospholipids drastically alters the structure and toxicity of insulin aggregates grown in their presence. J Phys Chem Lett. 2022;13:4563–4569. doi: 10.1021/acs.jpclett.2c00559 [DOI] [PMC free article] [PubMed] [Google Scholar]
- 31.Matveyenka M, Rizevsky S, Kurouski D. Length and unsaturation of fatty acids of phosphatidic acid determines the aggregation rate of insulin and modifies the structure and toxicity of insulin aggregates. ACS Chem Nerosci. 2022;13(16):2483–2489. doi: 10.1021/acschemneuro.2c00330 [DOI] [PubMed] [Google Scholar]
- 32.Rizevsky S, Kurouski D. Nanoscale structural organization of insulin fibril polymorphs revealed by atomic force microscopy-infrared spectroscopy (AFM-IR). Chembiochem. 2020;21(4):481–485. doi: 10.1002/cbic.201900394 [DOI] [PubMed] [Google Scholar]
- 33.Ruggeri FS, Charmet J, Kartanas T, et al. Microfluidic deposition for resolving single-molecule protein architecture and heterogeneity. Nat Commun. 2018;9(1):3890. doi: 10.1038/s41467-018-06345-4 [DOI] [PMC free article] [PubMed] [Google Scholar]
- 34.Ruggeri FS, Flagmeier P, Kumita JR, et al. The influence of pathogenic mutations in alpha-synuclein on biophysical and structural characteristics of amyloid fibrils. ACS Nano. 2020;14(5):5213–5222. doi: 10.1021/acsnano.9b09676 [DOI] [PubMed] [Google Scholar]
- 35.Ruggeri FS, Longo G, Faggiano S, Lipiec E, Pastore A, Dietler G. Infrared nanospectroscopy characterization of oligomeric and fibrillar aggregates during amyloid formation. Research Support, Non-US Gov’t. Nat Commun. 2015;6:7831. doi: 10.1038/ncomms8831 [DOI] [PMC free article] [PubMed] [Google Scholar]
- 36.Zhou L, Kurouski D. Structural characterization of individual alpha-synuclein oligomers formed at different stages of protein aggregation by atomic force microscopy-infrared spectroscopy. Anal Chem. 2020;92(10):6806–6810. doi: 10.1021/acs.analchem.0c00593 [DOI] [PubMed] [Google Scholar]
- 37.Dazzi A, Glotin F, Carminati R. Theory of infrared nanospectroscopy by photothermal induced resonance. J Appl Phys. 2010;107(12):124519. [Google Scholar]
- 38.Dazzi A, Prater CB. AFM-IR: technology and applications in nanoscale infrared spectroscopy and chemical imaging. Chem Rev. 2017;117(7):5146–5173. doi: 10.1021/acs.chemrev.6b00448 [DOI] [PubMed] [Google Scholar]
- 39.Kurouski D, Dazzi A, Zenobi R, Centrone A. Infrared and Raman chemical imaging and spectroscopy at the nanoscale. Chem Soc Rev. 2020;49(11):3315–3347. doi: 10.1039/c8cs00916c [DOI] [PMC free article] [PubMed] [Google Scholar]
- 40.Ruggeri FS, Mannini B, Schmid R, Vendruscolo M, Knowles TPJ. Single molecule secondary structure determination of proteins through infrared absorption nanospectroscopy. Nat Commun. 2020;11(1):2945. doi: 10.1038/s41467-020-16728-1 [DOI] [PMC free article] [PubMed] [Google Scholar]
- 41.Lu F, Jin MZ, Belkin MA. Tip-enhanced infrared nanospectroscopy via molecular expansion force detection. Nat Photon. 2014;8(4):307–312. doi: 10.1038/nphoton.2013.373 [DOI] [Google Scholar]
- 42.Ruggeri FS, Benedetti F, Knowles TPJ, Lashuel HA, Sekatskii S, Dietler G. Identification and nanomechanical characterization of the fundamental single-strand protofilaments of amyloid alpha-synuclein fibrils. Proc Natl Acad Sci U S A. 2018;115(28):7230–7235. doi: 10.1073/pnas.1721220115 [DOI] [PMC free article] [PubMed] [Google Scholar]
- 43.Ruggeri FS, Vieweg S, Cendrowska U, et al. Nanoscale studies link amyloid maturity with polyglutamine diseases onset. Sci Rep. 2016;6:31155. doi: 10.1038/srep31155 [DOI] [PMC free article] [PubMed] [Google Scholar]
- 44.Ramer G, Ruggeri FS, Levin A, Knowles TPJ, Centrone A. Determination of polypeptide conformation with nanoscale resolution in water. ACS Nano. 2018;12(7):6612–6619. doi: 10.1021/acsnano.8b01425 [DOI] [PMC free article] [PubMed] [Google Scholar]
- 45.Farber C, Li J, Hager E, et al. Complementarity of Raman and infrared spectroscopy for structural characterization of plant Epicuticular waxes. ACS Omega. 2019;4:3700–3707. [Google Scholar]
- 46.Farber C, Wang R, Chemelewski R, Mullet J, Kurouski D. Nanoscale structural organization of plant epicuticular wax probed by atomic force microscope infrared spectroscopy. Anal Chem. 2019;91(3):2472–2479. doi: 10.1021/acs.analchem.8b05294 [DOI] [PubMed] [Google Scholar]
- 47.Dazzi A PhotoThermal induced resonance. Application to infrared Spectromicroscopy. In: Volz S, ed. Thermal Nanosystems and Nanomaterials. Springer; 2009:469–503. Topics in Applied Physics. [Google Scholar]
- 48.Perez-Guaita D, Kochan K, Batty M, et al. Multispectral atomic force microscopy-infrared nano-imaging of malaria infected red blood cells. Anal Chem. 2018;90(5):3140–3148. doi: 10.1021/acs.analchem.7b04318 [DOI] [PubMed] [Google Scholar]
- 49.Dazzi A, Prazeres R, Glotin F, Ortega JM, Al-Sawaftah M, de Frutos M. Chemical mapping of the distribution of viruses into infected bacteria with a photothermal method. Ultramicroscopy. 2008;108(7):635–641. doi: 10.1016/j.ultramic.2007.10.008 [DOI] [PubMed] [Google Scholar]
- 50.Mayet C, Deniset-Besseau A, Prazeres R, Ortega JM, Dazzi A. Analysis of bacterial polyhydroxybutyrate production by mul-timodal nanoimaging. Biotechnol Adv. 2013;31(3):369–374. doi: 10.1016/j.biotechadv.2012.05.003 [DOI] [PubMed] [Google Scholar]
- 51.Kochan K, Perez-Guaita D, Pissang J, et al. In vivo atomic force microscopy-infrared spectroscopy of bacteria. J Royal Soc Interface. 2018;15(140):20180115. doi: 10.1098/rsif.2018.0115 [DOI] [PMC free article] [PubMed] [Google Scholar]
- 52.Wieland K, Ramer G, Weiss VU, Allmaier G, Lendl B, Centrone A. Nanoscale chemical imaging of individual chemotherapeutic cytarabine-loaded liposomal nanocarriers. Nano Res. 2019;12(1):197–203. doi: 10.1007/s12274-018-2202-x [DOI] [PMC free article] [PubMed] [Google Scholar]
- 53.Strelcov E, Dong Q, Li T, et al. CH3NH3PbI3 perovskites: ferroelasticity revealed. Sci Adv. 2017;3(4):e1602165. doi: 10.1126/sciadv.1602165 [DOI] [PMC free article] [PubMed] [Google Scholar]
- 54.Cook RL, Parker HM, Donges CE, et al. Omega-3 polyunsaturated fatty acids status and cognitive function in young women. Lipids Health Dis. 2019;18(1):194. doi: 10.1186/s12944-019-1143-z [DOI] [PMC free article] [PubMed] [Google Scholar]
- 55.Yurko-Mauro K, McCarthy D, Rom D, et al. Beneficial effects of docosahexaenoic acid on cognition in age-related cognitive decline. Alzheimers Dement. 2010;6(6):456–464. doi: 10.1016/j.jalz.2010.01.013 [DOI] [PubMed] [Google Scholar]
- 56.Abdelhamid AS, Martin N, Bridges C, et al. Polyunsaturated fatty acids for the primary and secondary prevention of cardio-vascular disease. Cochrane Database Syst Rev. 2018;7:CD012345. doi: 10.1002/14651858.CD012345.pub2 [DOI] [PMC free article] [PubMed] [Google Scholar]
- 57.Mozaffarian D, Ascherio A, Hu FB, et al. Interplay between different polyunsaturated fatty acids and risk of coronary heart disease in men. Circulation. 2005;111(2):157–164. doi: 10.1161/01.CIR.0000152099.87287.83 [DOI] [PMC free article] [PubMed] [Google Scholar]
- 58.Matveyenka M, Rizevsky S, Kurouski D. Amyloid aggregates exert cell toxicity causing irreversible damages in the endoplasmic reticulum. Biochim Biophys Acta Mol Basis Dis. 2022;1868(11):166485. doi: 10.1016/j.bbadis.2022.166485 [DOI] [PMC free article] [PubMed] [Google Scholar]
- 59.Dou T, Li Z, Zhang J, Evilevitch A, Kurouski D. Nanoscale structural characterization of individual viral particles using atomic force microscopy infrared spectroscopy (AFM-IR) and tip-enhanced Raman spectroscopy (TERS). Anal Chem. 2020;92(16):11297–11304. doi: 10.1021/acs.analchem.0c01971 [DOI] [PubMed] [Google Scholar]
- 60.Galvagnion C, Buell AK, Meisl G, et al. Lipid vesicles trigger alpha-synuclein aggregation by stimulating primary nucleation. Nat Chem Biol. 2015;11(3):229–234. doi: 10.1038/nchembio.1750 [DOI] [PMC free article] [PubMed] [Google Scholar]
- 61.Rizevsky S, Zhaliazka K, Matveyenka M, Quinn K, Kurouski D. Lipids reverse supramolecular chirality and reduce toxicity of amyloid fibrils. FEBS J. 2022;289:7537–7544. doi: 10.1111/febs.16564 [DOI] [PubMed] [Google Scholar]
Associated Data
This section collects any data citations, data availability statements, or supplementary materials included in this article.
Data Availability Statement
All the data in this study can be provided by the corresponding author if needed.